There is grave concern that some young adults are paying off their student loans:
In a growing refinancing boom, a new generation of private lenders — backed by hedge-fund billionaires and Silicon Valley royalty — is targeting successful graduates with professional degrees and student loans. For the borrowers, “it’s an uncashed lottery ticket,” said Brendan Coughlin, head of education finance for Citizens Financial Group Inc.
There’s a catch. Their good fortune could cost taxpayers billions and damage the credit quality of the government’s $1.2 trillion student-loan portfolio, the biggest pool of U.S. debt, except for mortgages. That’s because professional-school graduates and other borrowers with successful careers subsidize the less fortunate, who are more likely to default.
“Cream-skimming by private lenders will remove these profitable loans and leave mainly — or only — the more risky loans,” said James McAndrews, executive vice president and director of research at the Federal Reserve Bank of New York.
Precisely, Mr. McAndrews, and that’s just the way it should be. If the government decides that it is good policy to write loans to borderline students taking degrees in – shall we say – relatively impractical subjects because they’re easy … fine. That’s a political decision, made for (in theory) the greater good of society and elected representatives will (in theory) be accountable for the decision. But since it’s for the greater good of society, society as a whole should pay for it … it should not be paid by excessive, disproportionate taxation on young, smart STEM graduates.

Click for Big
Fixed income volatility is causing some scratching of heads:
The gyrations gripping the world’s fixed-income market are so great that it’s almost impossible to make sense of them on a historical basis. In Germany, for example, yields on 10-year securities have surged from almost nothing in late April to about 1 percent last week — a move so swift that some strategists are likening it to a once-in-a-generation event.
…
Across Europe, investors are ripping up their old models to analyze the $100 trillion global bond market that dictates how much consumers and companies pay to borrow. Volatility is soaring as central-bank policies diverge, whiffs of inflation emerge and new regulations cause big banks to back away from their traditional role facilitating buying and selling.
…
BlackRock is testing how risky its holdings are by running them through new worst-case scenarios that assume more volatility and varying correlation among asset classes. And strategists at JPMorgan Chase & Co., the world’s biggest debt underwriter, now see the need to calculate a “liquidity premium” for top-rated, longer-maturity government bonds in Europe, a new wrinkle for benchmark securities that are considered the safest assets available because of their deep markets.
…
Yield volatility on 10-year bunds has climbed to nine-times its average during the past 15 years, giving traders a taste of the turbulence European Central Bank President Mario Draghi said June 3 they should get used to as the byproduct of record monetary stimulus.A measure of 30-day volatility on bunds surged to 300 percent in May. It hadn’t gone above 100 before this year, in data compiled by Bloomberg going back to the middle of 2005. The market’s gyrations are being magnified by record-low yields: In the week of Draghi’s remarks, yields soared 0.36 percentage point, the biggest jump since 1998. The yield was at 0.82 percent on Monday at 6:19 a.m. in New York, up from a record of 0.049 percent on April 17.
Hank Greenberg won on principle, but lost on cash:
Hank Greenberg won his fight to hold the U.S. responsible for the bitter pill it forced down the throat of American International Group Inc. shareholders. But that’s about it.
The judge who called the terms of the $85 billion bailout illegally onerous also ruled that without it investors would have gotten nothing. As a result, he awarded Greenberg no money.
The split-decision sets up the possibility that both sides will appeal, and that a battle over a key element of the government response to the 2008 financial crisis will continue for months or years to come.
“In the end, the Achilles’ heel of Starr’s case is that, if not for the government’s intervention, AIG would have filed for bankruptcy,” U.S. Court of Claims Judge Thomas Wheeler said. “AIG’s shareholders would most likely have lost 100 percent of their stock value.”
In response, the Fed issued a press release:
The Federal Reserve strongly believes that its actions in the AIG rescue during the height of the financial crisis in 2008 were legal, proper and effective. The court’s decision today in Starr International Company, Inc. v. the United States recognizes that AIG’s shareholders are not entitled to compensation for that decision, and that the Federal Reserve’s extension of credit to AIG prevented losses to millions of policyholders, small businesses, and American workers who would have been harmed by AIG’s collapse during the financial crisis. The terms of the credit were appropriately tough to protect taxpayers from the risks the rescue loan presented when it was made.
I take issue with that. In the first place, it is not the business of a central bank to make risky loans. Central banks must restrict themselves to loans made to solvent institutions, where the loans are secured by sound collateral, and the interest rate is punitive. Otherwise you wind up with the danger of a politicized institution determining who goes into selective bankruptcy. This is classical central banking that dates back to Bagehot.
If the “authorities” feel that bankruptcy will lead to horrible knock-on effects and the path of least evil is a bail-out … fine. But that’s a political decision; if AIG was to have been bailed out, it should have been by the Treasury Department.
In the second place, it is not entirely clear to me why the bankruptcy of the holding company should have led to such horrid knock-on effects. The company with the biggest exposure to AIG – which was Goldman Sachs – proved itself to be the only institution on Wall Street that had the brains it was born with when it showed that all the exposure to bankruptcy had been laid off to third parties. All the bail-out money left the country; some of it helped out CIBC.
Jamie Dimon had some good things to say about proxy advisors:
JPMorgan Chase & Co. Chief Executive Officer Jamie Dimon chided shareholders as “lazy” for casting votes at annual meetings based on the advice of proxy advisers.
“God knows how any of you can place your vote based on ISS or Glass Lewis,” Dimon, 59, said Wednesday at an investor conference in New York. “If you do that, you are just irresponsible, I’m sorry. And you probably aren’t a very good investor, either.”
JPMorgan’s board is reviewing how it pays top executives including Dimon after a record low percentage of shareholders voted this month to approve their latest packages. Investors are seeking that a greater portion of executives’ incentive pay be based on performance, Lee Raymond, the board’s lead director and chairman of the compensation committee, said at the firm’s annual meeting May 19.
Proxy advisers Institutional Shareholder Services and Glass Lewis & Co. had recommended investors reject the pay resolution, saying the bank lacks preset goals to determine compensation and didn’t give a good reason for giving Dimon his first cash bonus in three years.
It may have been inspired by a fit of pique over his pay, but he’s right anyway … well, mostly. It does not reflect well on the industry – but Portfolio Managers just don’t have time to examine a routine proxy vote carefully. Quick – how many issues are there in the S&P 500? Did you say 500? Award yourself a kewpie doll! Now do some quick arithmetic … that’s two companies per day. And how big a team is going to make the decisions? I mean, really? Four, tops, maybe? At most shops, one? Being generous? And this is after having to plough through such trivia as, you know, investment qualities? Give me a break. Proxy votes will only be examined carefully when they are meaningful; routine director elections will be rubber-stamped … except that rubber-stamping is illegal nowadays. OK, fine, hire an advisory company and pay them whatever it takes to keep the business legal. Stick the charge onto the MER. No problem. Granny’s got lots of money.
Who remembers Cracked magazine? It was the a defining symbol of twelve year old hipsters in the 1970s who found it more authentic than Mad magazine. Anyway, it’s been through several incarnations and is now a website attempting to appeal to young men; it’s a men’s magazine without the boobs, which means that their stock in trade is they look at actual issues or experiences from a first person perspective and report it in the ever-popular list format with a large dollop of (often rather predictable) sardonic humour. Much of it is quite good; they recently published 5 Nightmare Realities When Your Money Is Suddenly Worthless, giving a personal perspective of what it was like in Zimbabwe during their period of hyperinflation.
It was a mixed day for the Canadian preferred share market, with PerpetualDiscounts gaining 4bp, FixedResets off 31bp and DeemedRetractibles up 16bp. Floaters got hammered; BAM FixedResets were prominent losers on the Performance Highlights table. Volume was well above average.
For as long as the FixedReset market is so violently unsettled, I’ll keep publishing updates of the more interesting and meaningful series of FixedResets’ Implied Volatilities. This doesn’t include Enbridge because although Enbridge has a large number of issues outstanding, all of which are quite liquid, the range of Issue Reset Spreads is too small for decent conclusions. The low is 212bp (ENB.PR.H; second-lowest is ENB.PR.D at 237bp) and the high is a mere 268 for ENB.PF.G.
Remember that all rich /cheap assessments are:
» based on Implied Volatility Theory only
» are relative only to other FixedResets from the same issuer
» assume constant GOC-5 yield
» assume constant Implied Volatility
» assume constant spread
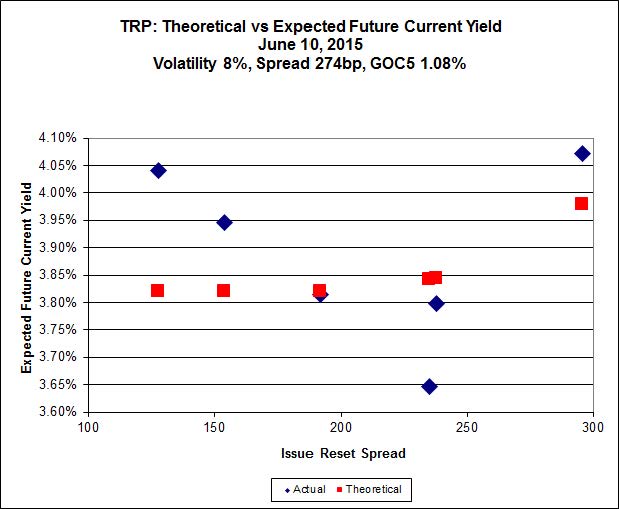
Here’s TRP:

Click for Big
TRP.PR.A, which resets 2019-12-31 at +192, is bid at 19.90 to be $0.53 rich, while TRP.PR.B, which will reset June 30 at 2.152% (+128), is $0.44 cheap at its bid price of 14.65

Click for Big
Another excellent fit, but the numbers are perplexing. Implied Volatility for MFC continues to be a conundrum. It is still too high if we consider that NVCC rules will never apply to these issues; it is still too low if we consider them to be NVCC non-compliant issues (and therefore with Deemed Maturities in the call schedule).
Most expensive is MFC.PR.M, resetting at +236bp on 2019-12-19, bid at 23.63 to be $0.44 rich, while MFC.PR.H, resetting at +313bp on 2017-3-19, is bid at 25.36 to be $0.47 cheap.

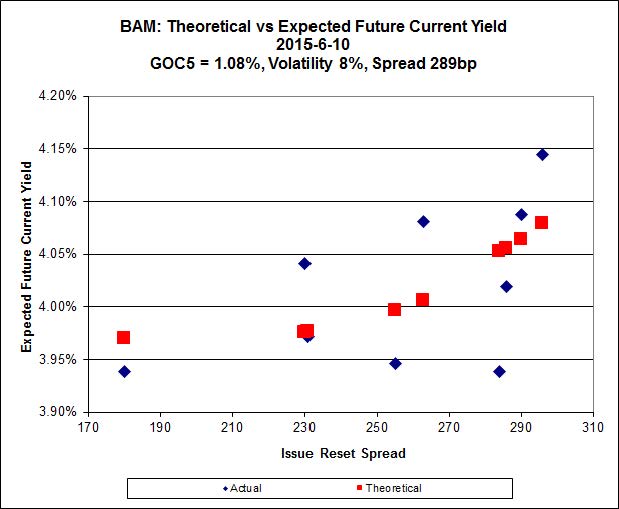
Click for Big
The cheapest issue relative to its peers is BAM.PR.R, resetting at +230bp on 2016-6-30, bid at 19.80 to be $0.62 cheap. BAM.PF.G, resetting at +284bp 2020-6-30 is bid at 24.15 and appears to be $0.53 rich.

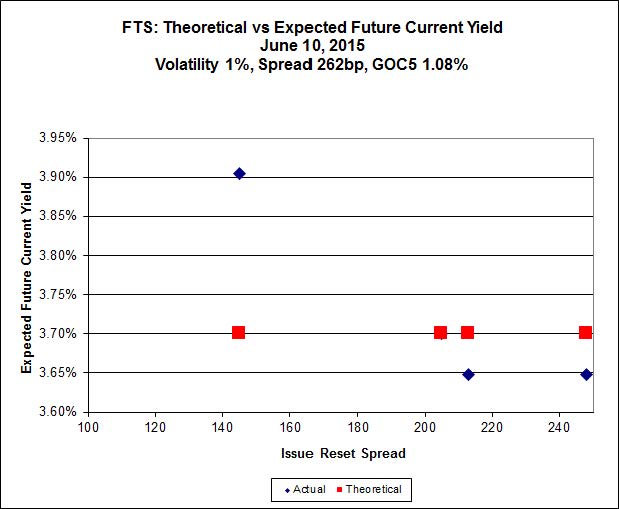
Click for Big
FTS.PR.H, with a spread of +145bp, and bid at 16.41, looks $0.47 cheap and resets 2020-6-1. FTS.PR.M, with a spread of +248bp and resetting 2019-12-1, is bid at 24.45 and is $0.36 rich.

Click for Big
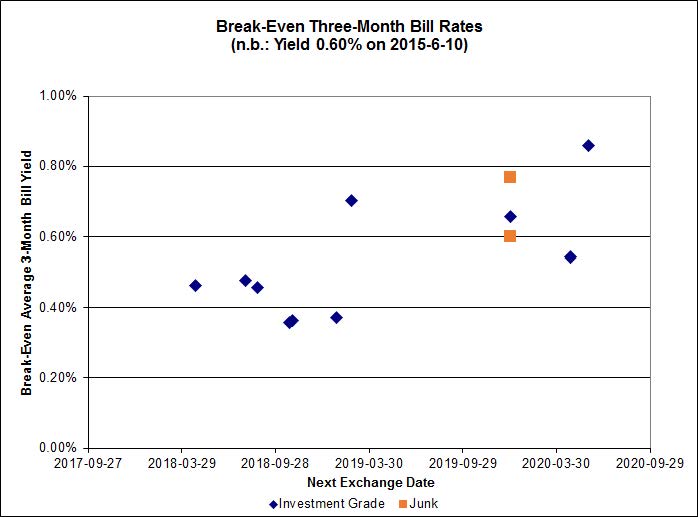
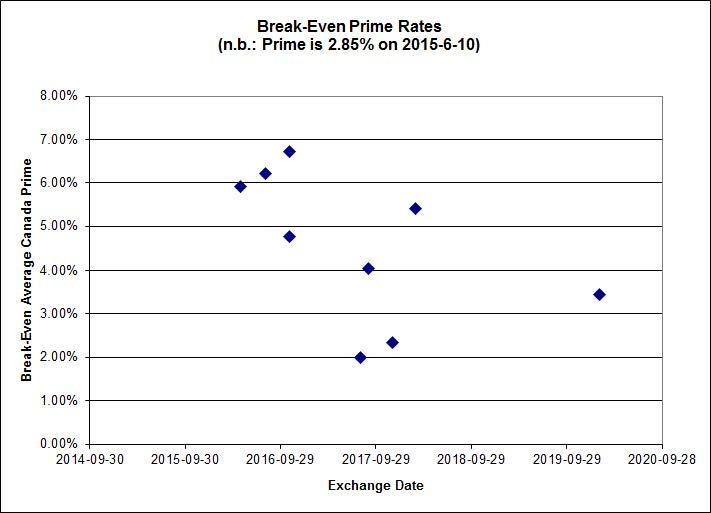
Investment-grade pairs predict an average three-month bill yield over the next five-odd years of about 0.45%, with no ridiculous outliers. On the junk side, three out of the six pairs are outside the range of the graph: FFH.PR.E / FFH.PR.F at -1.23%; AIM.PR.A / AIM.PR.B at -0.37%; and DC.PR.B / DC.PR.D at -1.32%.

Click for Big
Shall we just say that this exhibits a high level of confidence in the continued rapacity of Canadian banks?
| HIMIPref™ Preferred Indices These values reflect the December 2008 revision of the HIMIPref™ Indices Values are provisional and are finalized monthly |
|||||||
| Index | Mean Current Yield (at bid) |
Median YTW |
Median Average Trading Value |
Median Mod Dur (YTW) |
Issues | Day’s Perf. | Index Value |
| Ratchet | 0.00 % | 0.00 % | 0 | 0.00 | 0 | -2.7740 % | 2,195.1 |
| FixedFloater | 0.00 % | 0.00 % | 0 | 0.00 | 0 | -2.7740 % | 3,838.1 |
| Floater | 3.53 % | 3.54 % | 62,756 | 18.44 | 3 | -2.7740 % | 2,333.6 |
| OpRet | 4.44 % | -11.69 % | 25,402 | 0.08 | 2 | 0.0000 % | 2,782.9 |
| SplitShare | 4.60 % | 4.92 % | 69,997 | 3.29 | 3 | -0.2010 % | 3,242.3 |
| Interest-Bearing | 0.00 % | 0.00 % | 0 | 0.00 | 0 | 0.0000 % | 2,544.7 |
| Perpetual-Premium | 5.46 % | 4.92 % | 59,945 | 4.92 | 19 | 0.0311 % | 2,513.7 |
| Perpetual-Discount | 5.12 % | 5.08 % | 105,224 | 15.22 | 15 | 0.0369 % | 2,745.1 |
| FixedReset | 4.52 % | 3.87 % | 242,259 | 16.40 | 87 | -0.3114 % | 2,347.2 |
| Deemed-Retractible | 5.00 % | 3.24 % | 109,877 | 0.68 | 34 | 0.1576 % | 2,625.5 |
| FloatingReset | 2.51 % | 2.90 % | 52,751 | 6.12 | 9 | 0.1624 % | 2,339.1 |
| Performance Highlights | |||
| Issue | Index | Change | Notes |
| BAM.PR.K | Floater | -3.91 % | YTW SCENARIO Maturity Type : Limit Maturity Maturity Date : 2045-06-15 Maturity Price : 14.01 Evaluated at bid price : 14.01 Bid-YTW : 3.55 % |
| BAM.PR.B | Floater | -2.38 % | YTW SCENARIO Maturity Type : Limit Maturity Maturity Date : 2045-06-15 Maturity Price : 14.34 Evaluated at bid price : 14.34 Bid-YTW : 3.47 % |
| BAM.PF.A | FixedReset | -2.09 % | YTW SCENARIO Maturity Type : Limit Maturity Maturity Date : 2045-06-15 Maturity Price : 22.64 Evaluated at bid price : 23.41 Bid-YTW : 4.23 % |
| IFC.PR.A | FixedReset | -2.05 % | YTW SCENARIO Maturity Type : Hard Maturity Maturity Date : 2025-01-31 Maturity Price : 25.00 Evaluated at bid price : 20.03 Bid-YTW : 5.94 % |
| BAM.PR.C | Floater | -2.02 % | YTW SCENARIO Maturity Type : Limit Maturity Maturity Date : 2045-06-15 Maturity Price : 14.06 Evaluated at bid price : 14.06 Bid-YTW : 3.54 % |
| BAM.PR.R | FixedReset | -1.88 % | YTW SCENARIO Maturity Type : Limit Maturity Maturity Date : 2045-06-15 Maturity Price : 19.80 Evaluated at bid price : 19.80 Bid-YTW : 4.30 % |
| BAM.PF.E | FixedReset | -1.68 % | YTW SCENARIO Maturity Type : Limit Maturity Maturity Date : 2045-06-15 Maturity Price : 21.80 Evaluated at bid price : 22.22 Bid-YTW : 4.22 % |
| NA.PR.S | FixedReset | -1.60 % | YTW SCENARIO Maturity Type : Limit Maturity Maturity Date : 2045-06-15 Maturity Price : 23.13 Evaluated at bid price : 24.65 Bid-YTW : 3.50 % |
| ENB.PR.B | FixedReset | -1.50 % | YTW SCENARIO Maturity Type : Limit Maturity Maturity Date : 2045-06-15 Maturity Price : 17.75 Evaluated at bid price : 17.75 Bid-YTW : 4.92 % |
| MFC.PR.N | FixedReset | -1.33 % | YTW SCENARIO Maturity Type : Hard Maturity Maturity Date : 2025-01-31 Maturity Price : 25.00 Evaluated at bid price : 23.00 Bid-YTW : 4.62 % |
| BAM.PF.F | FixedReset | -1.28 % | YTW SCENARIO Maturity Type : Limit Maturity Maturity Date : 2045-06-15 Maturity Price : 22.80 Evaluated at bid price : 23.94 Bid-YTW : 4.11 % |
| BIP.PR.A | FixedReset | -1.19 % | YTW SCENARIO Maturity Type : Limit Maturity Maturity Date : 2045-06-15 Maturity Price : 22.80 Evaluated at bid price : 24.06 Bid-YTW : 4.65 % |
| FTS.PR.G | FixedReset | -1.10 % | YTW SCENARIO Maturity Type : Limit Maturity Maturity Date : 2045-06-15 Maturity Price : 21.30 Evaluated at bid price : 21.60 Bid-YTW : 3.76 % |
| ENB.PR.T | FixedReset | -1.07 % | YTW SCENARIO Maturity Type : Limit Maturity Maturity Date : 2045-06-15 Maturity Price : 18.50 Evaluated at bid price : 18.50 Bid-YTW : 4.92 % |
| BAM.PF.G | FixedReset | -1.02 % | YTW SCENARIO Maturity Type : Limit Maturity Maturity Date : 2045-06-15 Maturity Price : 22.84 Evaluated at bid price : 24.15 Bid-YTW : 4.06 % |
| RY.PR.M | FixedReset | -1.02 % | YTW SCENARIO Maturity Type : Limit Maturity Maturity Date : 2045-06-15 Maturity Price : 22.90 Evaluated at bid price : 24.35 Bid-YTW : 3.67 % |
| SLF.PR.A | Deemed-Retractible | 1.07 % | YTW SCENARIO Maturity Type : Hard Maturity Maturity Date : 2025-01-31 Maturity Price : 25.00 Evaluated at bid price : 23.55 Bid-YTW : 5.54 % |
| BMO.PR.Q | FixedReset | 1.11 % | YTW SCENARIO Maturity Type : Hard Maturity Maturity Date : 2022-01-31 Maturity Price : 25.00 Evaluated at bid price : 23.58 Bid-YTW : 3.48 % |
| HSE.PR.A | FixedReset | 1.76 % | YTW SCENARIO Maturity Type : Limit Maturity Maturity Date : 2045-06-15 Maturity Price : 16.20 Evaluated at bid price : 16.20 Bid-YTW : 4.35 % |
| GWO.PR.R | Deemed-Retractible | 2.38 % | YTW SCENARIO Maturity Type : Hard Maturity Maturity Date : 2025-01-31 Maturity Price : 25.00 Evaluated at bid price : 24.50 Bid-YTW : 5.07 % |
| FTS.PR.I | FloatingReset | 2.43 % | YTW SCENARIO Maturity Type : Limit Maturity Maturity Date : 2045-06-15 Maturity Price : 16.05 Evaluated at bid price : 16.05 Bid-YTW : 3.23 % |
| Volume Highlights | |||
| Issue | Index | Shares Traded |
Notes |
| BNS.PR.N | Deemed-Retractible | 83,560 | YTW SCENARIO Maturity Type : Call Maturity Date : 2016-01-27 Maturity Price : 25.25 Evaluated at bid price : 25.70 Bid-YTW : 3.35 % |
| SLF.PR.G | FixedReset | 74,736 | Reset imminent, last day to tender for exchange. YTW SCENARIO Maturity Type : Hard Maturity Maturity Date : 2025-01-31 Maturity Price : 25.00 Evaluated at bid price : 15.85 Bid-YTW : 7.94 % |
| MFC.PR.G | FixedReset | 71,323 | YTW SCENARIO Maturity Type : Hard Maturity Maturity Date : 2025-01-31 Maturity Price : 25.00 Evaluated at bid price : 25.00 Bid-YTW : 3.99 % |
| FTS.PR.M | FixedReset | 63,826 | YTW SCENARIO Maturity Type : Limit Maturity Maturity Date : 2045-06-15 Maturity Price : 23.00 Evaluated at bid price : 24.45 Bid-YTW : 3.61 % |
| MFC.PR.M | FixedReset | 53,801 | YTW SCENARIO Maturity Type : Hard Maturity Maturity Date : 2025-01-31 Maturity Price : 25.00 Evaluated at bid price : 23.63 Bid-YTW : 4.35 % |
| TD.PR.T | FloatingReset | 51,710 | YTW SCENARIO Maturity Type : Hard Maturity Maturity Date : 2022-01-31 Maturity Price : 25.00 Evaluated at bid price : 24.24 Bid-YTW : 2.77 % |
| There were 45 other index-included issues trading in excess of 10,000 shares. | |||
| Wide Spread Highlights | ||
| Issue | Index | Quote Data and Yield Notes |
| BAM.PF.A | FixedReset | Quote: 23.41 – 23.93 Spot Rate : 0.5200 Average : 0.3142 YTW SCENARIO |
| TD.PF.A | FixedReset | Quote: 23.30 – 23.80 Spot Rate : 0.5000 Average : 0.3130 YTW SCENARIO |
| TRP.PR.A | FixedReset | Quote: 19.90 – 20.29 Spot Rate : 0.3900 Average : 0.2632 YTW SCENARIO |
| BAM.PF.E | FixedReset | Quote: 22.22 – 22.60 Spot Rate : 0.3800 Average : 0.2609 YTW SCENARIO |
| FTS.PR.I | FloatingReset | Quote: 16.05 – 16.70 Spot Rate : 0.6500 Average : 0.5497 YTW SCENARIO |
| MFC.PR.C | Deemed-Retractible | Quote: 22.43 – 22.80 Spot Rate : 0.3700 Average : 0.2703 YTW SCENARIO |