Here’s a sign of the times from Pengrowth:
Pengrowth’s (TSX:PGF)(NYSE:PGH) Board of Directors has approved a change to the Company’s dividend policy, moving to a quarterly payment at a rate of $0.01 per share per quarter ($0.04 per share annually), as a result of the continued weakness in commodity prices. With the macro environment continuing to deteriorate and given the outlook for a prolonged weakness in commodity prices, the Company believes that it is prudent to preserve capital and accelerate its efforts to reduce overall indebtedness.
The new dividend policy will take effect following the payment of the $0.02 per share dividend payable on September 15, 2015 with the first quarterly payment expected to be paid on December 15, 2015.
…
Pengrowth remains committed to taking actions to ensure the Company lives within its cash flow and looking at all options to reduce its overall indebtedness. Today’s dividend reduction is consistent with all of the measures the Company has taken in 2015 to counter the impact of falling prices and preserve its financial liquidity.These measures include:
- •A 78 percent reduction in anticipated 2015 capital spending compared to 2014.
- •Targeted non-core asset sales of $600 million in 2015.
- •Continued focus on capital cost reductions, resulting in a 20 to 25 percent reduction for most types of services.
- •Ongoing staffing re-alignments with a seven percent reduction in head office full-time staff in the last nine months.
- •Commitment to ongoing hedging efforts to protect future cash flows and capital programs.
In the absence of stronger commodity prices, Pengrowth would expect 2016 capital spending to be under $100 million.
And here’s another sign of the times from Rob Carrick:
If you think the stock market has been nasty lately, you should check out what preferred shares have gone through.
It’s a slaughter, really. These supposedly low-risk widow-and-orphan stocks are in a bear market that looks much worse than what the broader market has been through. The S&P/TSX composite index was down 11.3 per cent for the 12 months to Aug. 31, while the S&P/TSX preferred share index was down 19.5 per cent. The composite has made 15.5 per cent in total for the five years to Aug. 31, while the pref share index is down about 21 per cent.
Regrettably, the piece states:
What will bring the pref market back this time? Possibly the 5.5 per cent yield now being generated by the preferred share index. At a time when five-year Government of Canada bonds yield 0.75 per cent, that’s quite the value proposition.
The 5.5% yield must be Current Yield; while I consider the conclusion reasonable enough, the use of inapplicable data to support it detracts from the article. It should also be noted that Mr. Carrick’s quoted returns are based on price indices, rather than total return, which makes a bit of a difference! The following table by no means changes the conclusion, but is a bit more precise:
| Comparison of ^SPTSX and ^TXPR | ||
| Index | 1-Year | 5-Year Cumulative |
| Price Indices | ||
| ^SPTSX | -11.31% | +16.33% |
| ^TXPR | -19.50% | -20.71 |
| Total Return Indices | ||
| ^SPTSX | -8.28 | +34.4% |
| ^TXPR | -15.44% | +1.88% |
The IMF brings happy news and analysis:
Global growth in the first half of 2015 was lower than in the second half of 2014, reflecting a further slowdown in emerging economies and a weaker recovery in advanced economies … Financial conditions for emerging economies have tightened … Risks are tilted to the downside, and a simultaneous realization of some of these risks would imply a much weaker outlook.
So what should we do?
Advanced economies should maintain supportive policies. In most advanced economies substantial output gaps and below-target inflation suggest that the monetary stance must stay accommodative. Fiscal policy should remain growth friendly and be anchored in credible medium-term plans. Managing high public debt in a low-growth and low-inflation environment remains a key challenge.
It was a good day for the Canadian preferred share market, with PerpetualDiscounts winning 47bp, FixedResets up 33bp and DeemedRetractibles gaining 7bp. Floaters did really well! The Performance Highlights table is its usual extremely lengthy self. Volume was on the low side of average.
PerpetualDiscounts now yield 5.49%, equivalent to 7.14% interest at the standard equivalency factor of 1.3x. Long corporates now yield about 4.15%, so the pre-tax interest-equivalent spread is now about 300bp, a sharp narrowing from the 325bp reported August 26.
For as long as the FixedReset market is so violently unsettled, I’ll keep publishing updates of the more interesting and meaningful series of FixedResets’ Implied Volatilities. This doesn’t include Enbridge because although Enbridge has a large number of issues outstanding, all of which are quite liquid, the range of Issue Reset Spreads is too small for decent conclusions. The low is 212bp (ENB.PR.H; second-lowest is ENB.PR.D at 237bp) and the high is a mere 268 for ENB.PF.G.
Remember that all rich /cheap assessments are:
» based on Implied Volatility Theory only
» are relative only to other FixedResets from the same issuer
» assume constant GOC-5 yield
» assume constant Implied Volatility
» assume constant spread
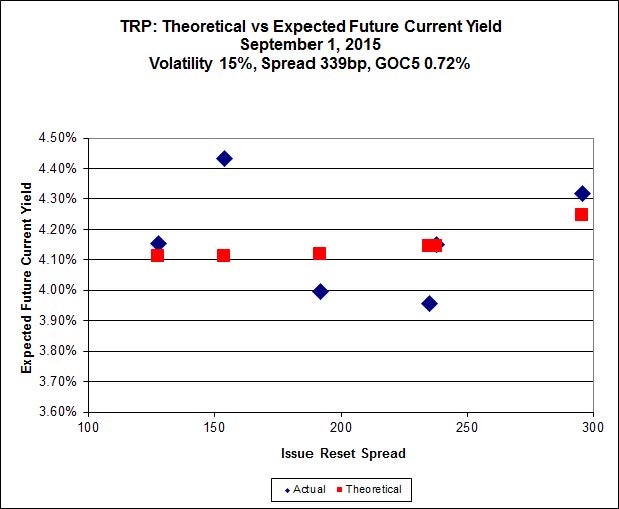
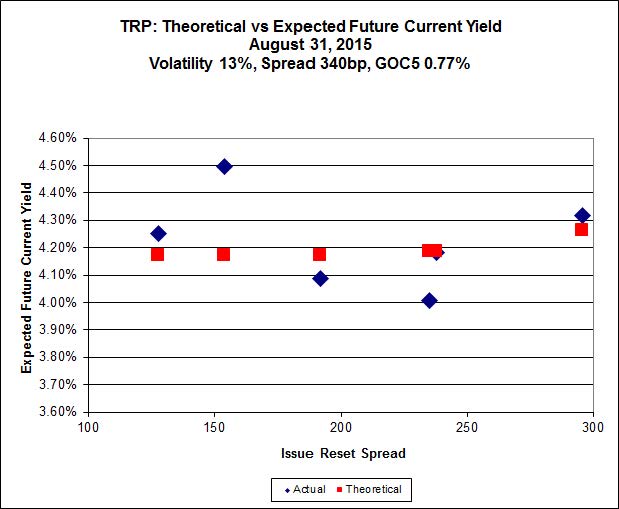
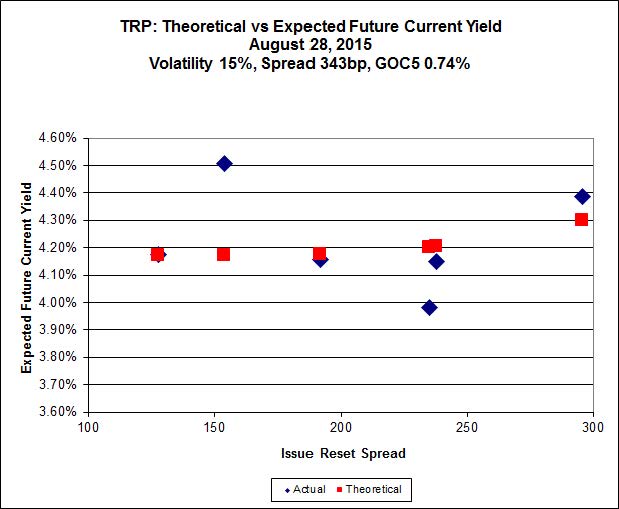
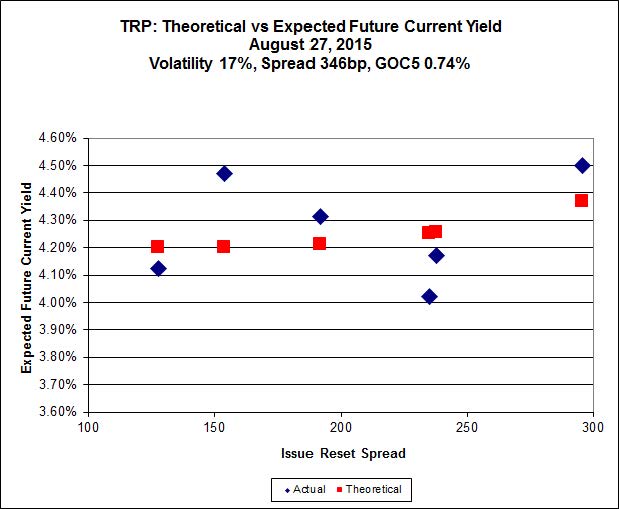
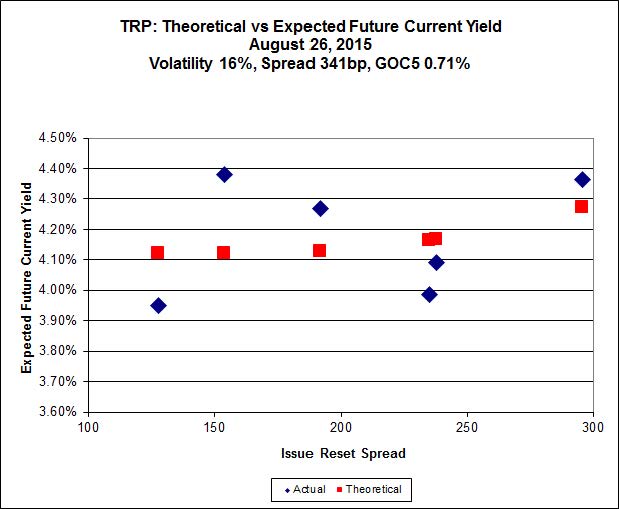
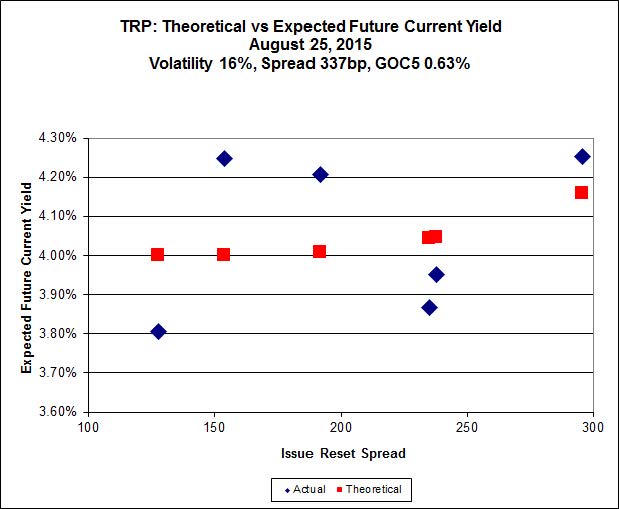
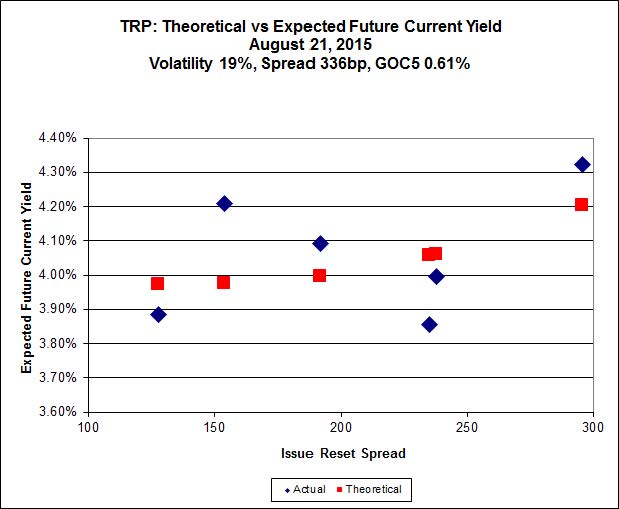
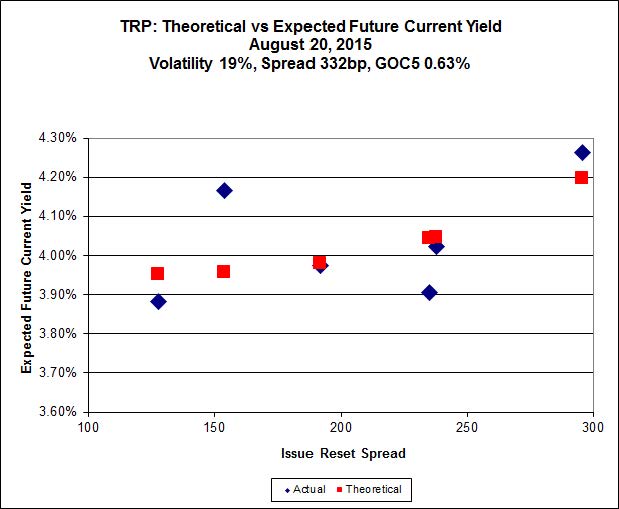
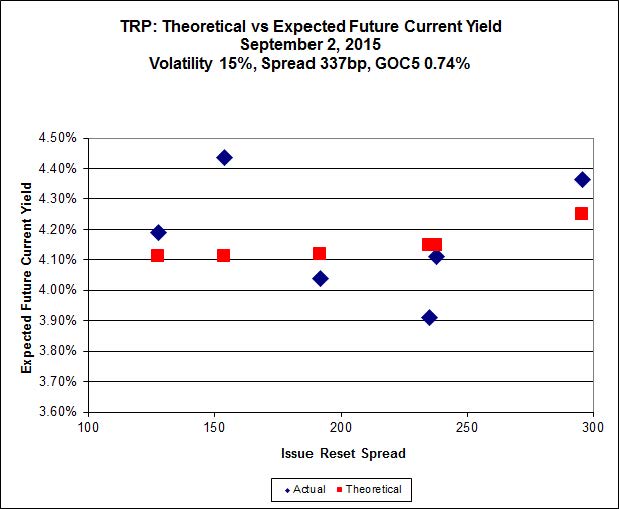
Here’s TRP:
Click for Big
TRP.PR.E, which resets 2019-10-30 at +235, is bid at 19.75 to be $1.12 rich, while TRP.PR.C, resetting 2016-1-30 at +164, is $1.02 cheap at its bid price of 12.85.
Click for Big
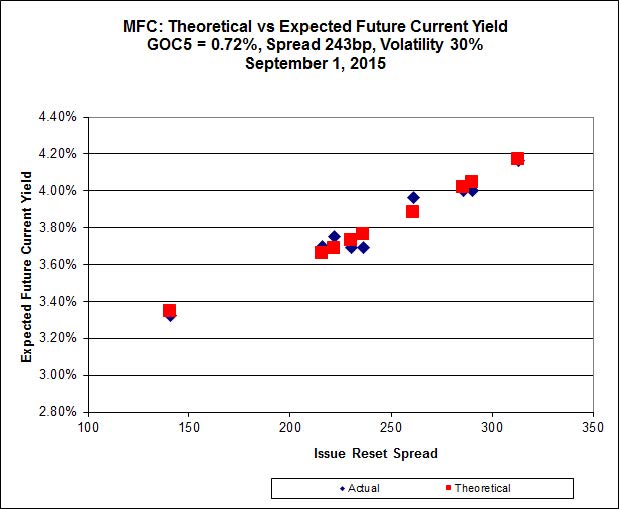
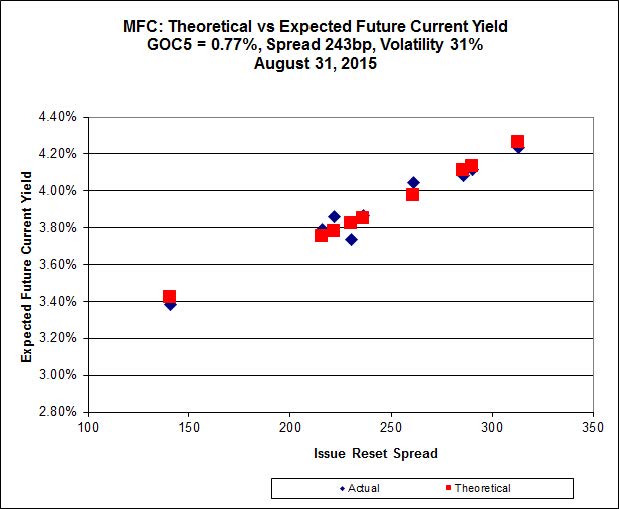
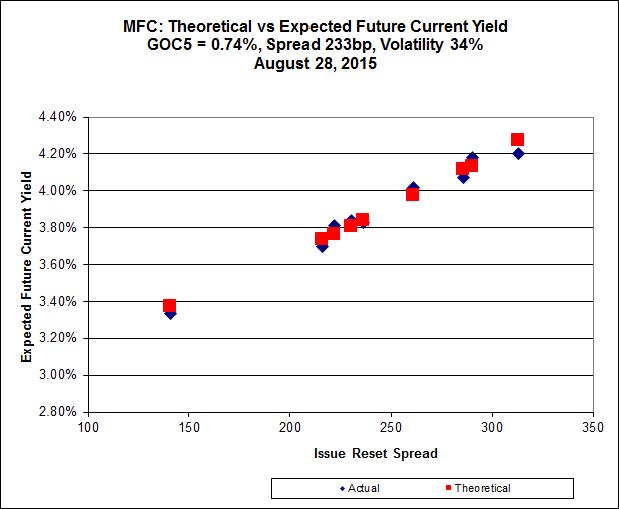
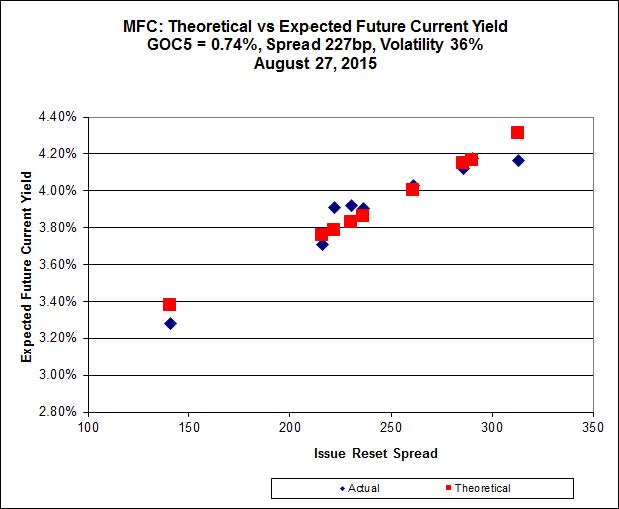
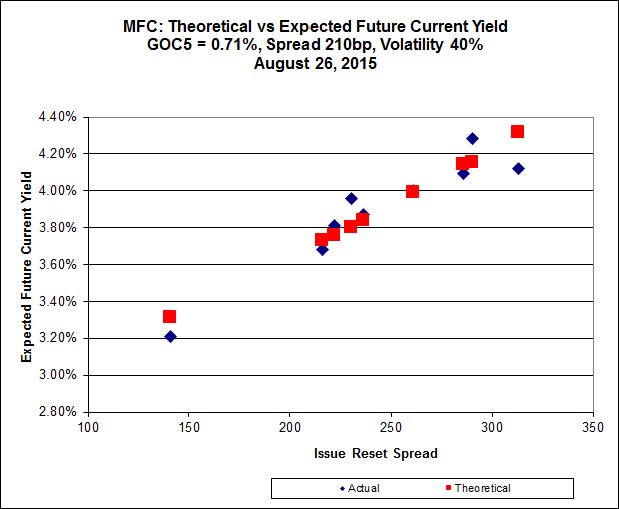
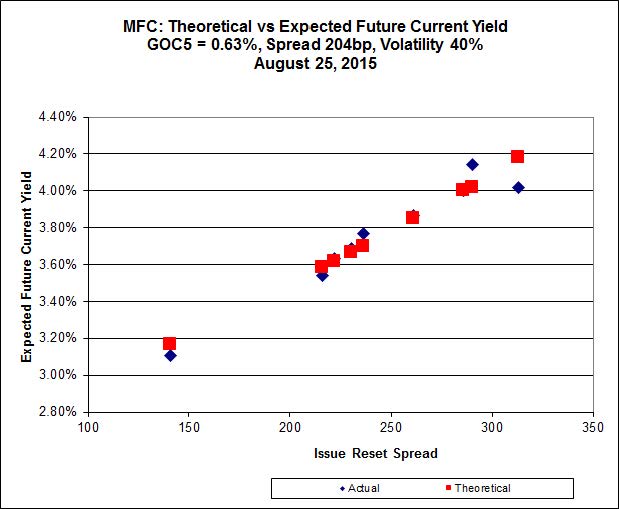
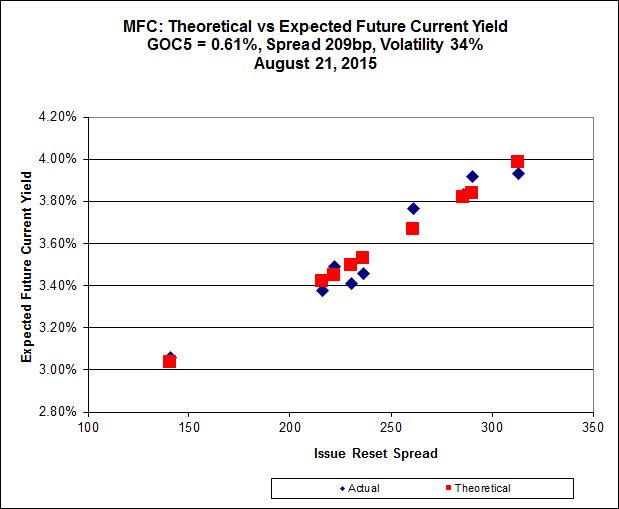
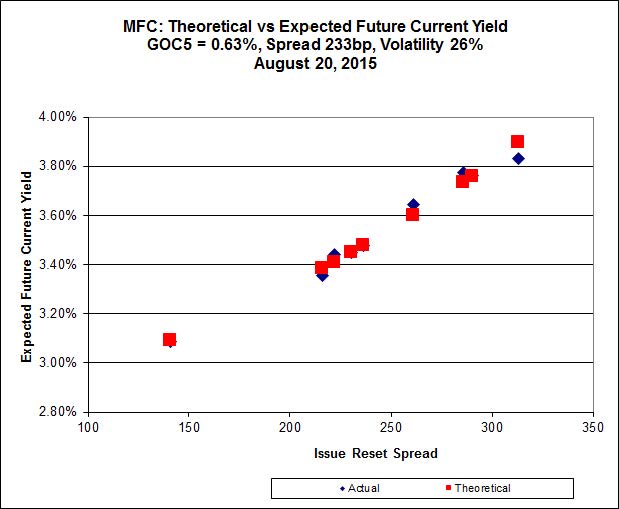
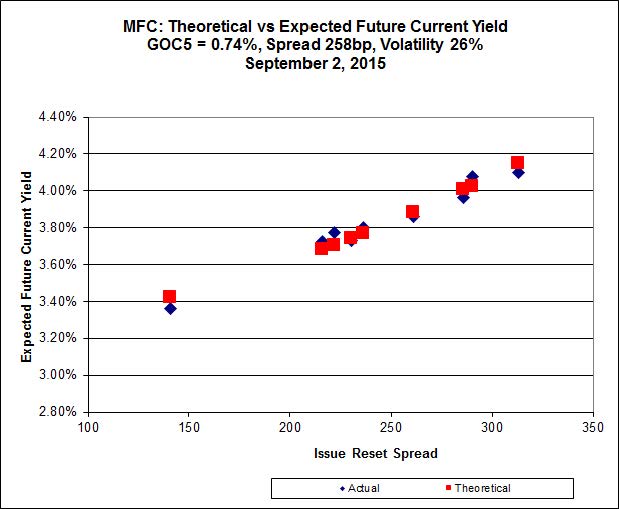
Another good fit today for MFC, with Implied Volatility dropping a bit again today.
Most expensive is MFC.PR.F, resetting at +141bp on 2016-6-19, bid at 16.00 to be 0.30 rich, while MFC.PR.K, resetting at +222bp on 2018-9-19, is bid at 19.61 to be 0.37 cheap.
Click for Big
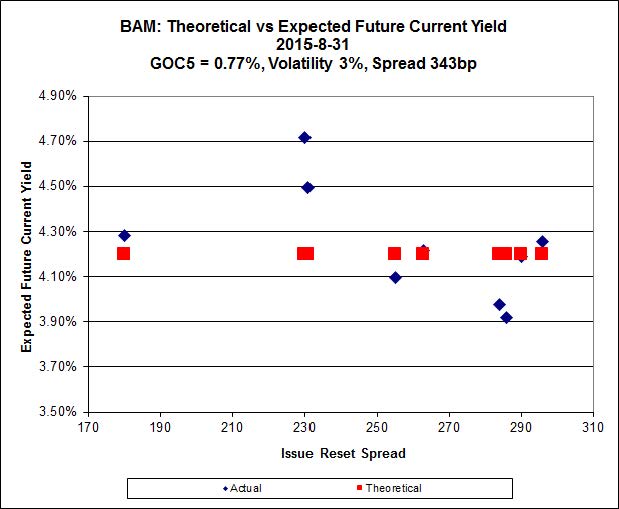
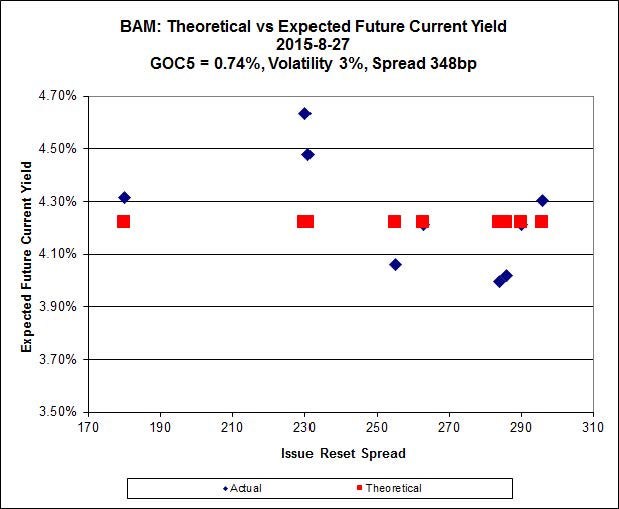
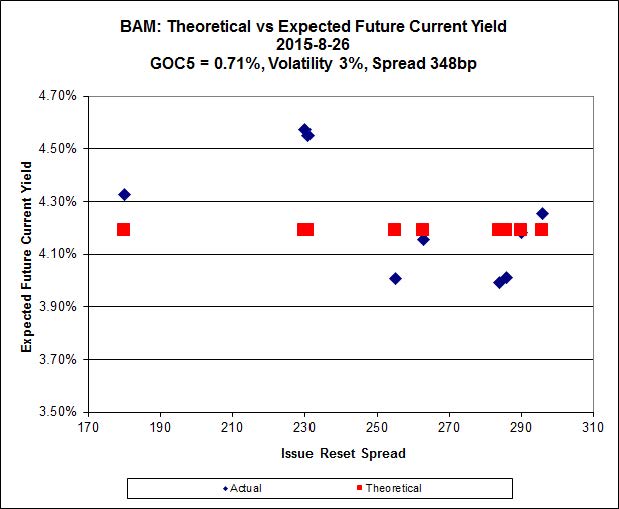
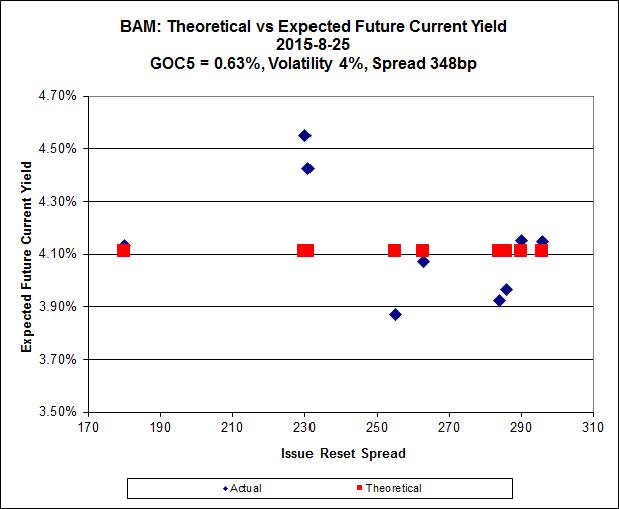
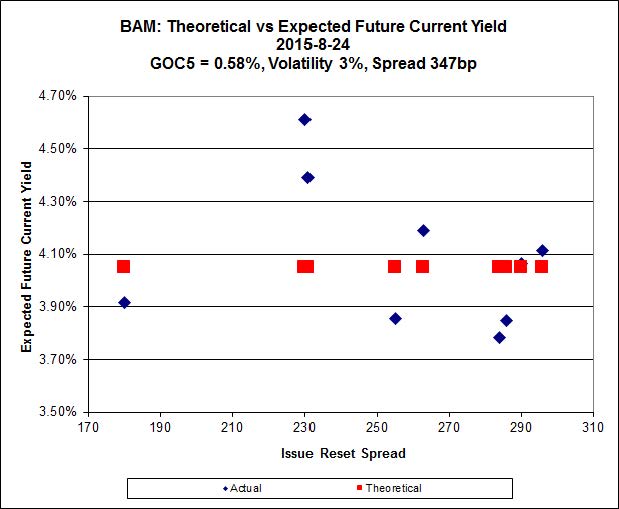
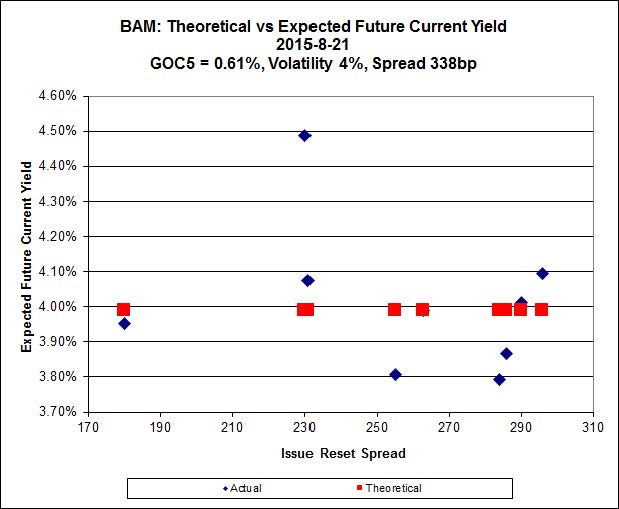
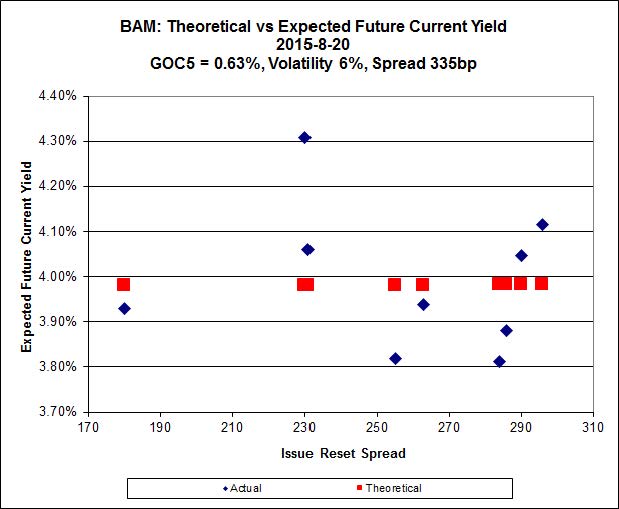
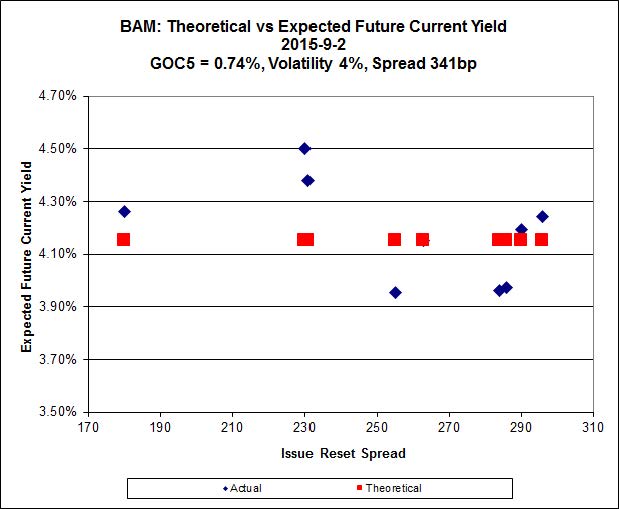
The fit on the BAM issues continues to be horrible.
The cheapest issue relative to its peers is BAM.PR.R, resetting at +230bp on 2016-6-30, bid at 16.89 to be $1.42 cheap. BAM.PF.G, resetting at +284bp on 2020-6-30 is bid at 22.60 and appears to be $1.03 rich.
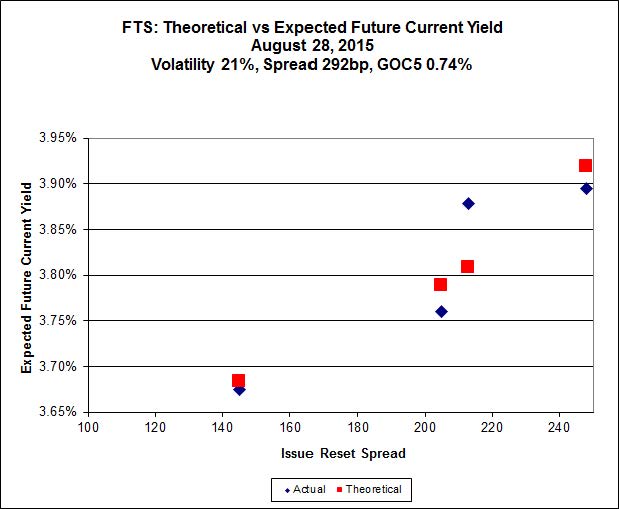
Click for Big
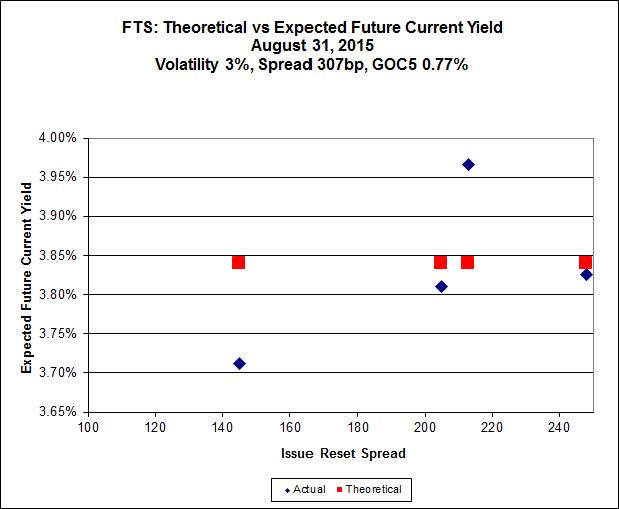
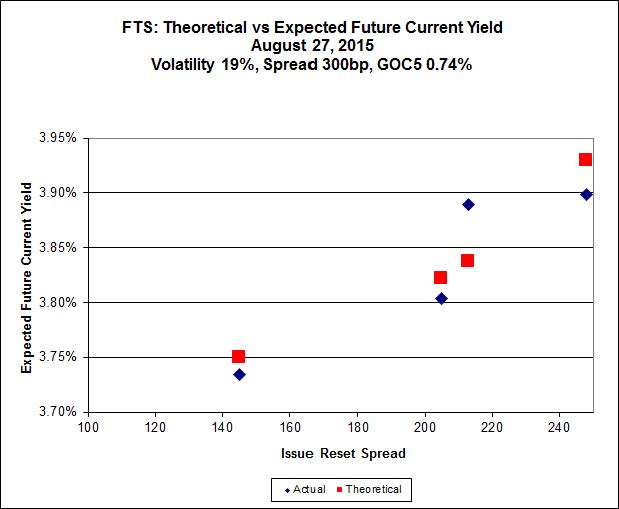
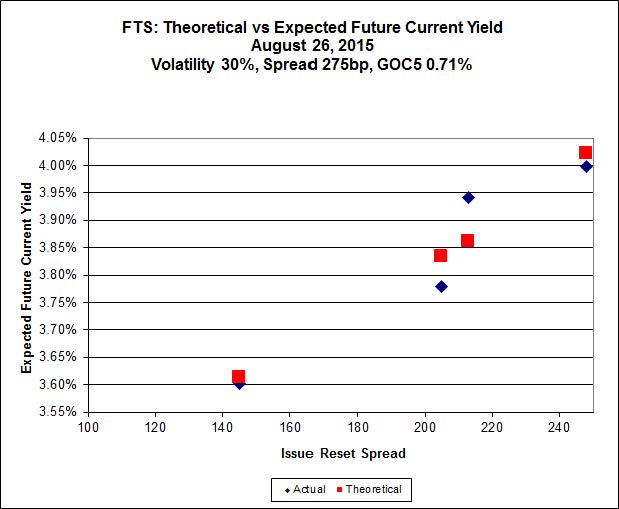
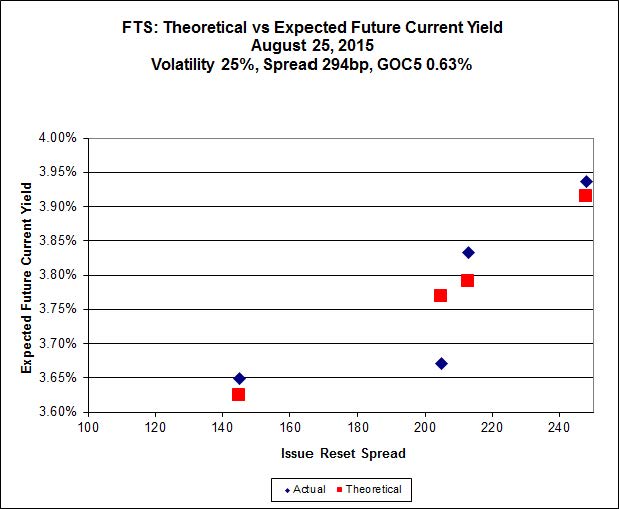
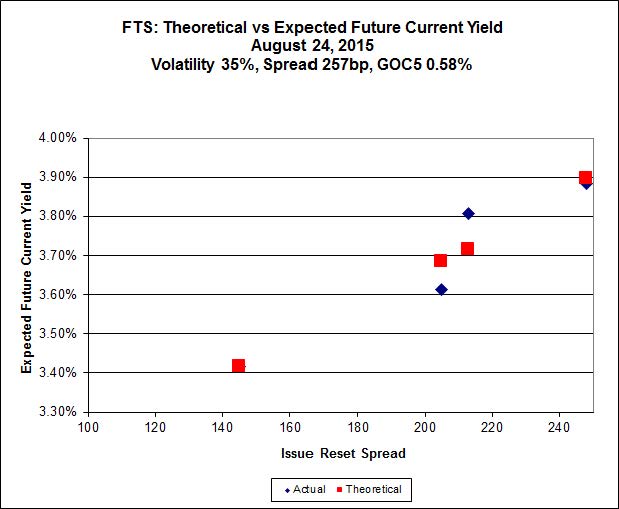
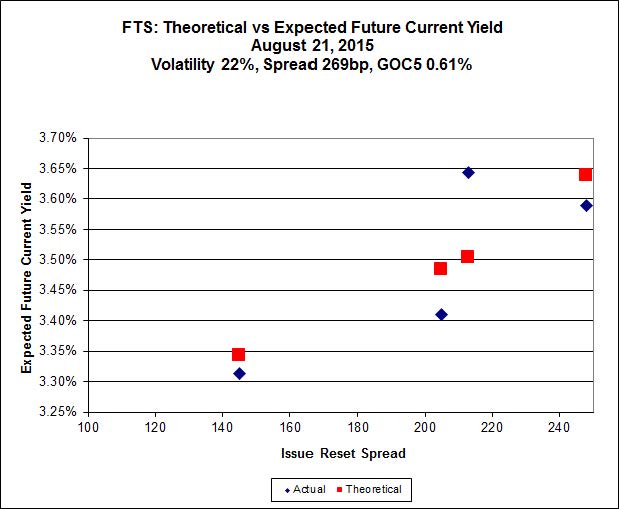
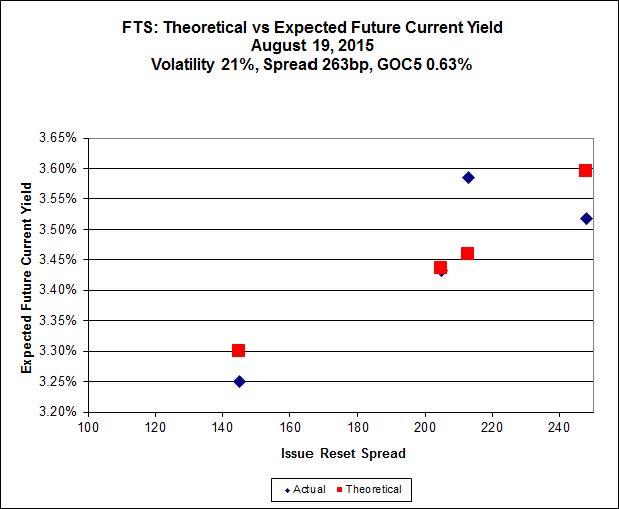
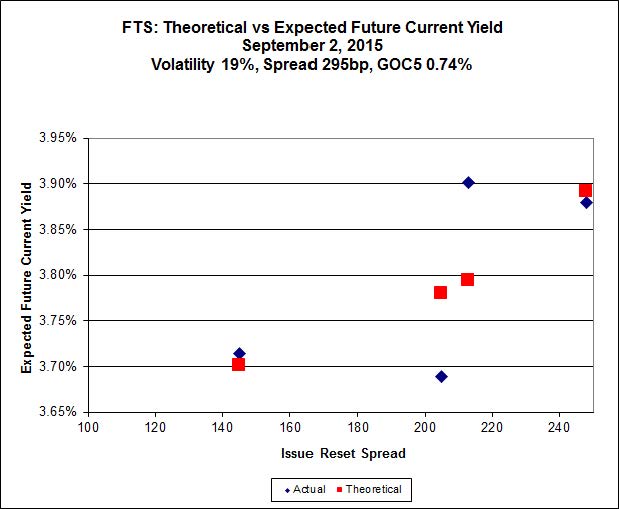
Implied Volatility eased a little today, but there are perils in relying too heavily on a four-point curve.
FTS.PR.K, with a spread of +205bp, and bid at 18.91, looks $0.46 expensive and resets 2019-3-1. FTS.PR.G, with a spread of +213bp and resetting 2018-9-1, is bid at 18.39 and is $0.52 cheap.
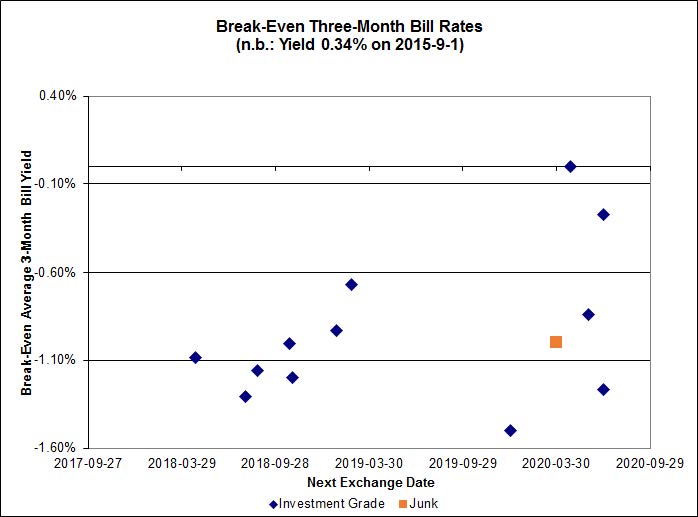
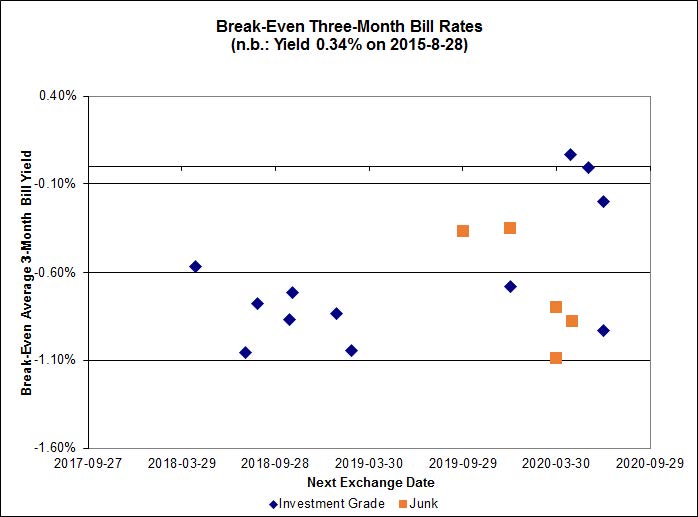
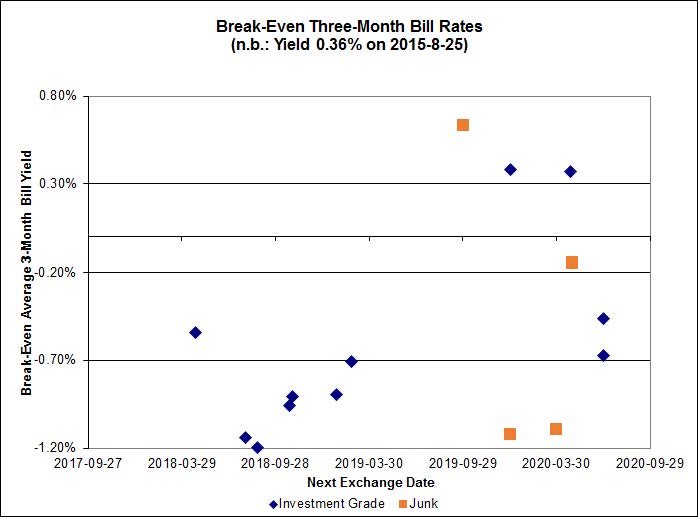
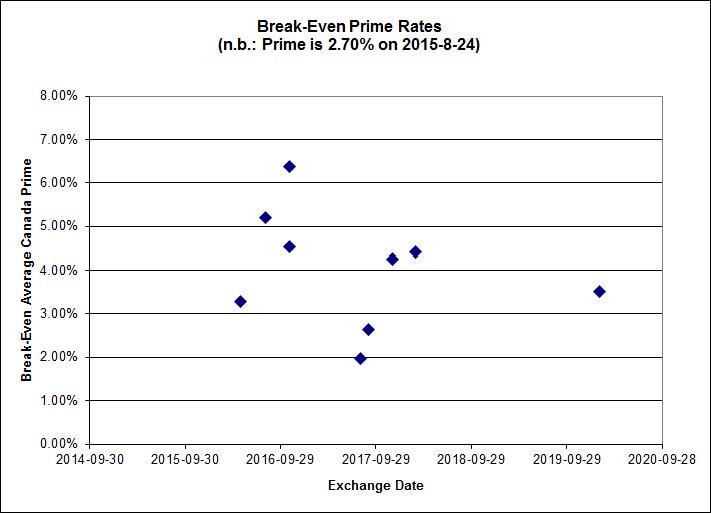
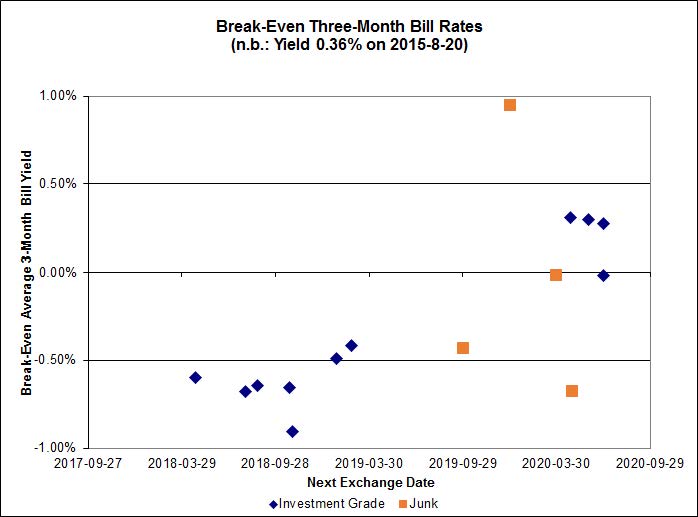
Click for Big
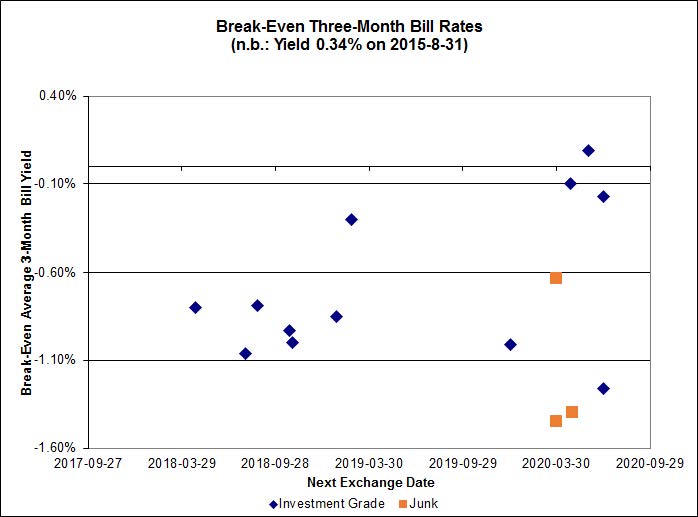
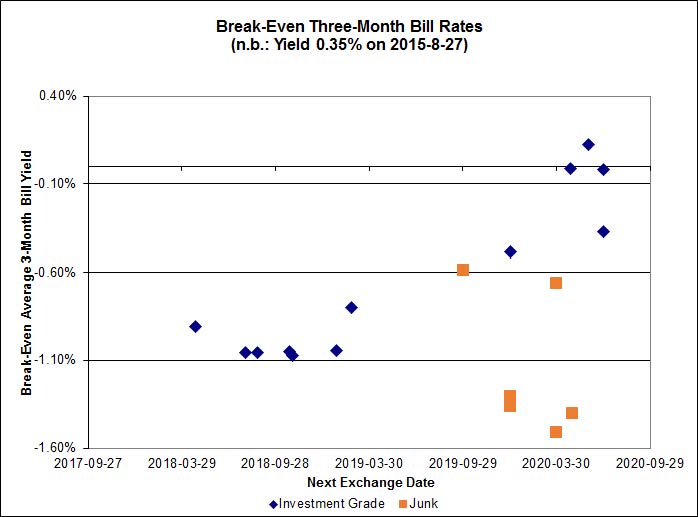
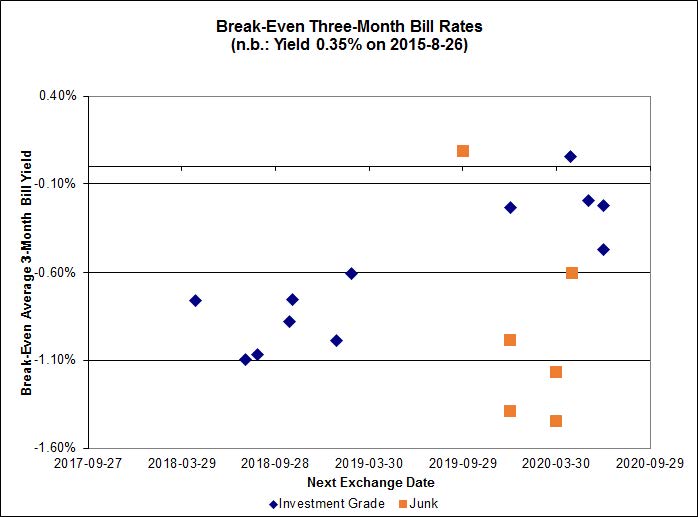
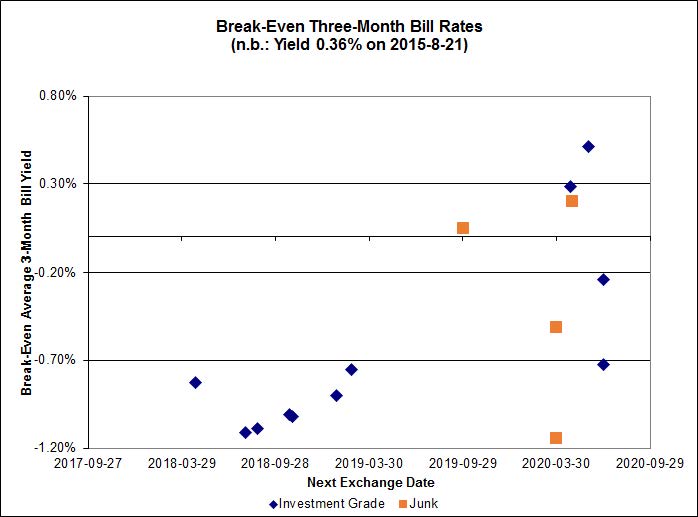
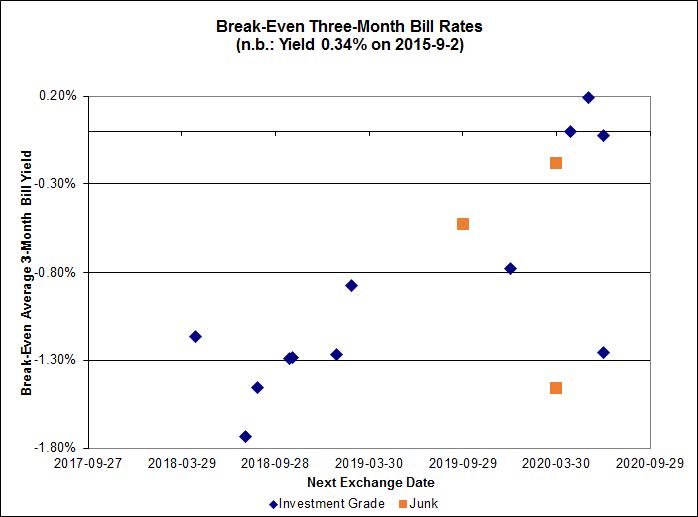
Investment-grade pairs predict an average three-month bill yield over the next five-odd years of -0.91%, with no outliers although I had to change the scale of the graph. Note that the distribution is bimodal, with NVCC non-compliant bank issues averaging -1.30% and the unregulated issues averaging -0.37%. There are two junk outliers below -1.80% and one above +0.20%.
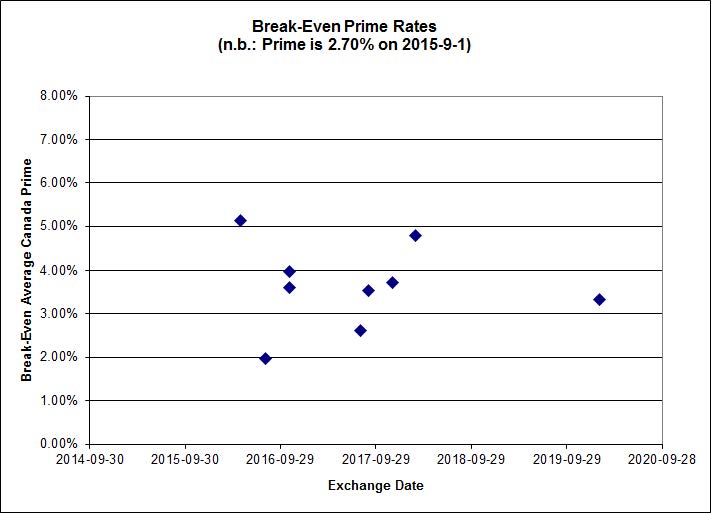
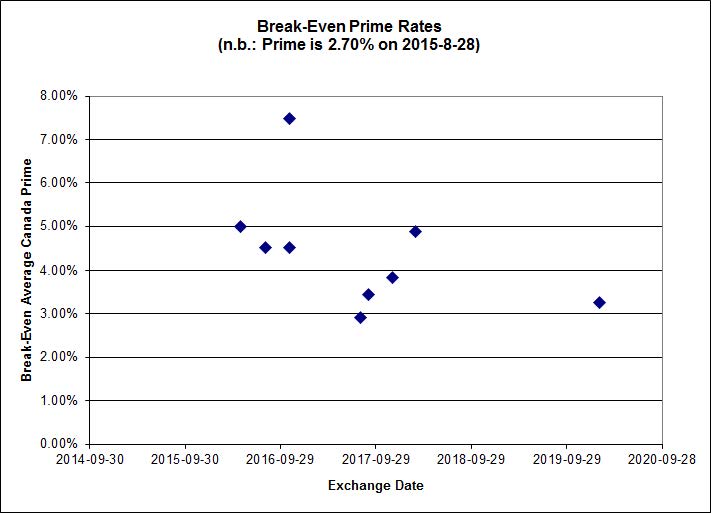
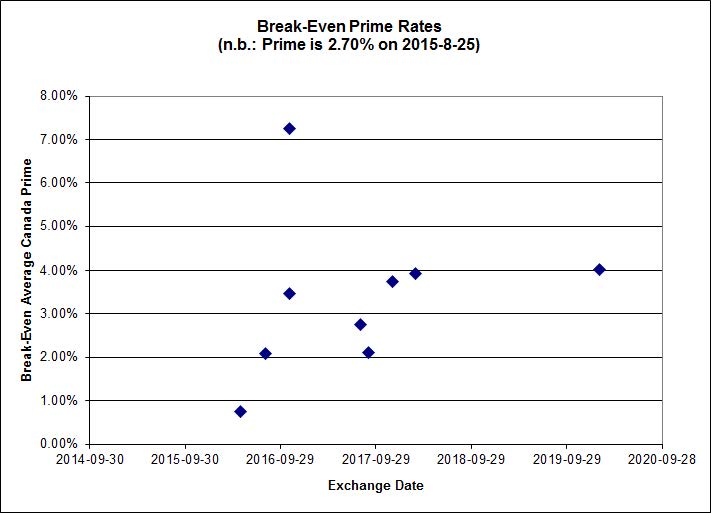
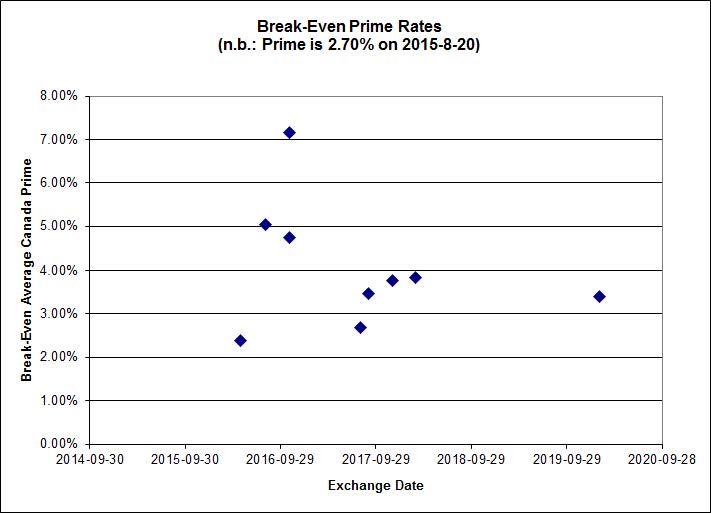
Click for Big
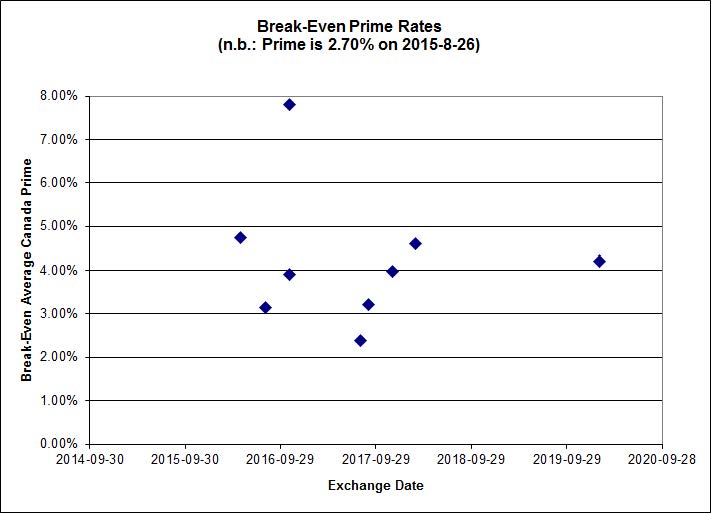
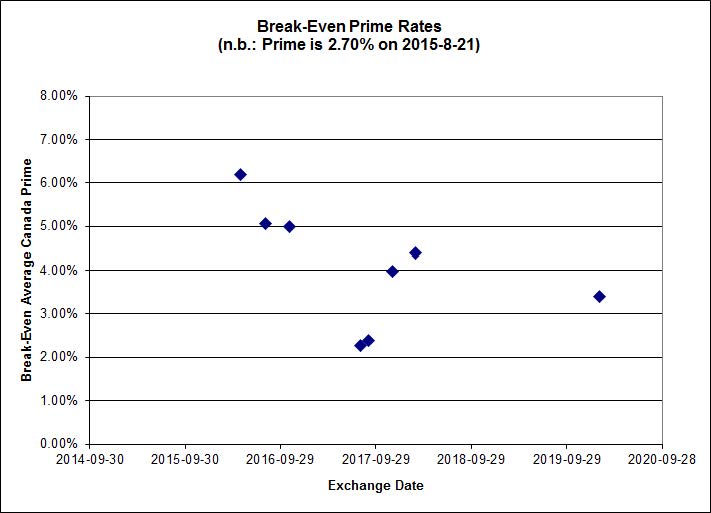
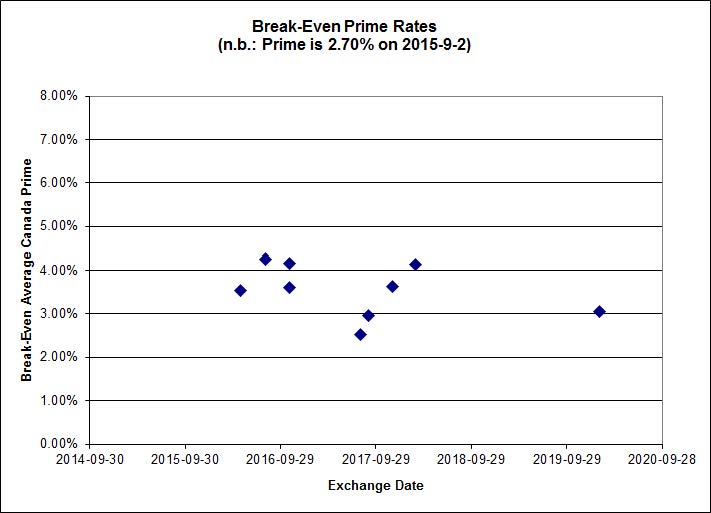
Shall we just say that this exhibits a high level of confidence in the continued rapacity of Canadian banks?
| HIMIPref™ Preferred Indices These values reflect the December 2008 revision of the HIMIPref™ Indices Values are provisional and are finalized monthly |
|||||||
| Index | Mean Current Yield (at bid) |
Median YTW |
Median Average Trading Value |
Median Mod Dur (YTW) |
Issues | Day’s Perf. | Index Value |
| Ratchet | 0.00 % | 0.00 % | 0 | 0.00 | 0 | 2.7502 % | 1,663.0 |
| FixedFloater | 0.00 % | 0.00 % | 0 | 0.00 | 0 | 2.7502 % | 2,907.8 |
| Floater | 4.41 % | 4.49 % | 56,917 | 16.36 | 3 | 2.7502 % | 1,767.9 |
| OpRet | 0.00 % | 0.00 % | 0 | 0.00 | 0 | 0.2311 % | 2,770.8 |
| SplitShare | 4.64 % | 4.95 % | 65,834 | 3.10 | 3 | 0.2311 % | 3,247.2 |
| Interest-Bearing | 0.00 % | 0.00 % | 0 | 0.00 | 0 | 0.2311 % | 2,533.6 |
| Perpetual-Premium | 5.73 % | 3.09 % | 58,849 | 0.08 | 8 | 0.1240 % | 2,488.7 |
| Perpetual-Discount | 5.47 % | 5.49 % | 76,420 | 14.65 | 30 | 0.4722 % | 2,585.8 |
| FixedReset | 4.75 % | 4.21 % | 178,396 | 16.07 | 74 | 0.3278 % | 2,140.4 |
| Deemed-Retractible | 5.16 % | 5.08 % | 100,744 | 5.54 | 33 | 0.0658 % | 2,572.4 |
| FloatingReset | 2.43 % | 3.83 % | 46,075 | 5.95 | 9 | -0.3451 % | 2,174.2 |
| Performance Highlights | |||
| Issue | Index | Change | Notes |
| MFC.PR.M | FixedReset | -2.16 % | YTW SCENARIO Maturity Type : Hard Maturity Maturity Date : 2025-01-31 Maturity Price : 25.00 Evaluated at bid price : 20.40 Bid-YTW : 6.10 % |
| GWO.PR.I | Deemed-Retractible | -1.70 % | YTW SCENARIO Maturity Type : Hard Maturity Maturity Date : 2025-01-31 Maturity Price : 25.00 Evaluated at bid price : 21.43 Bid-YTW : 6.54 % |
| HSE.PR.G | FixedReset | -1.55 % | YTW SCENARIO Maturity Type : Limit Maturity Maturity Date : 2045-09-02 Maturity Price : 21.85 Evaluated at bid price : 22.30 Bid-YTW : 4.84 % |
| TD.PR.T | FloatingReset | -1.41 % | YTW SCENARIO Maturity Type : Hard Maturity Maturity Date : 2022-01-31 Maturity Price : 25.00 Evaluated at bid price : 22.30 Bid-YTW : 3.83 % |
| MFC.PR.G | FixedReset | -1.41 % | YTW SCENARIO Maturity Type : Hard Maturity Maturity Date : 2025-01-31 Maturity Price : 25.00 Evaluated at bid price : 22.31 Bid-YTW : 5.20 % |
| SLF.PR.I | FixedReset | -1.39 % | YTW SCENARIO Maturity Type : Hard Maturity Maturity Date : 2025-01-31 Maturity Price : 25.00 Evaluated at bid price : 21.35 Bid-YTW : 5.60 % |
| BMO.PR.W | FixedReset | -1.35 % | YTW SCENARIO Maturity Type : Limit Maturity Maturity Date : 2045-09-02 Maturity Price : 20.50 Evaluated at bid price : 20.50 Bid-YTW : 3.84 % |
| FTS.PR.H | FixedReset | -1.21 % | YTW SCENARIO Maturity Type : Limit Maturity Maturity Date : 2045-09-02 Maturity Price : 14.74 Evaluated at bid price : 14.74 Bid-YTW : 3.84 % |
| BNS.PR.C | FloatingReset | -1.18 % | YTW SCENARIO Maturity Type : Hard Maturity Maturity Date : 2022-01-31 Maturity Price : 25.00 Evaluated at bid price : 22.61 Bid-YTW : 3.89 % |
| NA.PR.W | FixedReset | -1.12 % | YTW SCENARIO Maturity Type : Limit Maturity Maturity Date : 2045-09-02 Maturity Price : 20.27 Evaluated at bid price : 20.27 Bid-YTW : 3.96 % |
| RY.PR.H | FixedReset | -1.11 % | YTW SCENARIO Maturity Type : Limit Maturity Maturity Date : 2045-09-02 Maturity Price : 21.36 Evaluated at bid price : 21.36 Bid-YTW : 3.73 % |
| BNS.PR.B | FloatingReset | -1.05 % | YTW SCENARIO Maturity Type : Hard Maturity Maturity Date : 2022-01-31 Maturity Price : 25.00 Evaluated at bid price : 22.56 Bid-YTW : 3.73 % |
| IAG.PR.G | FixedReset | 1.02 % | YTW SCENARIO Maturity Type : Hard Maturity Maturity Date : 2025-01-31 Maturity Price : 25.00 Evaluated at bid price : 23.84 Bid-YTW : 4.31 % |
| SLF.PR.H | FixedReset | 1.05 % | YTW SCENARIO Maturity Type : Hard Maturity Maturity Date : 2025-01-31 Maturity Price : 25.00 Evaluated at bid price : 19.20 Bid-YTW : 6.31 % |
| BAM.PF.C | Perpetual-Discount | 1.16 % | YTW SCENARIO Maturity Type : Limit Maturity Maturity Date : 2045-09-02 Maturity Price : 20.95 Evaluated at bid price : 20.95 Bid-YTW : 5.90 % |
| TD.PF.D | FixedReset | 1.16 % | YTW SCENARIO Maturity Type : Limit Maturity Maturity Date : 2045-09-02 Maturity Price : 22.57 Evaluated at bid price : 23.54 Bid-YTW : 3.72 % |
| CU.PR.E | Perpetual-Discount | 1.27 % | YTW SCENARIO Maturity Type : Limit Maturity Maturity Date : 2045-09-02 Maturity Price : 22.07 Evaluated at bid price : 22.38 Bid-YTW : 5.49 % |
| CU.PR.D | Perpetual-Discount | 1.27 % | YTW SCENARIO Maturity Type : Limit Maturity Maturity Date : 2045-09-02 Maturity Price : 22.07 Evaluated at bid price : 22.38 Bid-YTW : 5.49 % |
| FTS.PR.J | Perpetual-Discount | 1.37 % | YTW SCENARIO Maturity Type : Limit Maturity Maturity Date : 2045-09-02 Maturity Price : 21.78 Evaluated at bid price : 22.12 Bid-YTW : 5.38 % |
| ENB.PR.A | Perpetual-Discount | 1.45 % | YTW SCENARIO Maturity Type : Limit Maturity Maturity Date : 2045-09-02 Maturity Price : 24.16 Evaluated at bid price : 24.41 Bid-YTW : 5.66 % |
| FTS.PR.G | FixedReset | 1.49 % | YTW SCENARIO Maturity Type : Limit Maturity Maturity Date : 2045-09-02 Maturity Price : 18.39 Evaluated at bid price : 18.39 Bid-YTW : 4.12 % |
| BAM.PR.C | Floater | 1.54 % | YTW SCENARIO Maturity Type : Limit Maturity Maturity Date : 2045-09-02 Maturity Price : 10.57 Evaluated at bid price : 10.57 Bid-YTW : 4.53 % |
| TRP.PR.D | FixedReset | 1.55 % | YTW SCENARIO Maturity Type : Limit Maturity Maturity Date : 2045-09-02 Maturity Price : 18.97 Evaluated at bid price : 18.97 Bid-YTW : 4.37 % |
| MFC.PR.I | FixedReset | 1.56 % | YTW SCENARIO Maturity Type : Hard Maturity Maturity Date : 2025-01-31 Maturity Price : 25.00 Evaluated at bid price : 22.72 Bid-YTW : 5.01 % |
| HSE.PR.C | FixedReset | 1.71 % | YTW SCENARIO Maturity Type : Limit Maturity Maturity Date : 2045-09-02 Maturity Price : 20.80 Evaluated at bid price : 20.80 Bid-YTW : 4.83 % |
| BMO.PR.Q | FixedReset | 1.71 % | YTW SCENARIO Maturity Type : Hard Maturity Maturity Date : 2022-01-31 Maturity Price : 25.00 Evaluated at bid price : 21.37 Bid-YTW : 4.88 % |
| TRP.PR.E | FixedReset | 1.80 % | YTW SCENARIO Maturity Type : Limit Maturity Maturity Date : 2045-09-02 Maturity Price : 19.75 Evaluated at bid price : 19.75 Bid-YTW : 4.27 % |
| BAM.PF.D | Perpetual-Discount | 1.88 % | YTW SCENARIO Maturity Type : Limit Maturity Maturity Date : 2045-09-02 Maturity Price : 21.17 Evaluated at bid price : 21.17 Bid-YTW : 5.90 % |
| MFC.PR.H | FixedReset | 2.16 % | YTW SCENARIO Maturity Type : Hard Maturity Maturity Date : 2025-01-31 Maturity Price : 25.00 Evaluated at bid price : 23.60 Bid-YTW : 4.73 % |
| RY.PR.M | FixedReset | 2.24 % | YTW SCENARIO Maturity Type : Limit Maturity Maturity Date : 2045-09-02 Maturity Price : 22.18 Evaluated at bid price : 22.85 Bid-YTW : 3.70 % |
| BAM.PR.R | FixedReset | 2.30 % | YTW SCENARIO Maturity Type : Limit Maturity Maturity Date : 2045-09-02 Maturity Price : 16.89 Evaluated at bid price : 16.89 Bid-YTW : 4.73 % |
| FTS.PR.K | FixedReset | 2.49 % | YTW SCENARIO Maturity Type : Limit Maturity Maturity Date : 2045-09-02 Maturity Price : 18.91 Evaluated at bid price : 18.91 Bid-YTW : 3.98 % |
| CU.PR.F | Perpetual-Discount | 2.94 % | YTW SCENARIO Maturity Type : Limit Maturity Maturity Date : 2045-09-02 Maturity Price : 21.00 Evaluated at bid price : 21.00 Bid-YTW : 5.39 % |
| BAM.PR.K | Floater | 2.99 % | YTW SCENARIO Maturity Type : Limit Maturity Maturity Date : 2045-09-02 Maturity Price : 10.67 Evaluated at bid price : 10.67 Bid-YTW : 4.49 % |
| MFC.PR.J | FixedReset | 3.33 % | YTW SCENARIO Maturity Type : Hard Maturity Maturity Date : 2025-01-31 Maturity Price : 25.00 Evaluated at bid price : 21.70 Bid-YTW : 5.34 % |
| BAM.PR.B | Floater | 3.71 % | YTW SCENARIO Maturity Type : Limit Maturity Maturity Date : 2045-09-02 Maturity Price : 10.89 Evaluated at bid price : 10.89 Bid-YTW : 4.40 % |
| TRP.PR.F | FloatingReset | 4.22 % | YTW SCENARIO Maturity Type : Limit Maturity Maturity Date : 2045-09-02 Maturity Price : 14.57 Evaluated at bid price : 14.57 Bid-YTW : 3.87 % |
| GWO.PR.N | FixedReset | 4.39 % | YTW SCENARIO Maturity Type : Hard Maturity Maturity Date : 2025-01-31 Maturity Price : 25.00 Evaluated at bid price : 15.45 Bid-YTW : 7.93 % |
| BIP.PR.A | FixedReset | 5.35 % | YTW SCENARIO Maturity Type : Limit Maturity Maturity Date : 2045-09-02 Maturity Price : 22.08 Evaluated at bid price : 22.65 Bid-YTW : 4.76 % |
| Volume Highlights | |||
| Issue | Index | Shares Traded |
Notes |
| BMO.PR.S | FixedReset | 85,388 | Desjardins crossed 80,000 at 22.15. YTW SCENARIO Maturity Type : Limit Maturity Maturity Date : 2045-09-02 Maturity Price : 21.63 Evaluated at bid price : 21.90 Bid-YTW : 3.68 % |
| MFC.PR.L | FixedReset | 75,700 | Nesbitt crossed 75,000 at 19.85. YTW SCENARIO Maturity Type : Hard Maturity Maturity Date : 2025-01-31 Maturity Price : 25.00 Evaluated at bid price : 19.47 Bid-YTW : 6.54 % |
| MFC.PR.M | FixedReset | 66,200 | Nesbitt crossed 60,000 at 20.85. YTW SCENARIO Maturity Type : Hard Maturity Maturity Date : 2025-01-31 Maturity Price : 25.00 Evaluated at bid price : 20.40 Bid-YTW : 6.10 % |
| RY.PR.L | FixedReset | 61,200 | Desjardins crossed 60,000 at 25.65. YTW SCENARIO Maturity Type : Hard Maturity Maturity Date : 2022-01-31 Maturity Price : 25.00 Evaluated at bid price : 25.59 Bid-YTW : 3.50 % |
| BNS.PR.R | FixedReset | 58,200 | TD crossed 45,400 at 25.05. YTW SCENARIO Maturity Type : Hard Maturity Maturity Date : 2022-01-31 Maturity Price : 25.00 Evaluated at bid price : 25.03 Bid-YTW : 3.34 % |
| NA.PR.M | Deemed-Retractible | 57,404 | Called for redemption. YTW SCENARIO Maturity Type : Call Maturity Date : 2015-10-02 Maturity Price : 25.50 Evaluated at bid price : 25.79 Bid-YTW : -4.34 % |
| There were 29 other index-included issues trading in excess of 10,000 shares. | |||
| Wide Spread Highlights | ||
| Issue | Index | Quote Data and Yield Notes |
| MFC.PR.L | FixedReset | Quote: 19.47 – 21.30 Spot Rate : 1.8300 Average : 1.1618 YTW SCENARIO |
| MFC.PR.J | FixedReset | Quote: 21.70 – 22.67 Spot Rate : 0.9700 Average : 0.5706 YTW SCENARIO |
| RY.PR.M | FixedReset | Quote: 22.85 – 24.00 Spot Rate : 1.1500 Average : 0.8801 YTW SCENARIO |
| BMO.PR.W | FixedReset | Quote: 20.50 – 21.04 Spot Rate : 0.5400 Average : 0.3800 YTW SCENARIO |
| GWO.PR.I | Deemed-Retractible | Quote: 21.43 – 21.89 Spot Rate : 0.4600 Average : 0.3156 YTW SCENARIO |
| PWF.PR.O | Perpetual-Premium | Quote: 25.43 – 25.84 Spot Rate : 0.4100 Average : 0.2765 YTW SCENARIO |