Knock me down with a feather! A regulatory organization has done something useful:
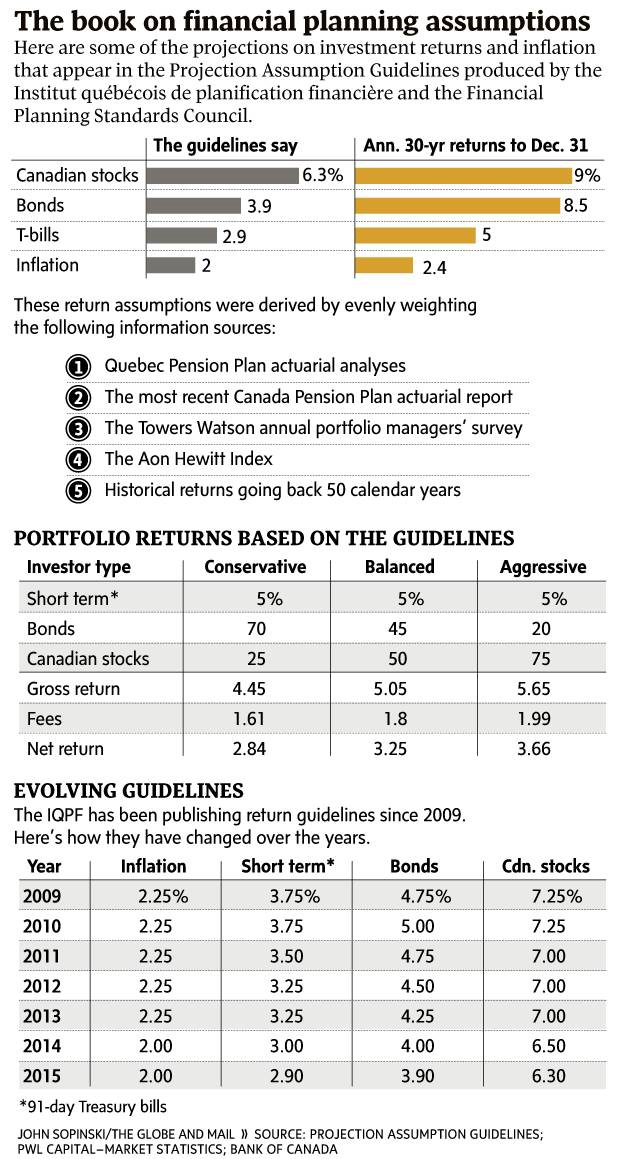
Some of the country’s top financial minds think you should expect to make 6.3-per-cent a year in Canadian stocks over the long term and 3.9 per cent in bonds.
You’ll find these numbers in a new document created by a pair of financial planning organizations as a reference for planners and advisers. The investment industry works hard to maintain an aura of expertise in matters such as estimating returns, but the truth is that this process can be subject to personal biases and agendas. For example, an adviser might try to wow a new client by insisting big returns are possible.
The new Projection Assumption Guidelines (download the document here) aim to standardize and professionalize the planning process by providing the latest and best thinking on returns, inflation, interest rates and life expectancy.
“Canadians benefit from objective assumptions, and they also benefit from a standardization of assumptions across the industry – firms and planners,” said Joan Yudelson, vice-president of professional practice at the Financial Planning Standards Council, which produced the guidelines in collaboration with the Institut québécois de planification financière. Both the IQPF and the FPSC set standards for financial planners – the IQPF in Quebec, and the FPSC by overseeing the certified financial planner (CFP) designation. The IQPF has been producing the guidelines since 2009 and recently joined forces with the FPSC.
According to the actual report:
These Guidelines were set by combining assumptions from the following sources (each weighted at 20%):
- assumption used in the most recent QPP actuarial analysis, weighted as follows: 50% of the medium-term assumption (2013 to 2022) and 50% of the long-term assumption (2023 and later)
- assumption used in the most recent CPP actuarial report (2019 and later)
- result of the Towers Watson annual portfolio managers’ survey, weighted as follows:1/15 of the short-term projection, 4/15 of the medium-term projection and 10/15 of the long-term projection
- general assumption of the Aon Hewitt (formerly Aon Consulting) index
- historic returns on these asset classes over the 50 years ending the previous December 31 (adjusted for inflation according to what follows).
I don’t see the point of including historic returns to estimate future returns of bonds, but the projection of 3.9% may be achieved with a portfolio of long corporates, so I’m not going to complain too loudly.
The Globe also published a table taken from the report of the historical figures:
Click for Legible
I don’t understand why PNGs look so terrible in WordPress
There was carnage on the Canadian preferred share market today, with PerpetualDiscounts down 43bp, FixedResets off 30bp and DeemedRetractibles losing 52bp. DeemedRetractibles of the insurance persuasion got hammered, ENB FixedResets were prominent losers, while the only winners on the lengthy performance highlights table were FixedResets. Volume was low.
For as long as the FixedReset market is so violently unsettled, I’ll keep publishing updates of the more interesting and meaningful series of FixedResets’ Implied Volatilities. This doesn’t include Enbridge because although Enbridge has a large number of issues outstanding, all of which are quite liquid, the range of Issue Reset Spreads is too small for decent conclusions. The low is 212bp (ENB.PR.H; second-lowest is ENB.PR.D at 237bp) and the high is a mere 268 for ENB.PF.G.
Remember that all rich /cheap assessments are:
» based on Implied Volatility Theory only
» are relative only to other FixedResets from the same issuer
» assume constant GOC-5 yield
» assume constant Implied Volatility
» assume constant spread
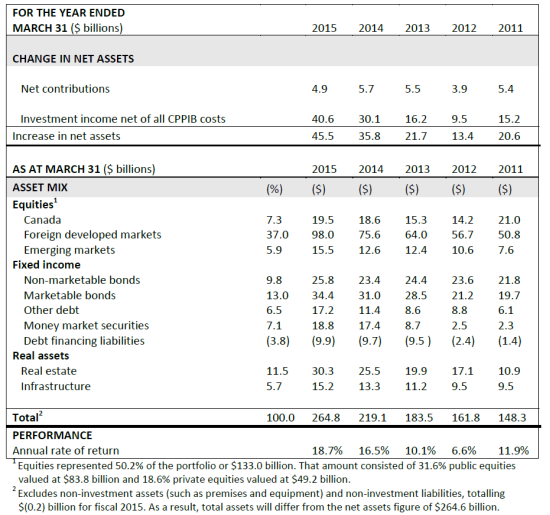
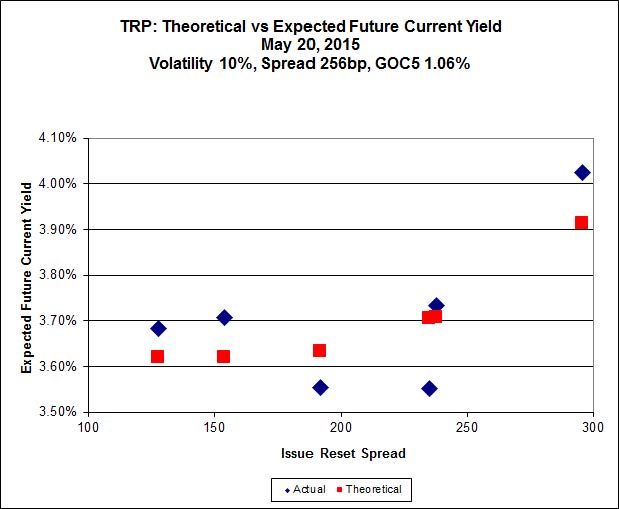
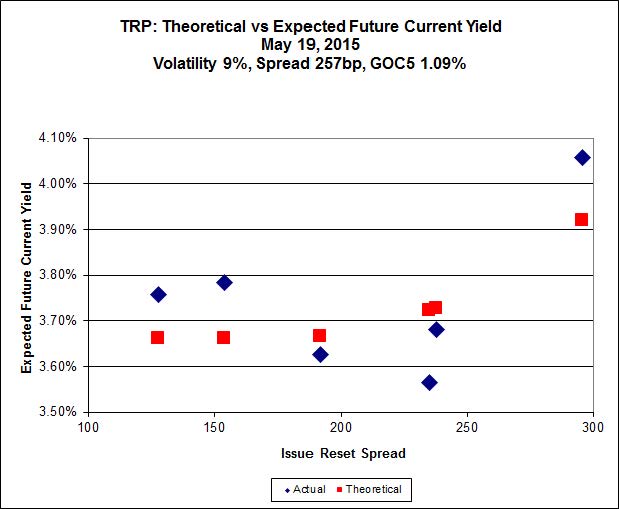
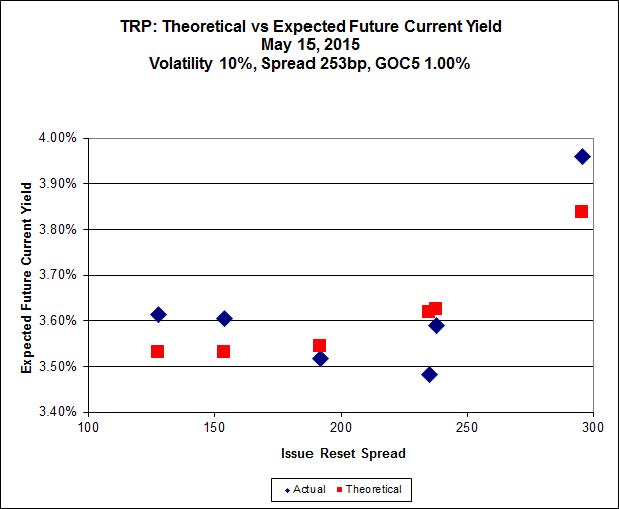
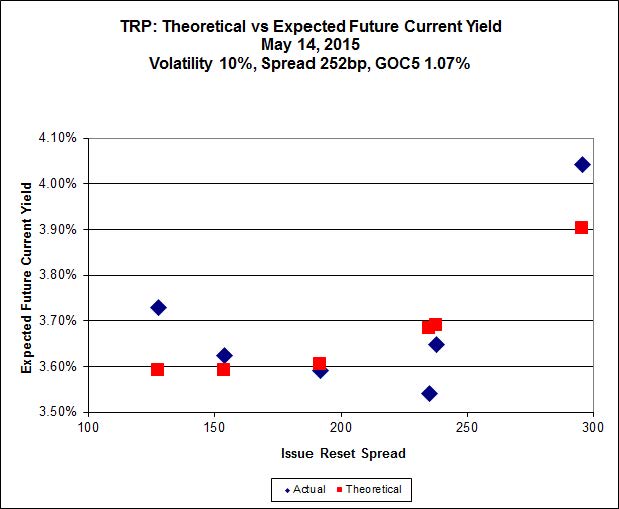
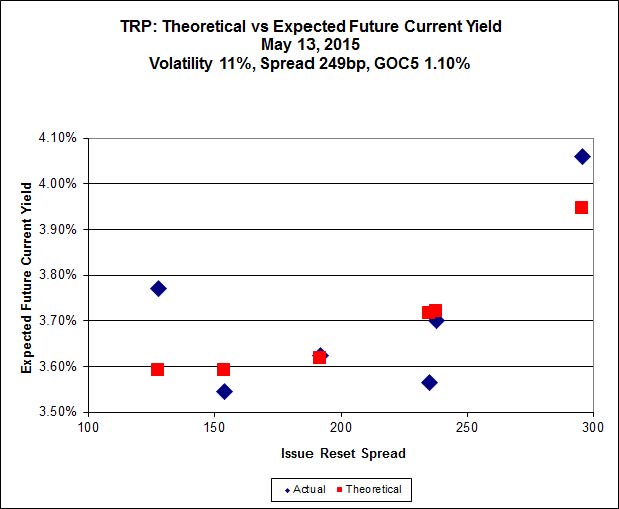
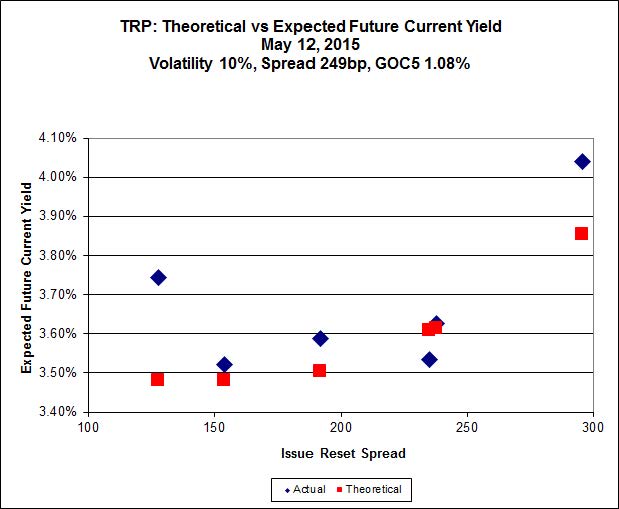
Here’s TRP:

Click for Big
TRP.PR.E, which resets 2019-10-30 at +235, is bid at 23.90 to be $0.84 rich, while TRP.PR.G, resetting 2020-11-30 at +296, is $0.85 cheap at its bid price of 24.88.
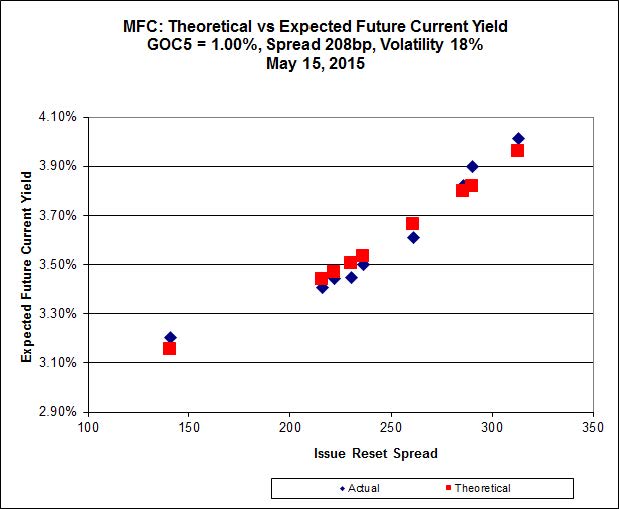
Click for Big
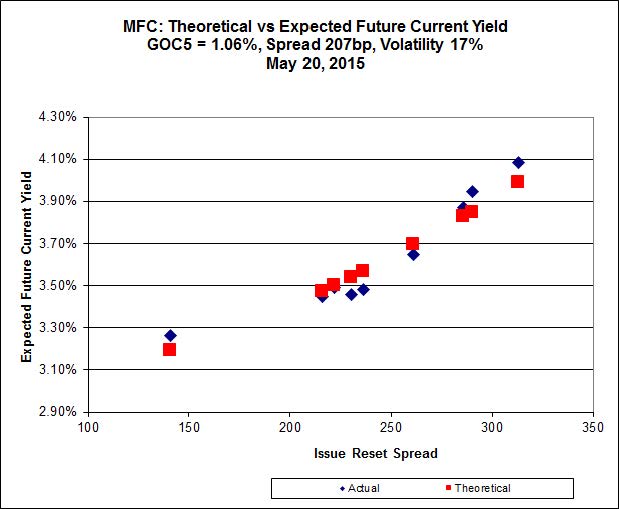
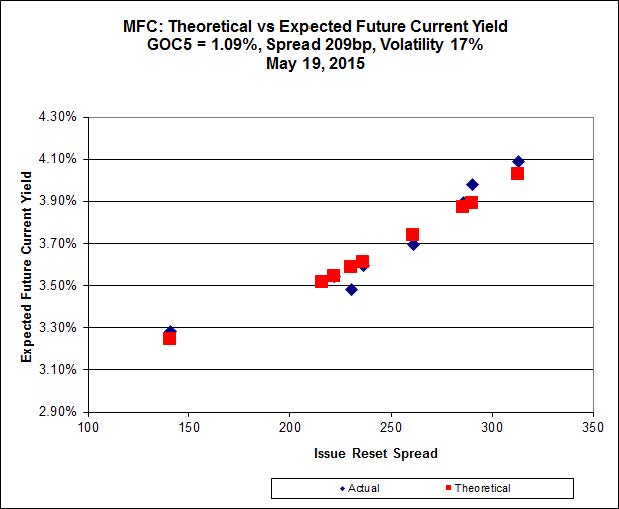
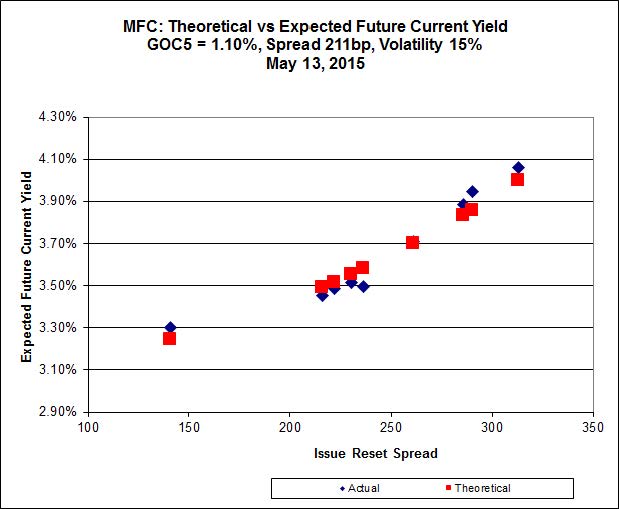
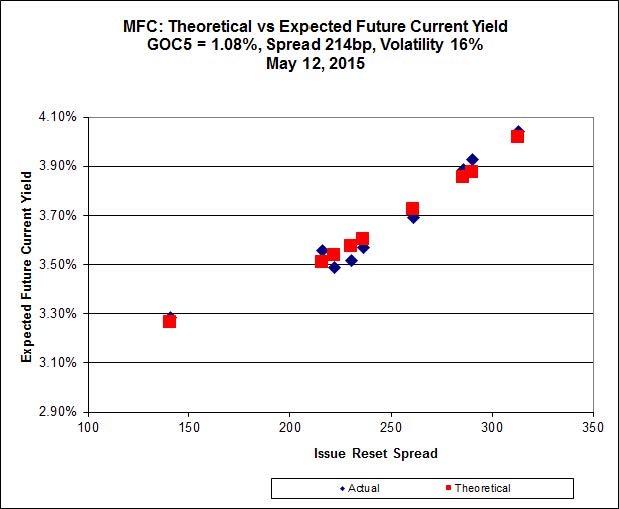
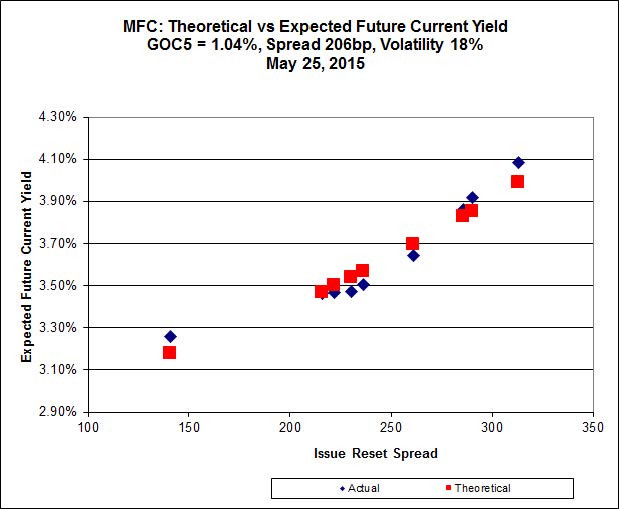
Another excellent fit, but the numbers are perplexing. Implied Volatility for MFC continues to be a conundrum. It is still too high if we consider that NVCC rules will never apply to these issues; it is still too low if we consider them to be NVCC non-compliant issues (and therefore with Deemed Maturities in the call schedule).
Most expensive is MFC.PR.N, resetting at +230 on 2020-3-19, bid at 24.04 to be $0.44 rich, while MFC.PR.H, resetting at +313bp on 2017-3-19, is bid at 25.52 to be $0.62 cheap.

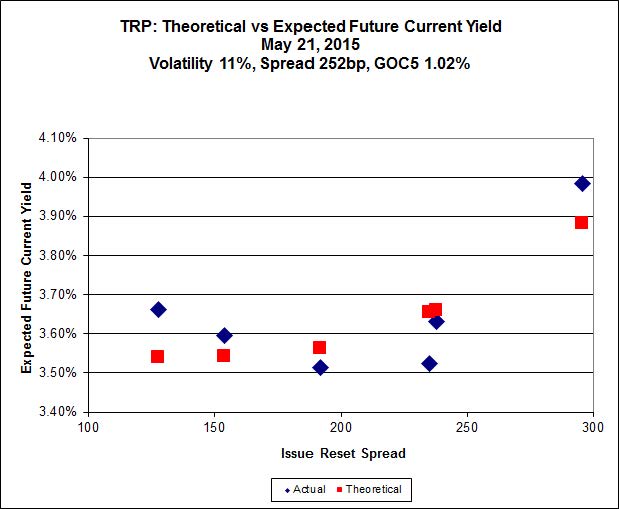
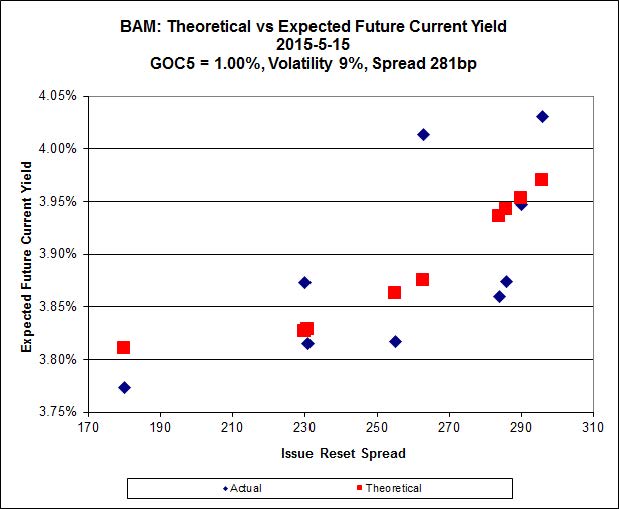
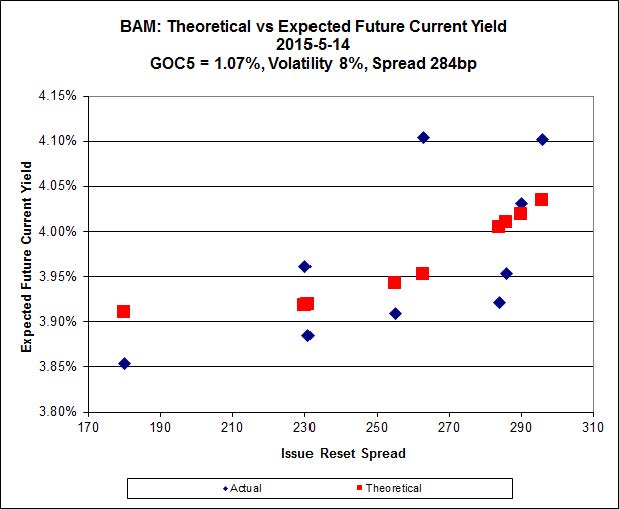
Click for Big
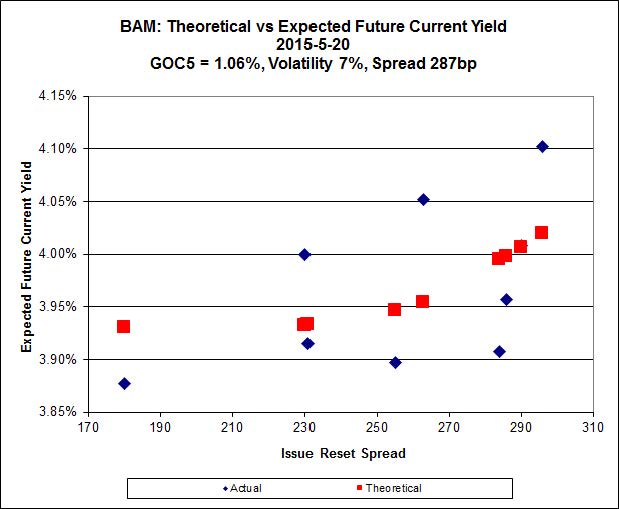
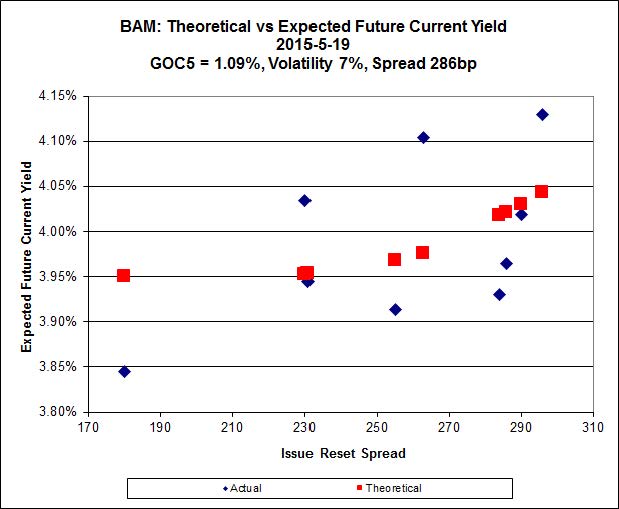
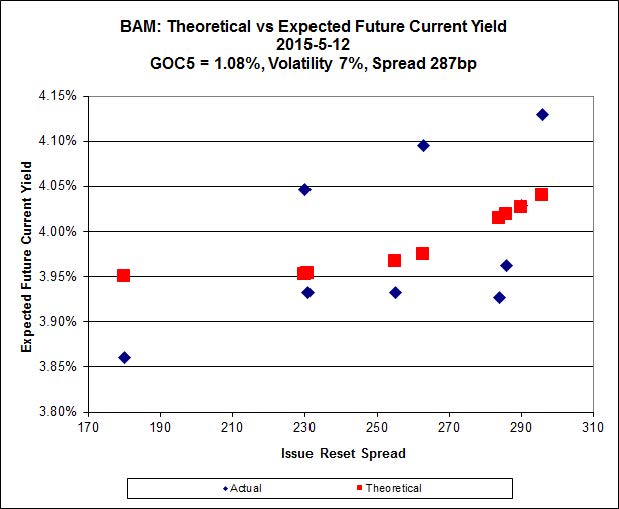
The cheapest issue relative to its peers is BAM.PF.B, resetting at +263bp on 2019-3-31, bid at 22.75 to be $0.53 cheap. BAM.PF.G, resetting at +284bp 2020-6-30 is bid at 24.94 and appears to be $0.51 rich.
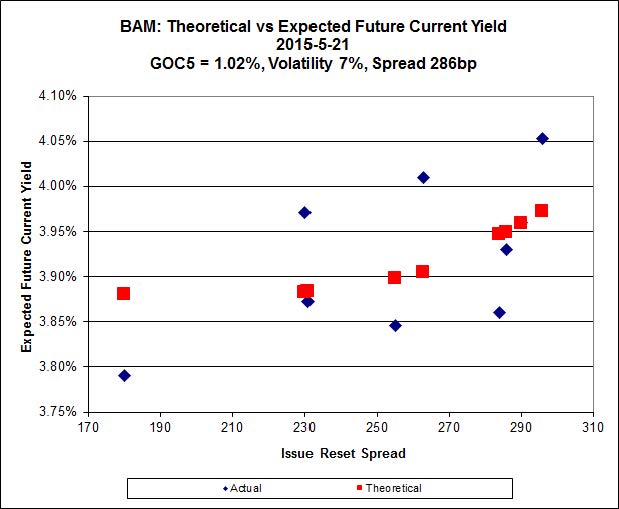
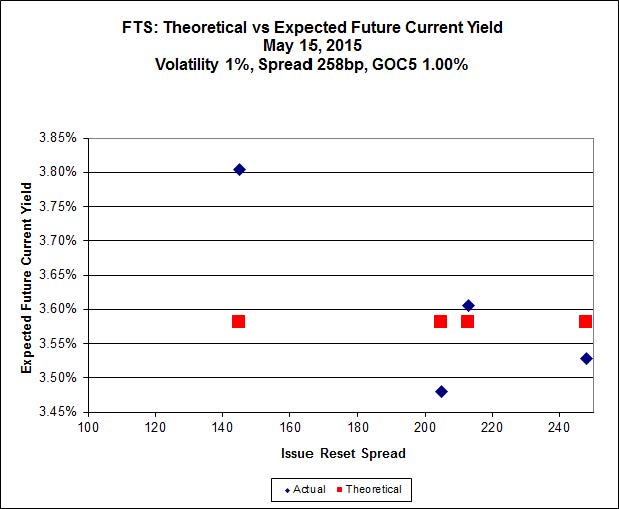
Click for Big
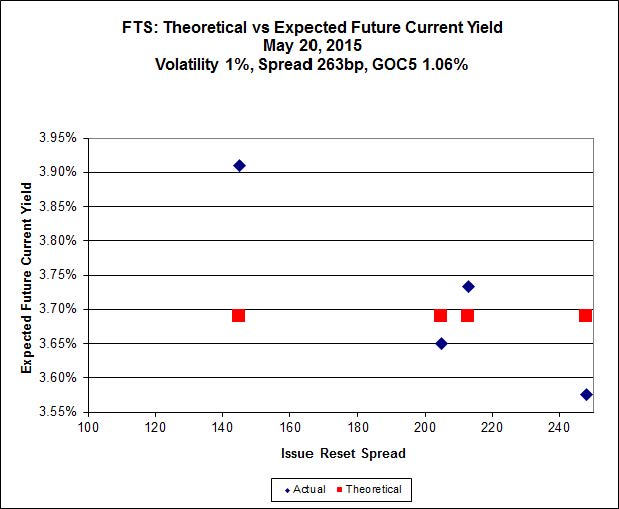
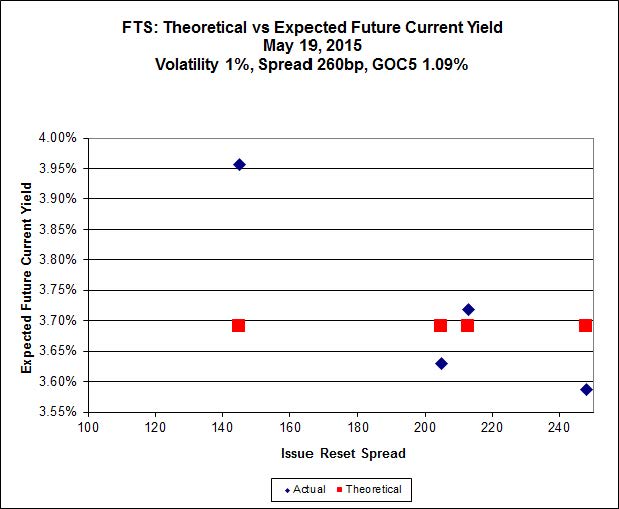
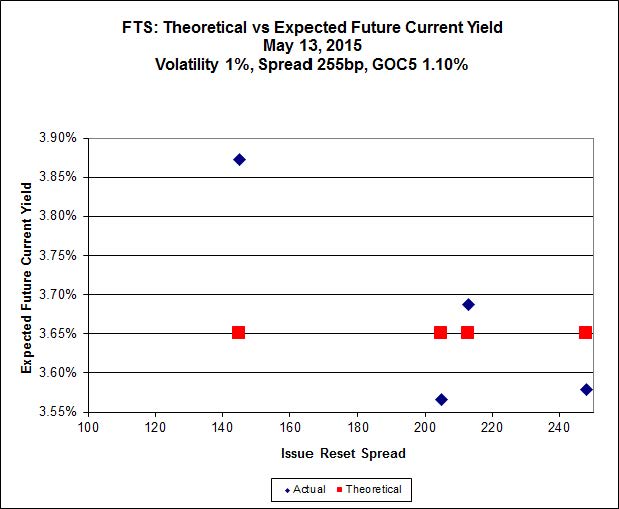
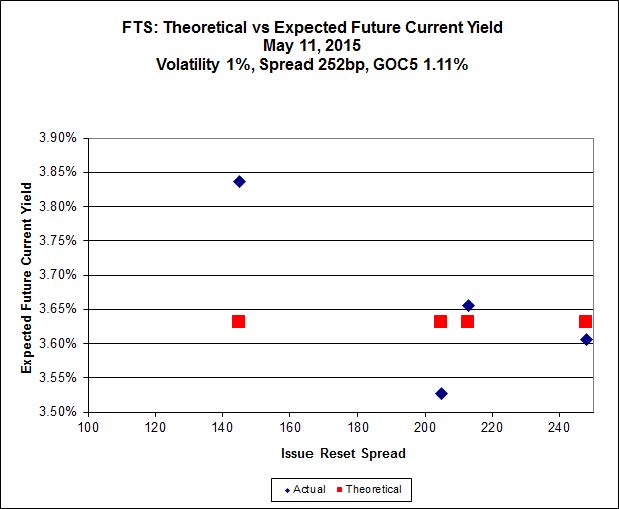
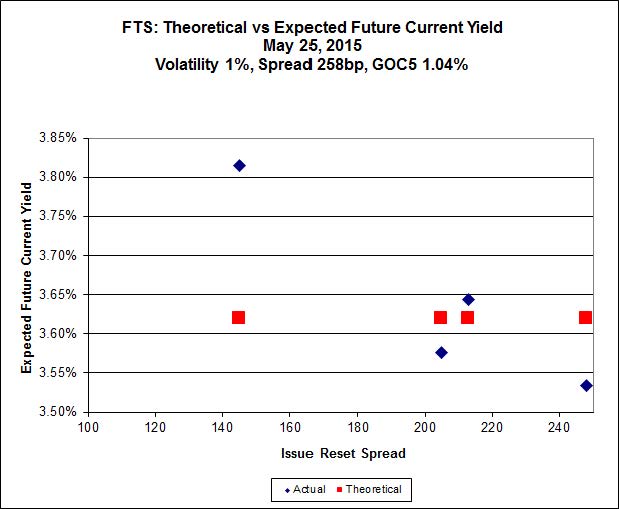
FTS.PR.H, with a spread of +145bp, and bid at 16.32, looks $0.88 cheap and resets 2015-6-1. FTS.PR.M, with a spread of +248bp and resetting 2019-12-1, is bid at 24.90 and is $0.59 rich.

Click for Big
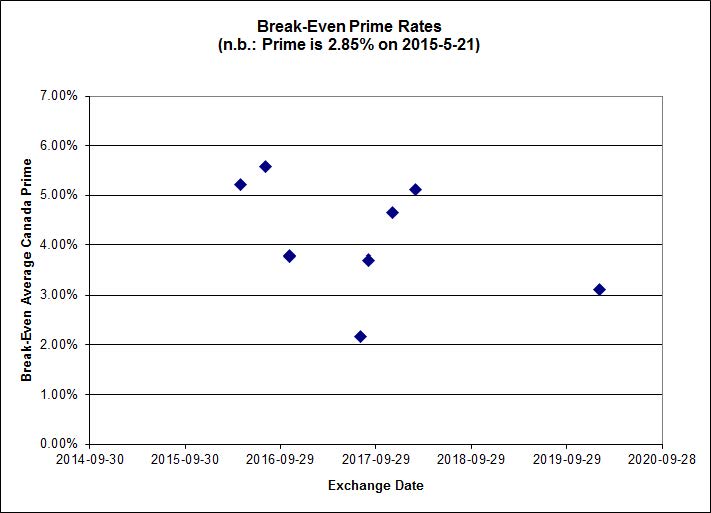
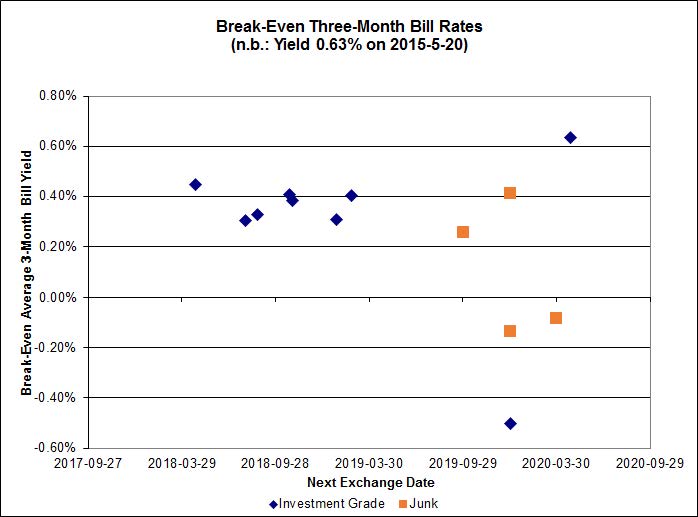
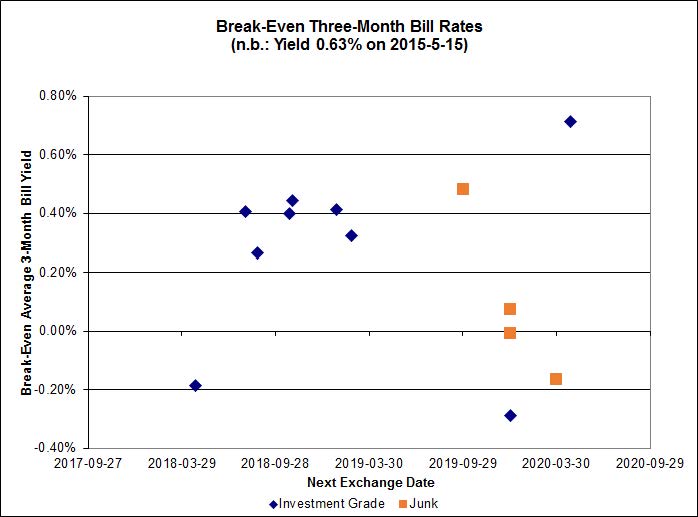
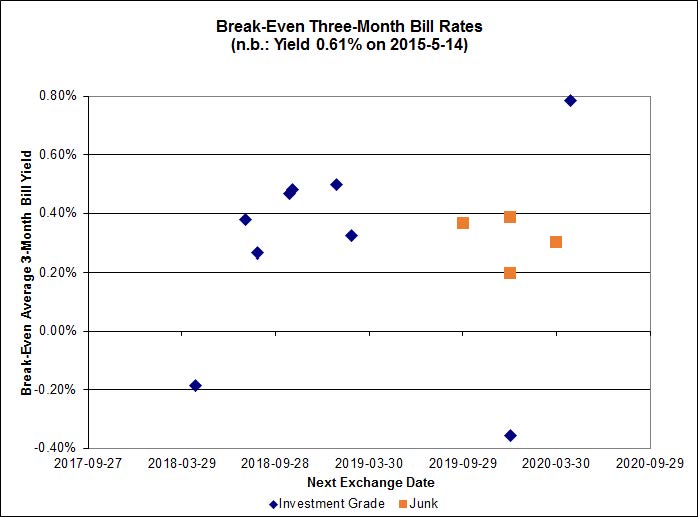
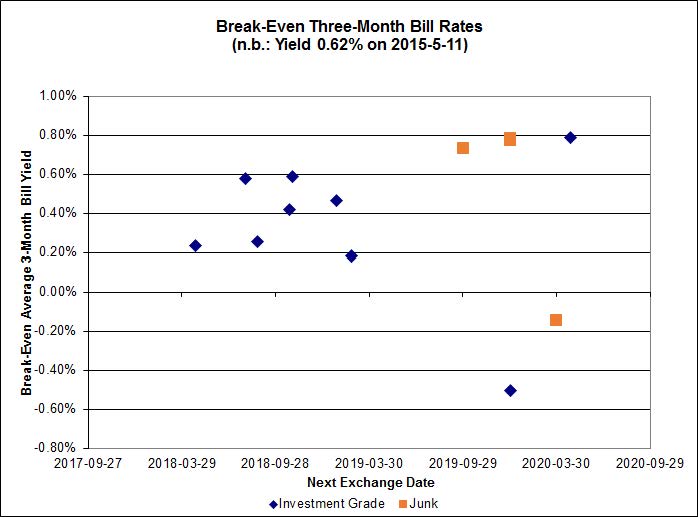
Investment-grade pairs predict an average over the next five-odd years of about 0.35%, including the TRP.PR.A / TRP.PR.F at -0.50%. On the junk side, the FFH.PR.E / FFH.PR.F pair is at -1.14%.
Click for Big
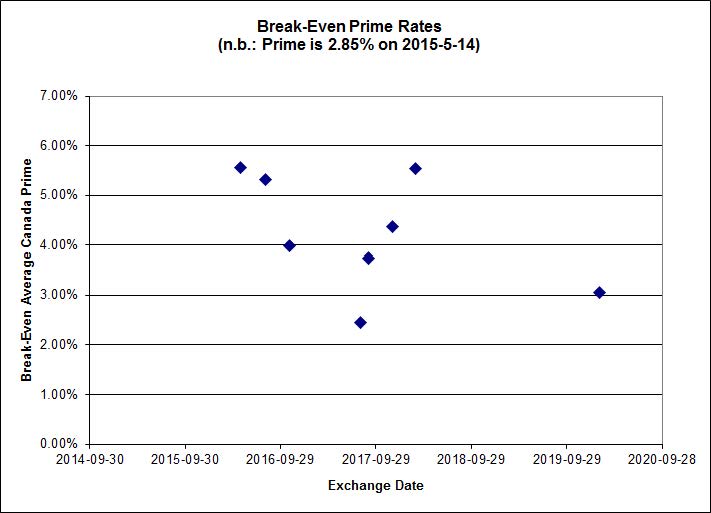
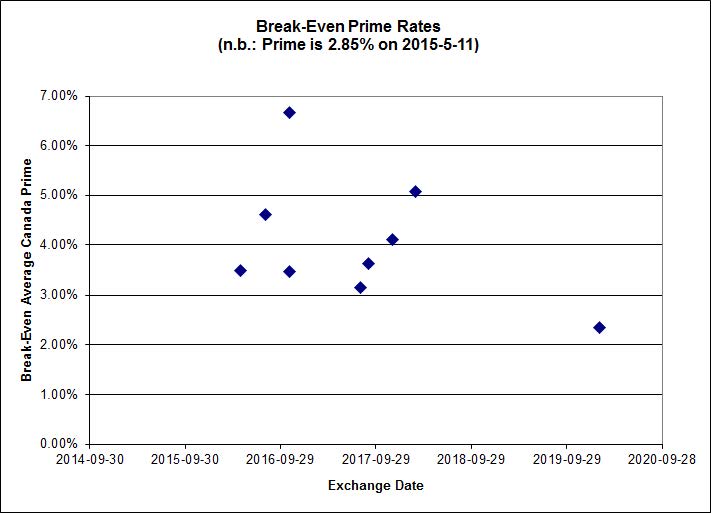
Shall we just say that this exhibits a high level of confidence in the continued rapacity of Canadian banks?
| HIMIPref™ Preferred Indices These values reflect the December 2008 revision of the HIMIPref™ Indices Values are provisional and are finalized monthly |
|||||||
| Index | Mean Current Yield (at bid) |
Median YTW |
Median Average Trading Value |
Median Mod Dur (YTW) |
Issues | Day’s Perf. | Index Value |
| Ratchet | 0.00 % | 0.00 % | 0 | 0.00 | 0 | -0.2065 % | 2,285.8 |
| FixedFloater | 0.00 % | 0.00 % | 0 | 0.00 | 0 | -0.2065 % | 3,996.6 |
| Floater | 3.18 % | 3.36 % | 53,225 | 18.81 | 4 | -0.2065 % | 2,430.0 |
| OpRet | 4.45 % | -9.80 % | 32,099 | 0.10 | 2 | 0.0198 % | 2,779.7 |
| SplitShare | 4.60 % | 4.83 % | 62,950 | 3.35 | 3 | 0.1209 % | 3,244.1 |
| Interest-Bearing | 0.00 % | 0.00 % | 0 | 0.00 | 0 | 0.0198 % | 2,541.7 |
| Perpetual-Premium | 5.47 % | 2.92 % | 62,866 | 0.43 | 18 | -0.0808 % | 2,515.7 |
| Perpetual-Discount | 5.08 % | 5.06 % | 118,470 | 15.35 | 15 | -0.4274 % | 2,770.5 |
| FixedReset | 4.43 % | 3.77 % | 271,409 | 16.03 | 86 | -0.3002 % | 2,406.0 |
| Deemed-Retractible | 4.97 % | 3.52 % | 107,451 | 0.82 | 35 | -0.5184 % | 2,621.6 |
| FloatingReset | 2.55 % | 2.92 % | 57,019 | 6.15 | 7 | 0.1763 % | 2,339.4 |
| Performance Highlights | |||
| Issue | Index | Change | Notes |
| IAG.PR.A | Deemed-Retractible | -3.01 % | YTW SCENARIO Maturity Type : Hard Maturity Maturity Date : 2025-01-31 Maturity Price : 25.00 Evaluated at bid price : 23.18 Bid-YTW : 5.71 % |
| CIU.PR.C | FixedReset | -2.91 % | YTW SCENARIO Maturity Type : Limit Maturity Maturity Date : 2045-05-25 Maturity Price : 16.35 Evaluated at bid price : 16.35 Bid-YTW : 3.79 % |
| SLF.PR.B | Deemed-Retractible | -2.30 % | YTW SCENARIO Maturity Type : Hard Maturity Maturity Date : 2025-01-31 Maturity Price : 25.00 Evaluated at bid price : 23.53 Bid-YTW : 5.56 % |
| MFC.PR.B | Deemed-Retractible | -2.14 % | YTW SCENARIO Maturity Type : Hard Maturity Maturity Date : 2025-01-31 Maturity Price : 25.00 Evaluated at bid price : 22.90 Bid-YTW : 5.78 % |
| SLF.PR.E | Deemed-Retractible | -2.11 % | YTW SCENARIO Maturity Type : Hard Maturity Maturity Date : 2025-01-31 Maturity Price : 25.00 Evaluated at bid price : 22.35 Bid-YTW : 5.93 % |
| SLF.PR.C | Deemed-Retractible | -2.10 % | YTW SCENARIO Maturity Type : Hard Maturity Maturity Date : 2025-01-31 Maturity Price : 25.00 Evaluated at bid price : 22.17 Bid-YTW : 5.98 % |
| MFC.PR.C | Deemed-Retractible | -1.72 % | YTW SCENARIO Maturity Type : Hard Maturity Maturity Date : 2025-01-31 Maturity Price : 25.00 Evaluated at bid price : 22.90 Bid-YTW : 5.63 % |
| TRP.PR.C | FixedReset | -1.70 % | YTW SCENARIO Maturity Type : Limit Maturity Maturity Date : 2045-05-25 Maturity Price : 17.31 Evaluated at bid price : 17.31 Bid-YTW : 3.85 % |
| MFC.PR.L | FixedReset | -1.70 % | YTW SCENARIO Maturity Type : Hard Maturity Maturity Date : 2025-01-31 Maturity Price : 25.00 Evaluated at bid price : 23.10 Bid-YTW : 4.48 % |
| VNR.PR.A | FixedReset | -1.69 % | YTW SCENARIO Maturity Type : Limit Maturity Maturity Date : 2045-05-25 Maturity Price : 23.00 Evaluated at bid price : 23.84 Bid-YTW : 4.10 % |
| SLF.PR.D | Deemed-Retractible | -1.67 % | YTW SCENARIO Maturity Type : Hard Maturity Maturity Date : 2025-01-31 Maturity Price : 25.00 Evaluated at bid price : 22.24 Bid-YTW : 5.94 % |
| CU.PR.G | Perpetual-Discount | -1.57 % | YTW SCENARIO Maturity Type : Limit Maturity Maturity Date : 2045-05-25 Maturity Price : 22.29 Evaluated at bid price : 22.64 Bid-YTW : 4.97 % |
| ENB.PR.J | FixedReset | -1.53 % | YTW SCENARIO Maturity Type : Limit Maturity Maturity Date : 2045-05-25 Maturity Price : 20.63 Evaluated at bid price : 20.63 Bid-YTW : 4.60 % |
| BAM.PF.C | Perpetual-Discount | -1.43 % | YTW SCENARIO Maturity Type : Limit Maturity Maturity Date : 2045-05-25 Maturity Price : 22.30 Evaluated at bid price : 22.67 Bid-YTW : 5.42 % |
| ENB.PR.F | FixedReset | -1.38 % | YTW SCENARIO Maturity Type : Limit Maturity Maturity Date : 2045-05-25 Maturity Price : 19.23 Evaluated at bid price : 19.23 Bid-YTW : 4.74 % |
| GWO.PR.I | Deemed-Retractible | -1.34 % | YTW SCENARIO Maturity Type : Hard Maturity Maturity Date : 2025-01-31 Maturity Price : 25.00 Evaluated at bid price : 23.50 Bid-YTW : 5.42 % |
| SLF.PR.A | Deemed-Retractible | -1.30 % | YTW SCENARIO Maturity Type : Hard Maturity Maturity Date : 2025-01-31 Maturity Price : 25.00 Evaluated at bid price : 23.40 Bid-YTW : 5.58 % |
| PWF.PR.S | Perpetual-Discount | -1.25 % | YTW SCENARIO Maturity Type : Limit Maturity Maturity Date : 2045-05-25 Maturity Price : 24.09 Evaluated at bid price : 24.50 Bid-YTW : 4.92 % |
| ENB.PF.A | FixedReset | -1.22 % | YTW SCENARIO Maturity Type : Limit Maturity Maturity Date : 2045-05-25 Maturity Price : 21.05 Evaluated at bid price : 21.05 Bid-YTW : 4.62 % |
| ENB.PR.B | FixedReset | -1.20 % | YTW SCENARIO Maturity Type : Limit Maturity Maturity Date : 2045-05-25 Maturity Price : 18.86 Evaluated at bid price : 18.86 Bid-YTW : 4.67 % |
| ENB.PF.C | FixedReset | -1.17 % | YTW SCENARIO Maturity Type : Limit Maturity Maturity Date : 2045-05-25 Maturity Price : 21.05 Evaluated at bid price : 21.05 Bid-YTW : 4.62 % |
| ENB.PF.G | FixedReset | -1.16 % | YTW SCENARIO Maturity Type : Limit Maturity Maturity Date : 2045-05-25 Maturity Price : 21.35 Evaluated at bid price : 21.35 Bid-YTW : 4.61 % |
| BAM.PR.N | Perpetual-Discount | -1.11 % | YTW SCENARIO Maturity Type : Limit Maturity Maturity Date : 2045-05-25 Maturity Price : 21.94 Evaluated at bid price : 22.32 Bid-YTW : 5.39 % |
| MFC.PR.F | FixedReset | -1.10 % | YTW SCENARIO Maturity Type : Hard Maturity Maturity Date : 2025-01-31 Maturity Price : 25.00 Evaluated at bid price : 18.80 Bid-YTW : 6.07 % |
| MFC.PR.N | FixedReset | -1.07 % | YTW SCENARIO Maturity Type : Hard Maturity Maturity Date : 2025-01-31 Maturity Price : 25.00 Evaluated at bid price : 24.04 Bid-YTW : 4.06 % |
| PWF.PR.P | FixedReset | -1.06 % | YTW SCENARIO Maturity Type : Limit Maturity Maturity Date : 2045-05-25 Maturity Price : 18.70 Evaluated at bid price : 18.70 Bid-YTW : 3.67 % |
| RY.PR.M | FixedReset | 1.04 % | YTW SCENARIO Maturity Type : Limit Maturity Maturity Date : 2045-05-25 Maturity Price : 22.85 Evaluated at bid price : 24.25 Bid-YTW : 3.72 % |
| MFC.PR.M | FixedReset | 1.17 % | YTW SCENARIO Maturity Type : Hard Maturity Maturity Date : 2025-01-31 Maturity Price : 25.00 Evaluated at bid price : 24.25 Bid-YTW : 4.02 % |
| SLF.PR.G | FixedReset | 1.40 % | YTW SCENARIO Maturity Type : Hard Maturity Maturity Date : 2025-01-31 Maturity Price : 25.00 Evaluated at bid price : 17.98 Bid-YTW : 6.39 % |
| FTS.PR.H | FixedReset | 1.56 % | YTW SCENARIO Maturity Type : Limit Maturity Maturity Date : 2045-05-25 Maturity Price : 16.32 Evaluated at bid price : 16.32 Bid-YTW : 3.85 % |
| Volume Highlights | |||
| Issue | Index | Shares Traded |
Notes |
| ENB.PR.D | FixedReset | 453,161 | Scotia crossed blocks of 245,000 and 194,100 at 18.70. Nice tickets! YTW SCENARIO Maturity Type : Limit Maturity Maturity Date : 2045-05-25 Maturity Price : 18.78 Evaluated at bid price : 18.78 Bid-YTW : 4.69 % |
| TRP.PR.C | FixedReset | 285,118 | Nesbitt crossed 275,900 at 17.43. There’s another nice ticket! YTW SCENARIO Maturity Type : Limit Maturity Maturity Date : 2045-05-25 Maturity Price : 17.31 Evaluated at bid price : 17.31 Bid-YTW : 3.85 % |
| ENB.PR.T | FixedReset | 92,041 | RBC crossed 25,000 at 19.35. Scotia crossed 50,000 at the same price. YTW SCENARIO Maturity Type : Limit Maturity Maturity Date : 2045-05-25 Maturity Price : 19.33 Evaluated at bid price : 19.33 Bid-YTW : 4.74 % |
| ENB.PR.P | FixedReset | 64,834 | Desjardins crossed 50,000 at 19.45. YTW SCENARIO Maturity Type : Limit Maturity Maturity Date : 2045-05-25 Maturity Price : 19.30 Evaluated at bid price : 19.30 Bid-YTW : 4.74 % |
| TRP.PR.G | FixedReset | 63,103 | Nesbitt crossed 60,000 at 24.94. YTW SCENARIO Maturity Type : Limit Maturity Maturity Date : 2045-05-25 Maturity Price : 23.09 Evaluated at bid price : 24.88 Bid-YTW : 3.86 % |
| TD.PF.E | FixedReset | 41,400 | TD crossed 35,000 at 25.05. YTW SCENARIO Maturity Type : Call Maturity Date : 2020-10-31 Maturity Price : 25.00 Evaluated at bid price : 25.06 Bid-YTW : 3.73 % |
| There were 23 other index-included issues trading in excess of 10,000 shares. | |||
| Wide Spread Highlights | ||
| Issue | Index | Quote Data and Yield Notes |
| IAG.PR.A | Deemed-Retractible | Quote: 23.18 – 23.98 Spot Rate : 0.8000 Average : 0.4983 YTW SCENARIO |
| CIU.PR.C | FixedReset | Quote: 16.35 – 17.16 Spot Rate : 0.8100 Average : 0.6043 YTW SCENARIO |
| SLF.PR.B | Deemed-Retractible | Quote: 23.53 – 23.98 Spot Rate : 0.4500 Average : 0.2720 YTW SCENARIO |
| VNR.PR.A | FixedReset | Quote: 23.84 – 24.38 Spot Rate : 0.5400 Average : 0.3747 YTW SCENARIO |
| MFC.PR.B | Deemed-Retractible | Quote: 22.90 – 23.39 Spot Rate : 0.4900 Average : 0.3419 YTW SCENARIO |
| CU.PR.G | Perpetual-Discount | Quote: 22.64 – 23.00 Spot Rate : 0.3600 Average : 0.2274 YTW SCENARIO |