Assiduous Reader DW brings to my attention a piece titled BXF no longer a strip tease, which points out:
When First Asset created Canada’s first strip bond ETF in 2013, they claimed that the ETF was expected to be more tax-efficient than other short term bond products currently available in the marketplace.
With a full tax year behind us, and armed with a new methodology for calculating the after-tax returns of ETFs, we can put First Asset’s claim to the test. Spoiler alert: the results are not only impressive, but they make you wonder why other firms haven’t followed suit by offering their own brand of strip bond ETFs.
…
The results above should not be considered a fluke – as long as the other bond ETFs continue to have an average coupon that is significantly higher than their yield-to-maturity, BXF will be expected to outperform these plain-vanilla ETFs on an after-tax basis (for more information on this concept, please read Why Use a Strip Bond ETF? by Dan Bortolotti).
This has previously been an issue in the preferred share world – see the article Beware the tax trap of these tempting preferreds and the post Tax Impact on FixedResetPremium Yields. Remember the good old days, when FixedResets traded at a premium?
Strips are generally too expensive to hold in any account, let alone a taxable one, but the fact that they are treated as par bonds as of the purchase date is a very useful wrinkle. Regrettably, most strips are governments and to a large extent the tax savings will be offset by the liquidity premium – which retail shouldn’t pay for, because the ability to transact $50-million in one ‘phone call without moving the market isn’t exactly an attribute that should be of much interest to retail.
I have advised many clients in the past to open accounts at full-service brokers with the sole objective of gaining access to current coupon corporate new issues. This has worked out OK for them – the biggest problem is putting the fear of God into the broker so he never calls unless he’s got a new issue that meets pre-defined standards!
US brokers are attempting to whip up some fear-inspired trading in bonds:
While the Federal Reserve considers raising overnight borrowing costs from about zero, where they’ve been since 2008, central banks in Europe are dropping deposit rates into negative territory.
This backdrop has pushed a measure of expected Treasury price swings to levels that are about 40 percent higher this year than in the same period in 2014, according to Bank of America Merrill Lynch’s Option Volatility Estimate MOVE index.
“The risk in bonds has gone up,” Francesco Garzarelli, London-based co-head of macro and markets research at Goldman Sachs Group Inc., said in a Bloomberg Television interview Thursday. “The sensitivity to small changes in yield expectations from here will command very sizable price swings, and I just think that makes fixed income a very dangerous asset class.”
…
While the biggest banks have cut back on their positions in risky, speculative-grade debt, it’s steadily migrated to large institutions, insurance companies and mutual funds. Such firms have boosted their holdings of corporate and foreign bonds to $5.1 trillion, a 65 percent increase since the end of 2008, according to data compiled by UBS.This has more than offset the $800 billion decline in holdings at banks and securities firms in the period, a regulator-prompted retrenchment that was intended to reinforce the financial system, UBS analysts Matthew Mish and Stephen Caprio wrote in a Feb. 26 report.
What we’re left with instead — ballooning bond funds that own more and more risky debt — may be a less bad option, but one that still threatens to wreak havoc in credit markets.
Rob Carrick highlights a TD publication in his piece What if interest rates never return to ‘normal’?:
I’m on record as having warned many times about rising rates, but I’m now in adjustment mode. What has me reconsidering is the kind of thinking found in a new report by TD Economics titled The New Normal: Low Rates in Advanced Economies for the Long Run. It argues that rates are low today because of weak global economic growth, and that they will move higher as the economy improves. However, rates will not return to levels we used to consider “neutral.” The reason: Aging, and in some cases, shrinking populations across the industrial world. They’ll keep a lid on growth in economic productivity and thereby reduce the need to crank rates higher.
The TD report THE NEW NORMAL: LOW RATES IN ADVANCED ECONOMIES FOR THE LONG RUN forecasts modest rates for years to come:
- • Trend economic growth is likely to remain slower than it has been historically throughout advanced economies. The two key determinants, labor force and labor productivity growth, have been slowing nearly everywhere.
- • Record low interest rates in many advanced economies is a result of both cyclical and structural factors. However, even once they begin to normalize, lower potential GDP growth will keep the long-term equilibrium level of interest rates lower than in the past. By extension, bond yields are also slated to be lower across the maturity spectrum.
- • The equilibrium level of interest rates in the UK is set to be relatively similar to Canada’s and slightly below that of the US. In the euro area, the equilibrium level will be a notch below the UK’s, while it will be substantially lower in Japan.
- • In the near term, it is perfectly clear that interest rates are set to remain far lower than their expected neutral level. Nonetheless, for long-term investors, such as pension funds, investing over multiple business cycles, lower neutral rates will make for a particular challenge.
…
In a recent paper, TD Economics estimated the long-run neutral level of the federal funds rate to be 3.25%, relative to a 1992-2007 average of 4.10%, and the long-run neutral Bank of Canada overnight rate to be 3.00%, compared to an average of 4.20% over the same time frame. This decline reflects slower labor force growth and modest productivity growth. A central question is whether this is a global phenomenon? In this paper, we explore the long-run neutral level of interest rates for the UK, euro area and Japan. Our conclusion is that across the advanced world, the long-term equilibrium level of interest rates will be lower than in the past.
And the paper referenced in the quoted paragraph is DIVERGENT VIEWS ON NEUTRAL INTEREST RATES
- • With the Fed signaling an end to QE in October, financial markets are now debating both the timing of future rate hikes and, more importantly, the level to which interest rates will ultimately rise. The latter requires an understanding of the neutral level of interest rates.
- • Disagreement over how high rates will rise in the future seems to be embedded in different timeframes under discussion. The view of a ‘new neutral’ real fed funds rate of close to zero (2.00% in nominal terms) is usually grounded in a shorter timeframe that is not consistent with the long-run level of rates of an economy in equilibrium – growing at a trend pace with stable inflation.
- • TD Economics believes that the long-run neutral level of the fed funds rate is around 3.25% (1.25% real) and the neutral level of 10-year Treasury yields is close to 4.00% (2.00% real). However, the Fed is expected to reach those points slowly, over the course of more than three years, assuming the economic recovery remains on track. The result is that our real fed funds rate averages -0.5% from 2015 to 2017.
…
For some time, TD Economics has viewed the future long-run neutral level of rates as lower than the pre-recession experience. We forecast a neutral level of interest rates in a range of 3.00% to 3.50% (equal to 1.00%-1.50% real), and we use the middle of that range (3.25%) to anchor our long term interest rate projection.
Meanwhile, preferred share investors are contemplating inspirational public art:

Click for Big
It was a rough day for the Canadian preferred share markets, with PerpetualDiscounts down 18bp, FixedResets losing 40bp and DeemedRetractibles off 10bp. MFC issues of all types are notable on the bad side of a lengthy Performance Highlights table, while ENB issues made an appearance on the good side. Volume was high.
For as long as the FixedReset market is so violently unsettled, I’ll keep publishing updates of the more interesting and meaningful series of FixedResets’ Implied Volatilities. This doesn’t include Enbridge because although Enbridge has a large number of issues outstanding, all of which are quite liquid, the range of Issue Reset Spreads is too small for decent conclusions. The low is 212bp (ENB.PR.H; second-lowest is ENB.PR.D at 237bp) and the high is a mere 268 for ENB.PF.G.
Remember that all rich /cheap assessments are:
» based on Implied Volatility Theory only
» are relative only to other FixedResets from the same issuer
» assume constant GOC-5 yield
» assume constant Implied Volatility
» assume constant spread
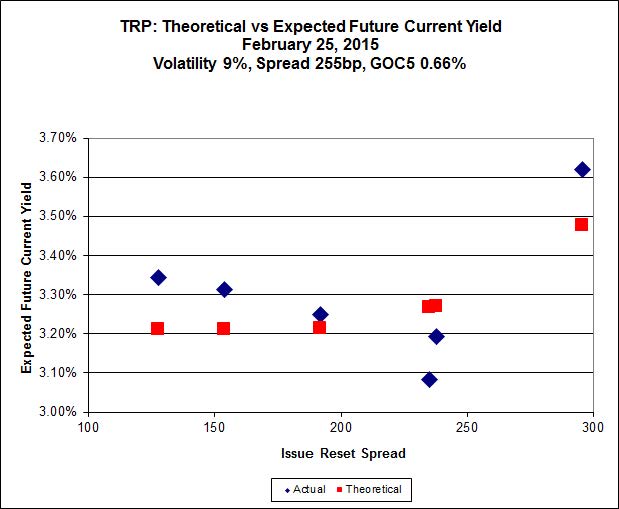
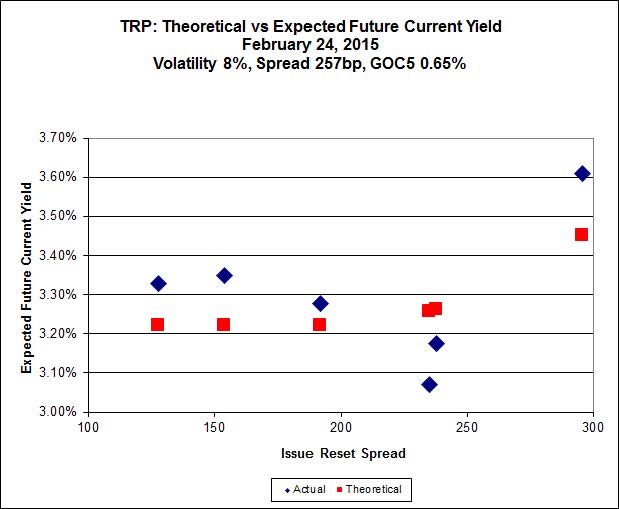
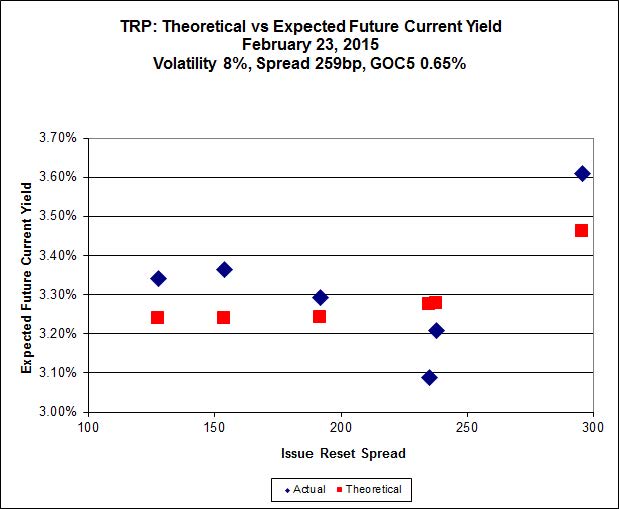
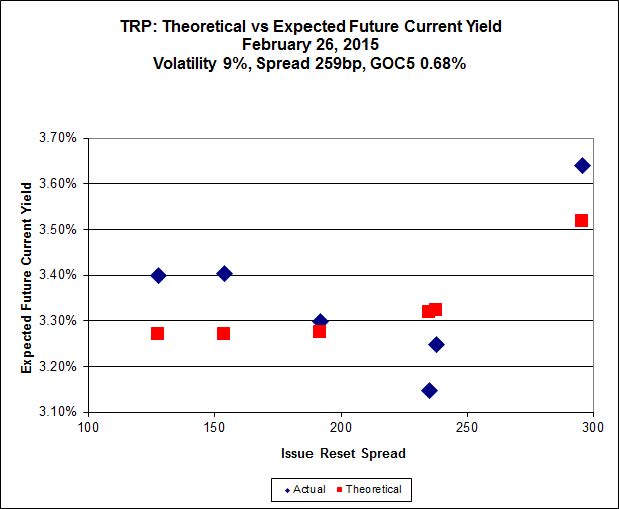
Here’s TRP:
Click for Big
The new issue has caused a large change in the curve-fitting for the TRP series of FixedResets, which is discussed at greater length on the post announcing the new issue. TRP.PR.E, which resets 2019-10-30 at +235, is bid at 24.07 to be $1.24 rich, while the new issue, resetting 2020-11-30 at +296, is $0.87 cheap at its issue price of 25.00.
Click for Big
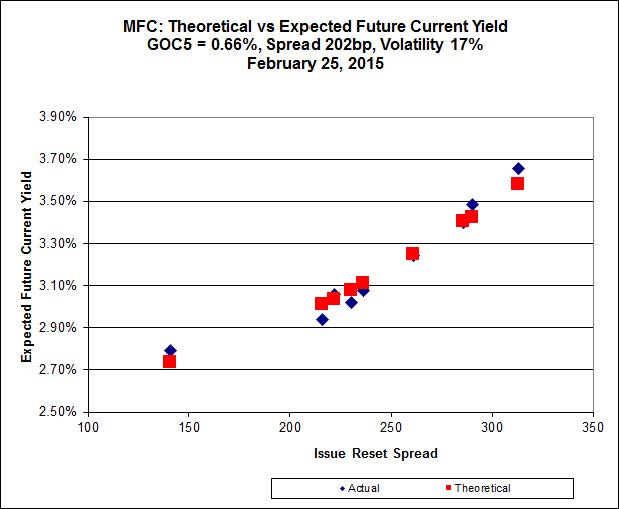
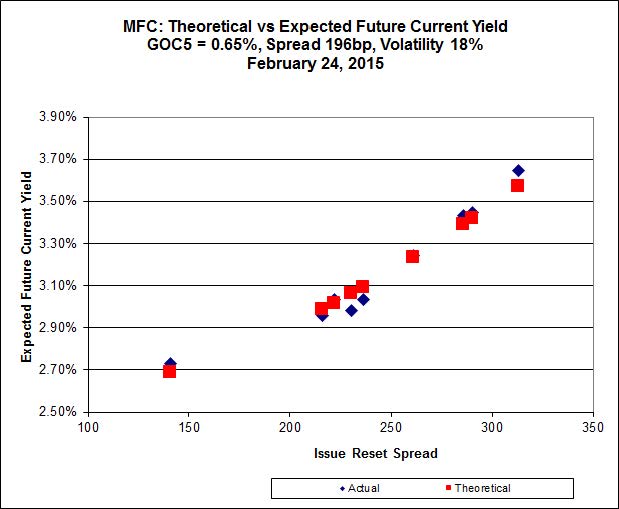
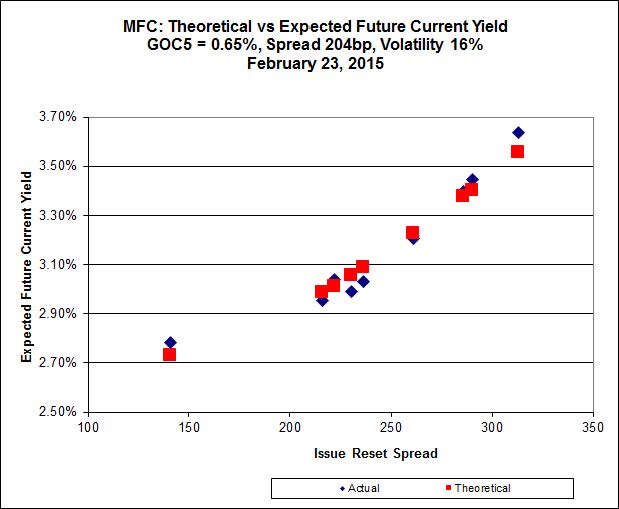
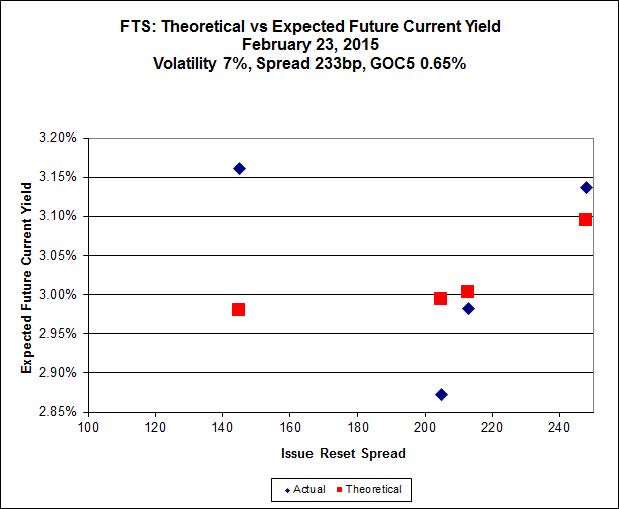
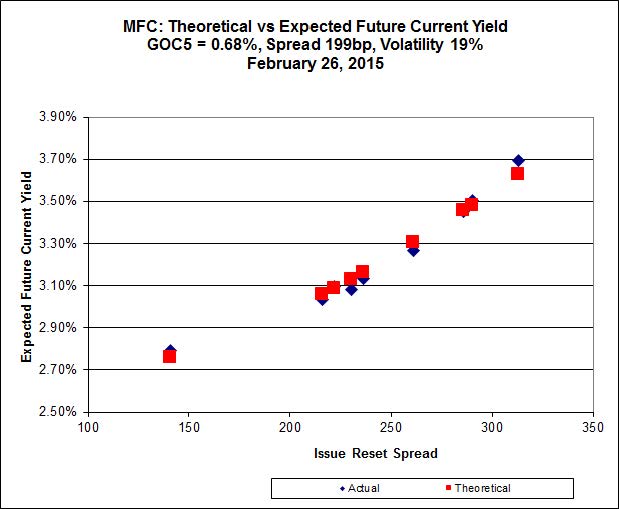
Another excellent fit, but the numbers are perplexing. Implied Volatility for MFC continues to be a conundrum, although it declined substantially today. It is still too high if we consider that NVCC rules will never apply to these issues; it is still too low if we consider them to be NVCC non-compliant issues (and therefore with Deemed Maturities in the call schedule).
Most expensive is MFC.PR.N, resetting at +230 on 2020-3-19, bid at 24.18 to be $0.38 rich, while MFC.PR.H, resetting at +313bp on 2017-3-19, is bid at 25.80 to be $0.46 cheap.
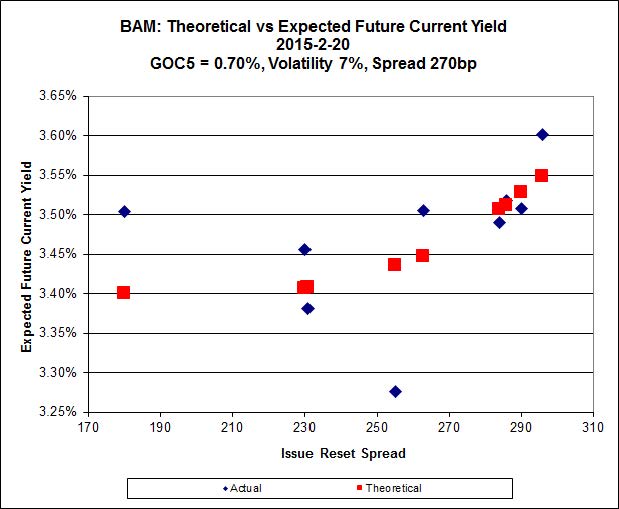
Click for Big
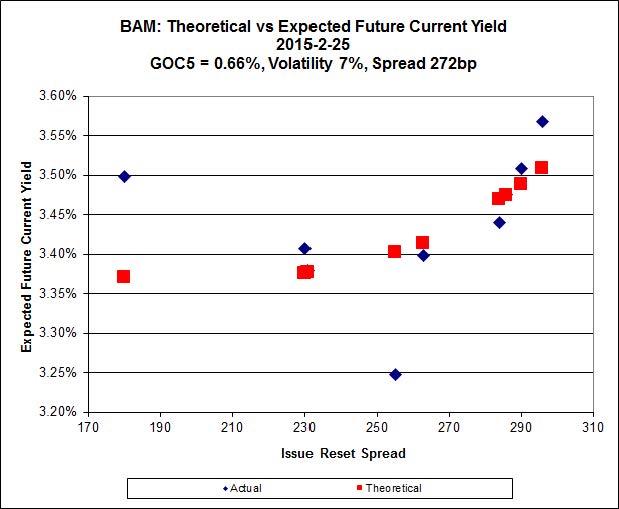
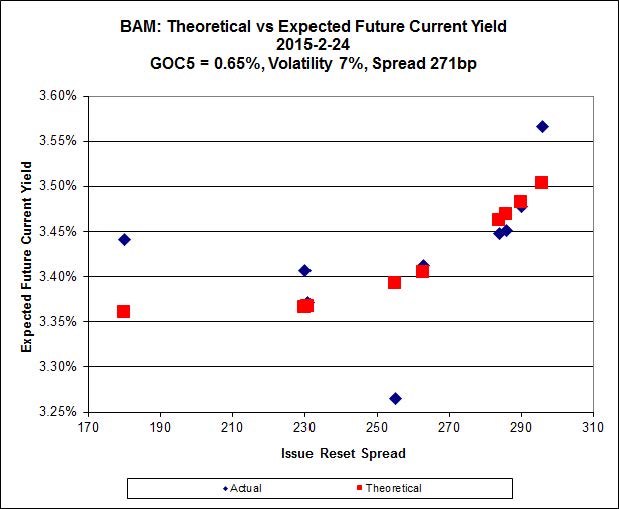
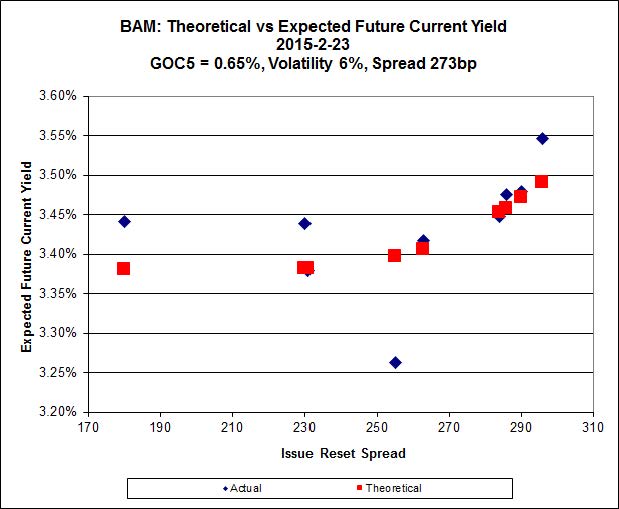
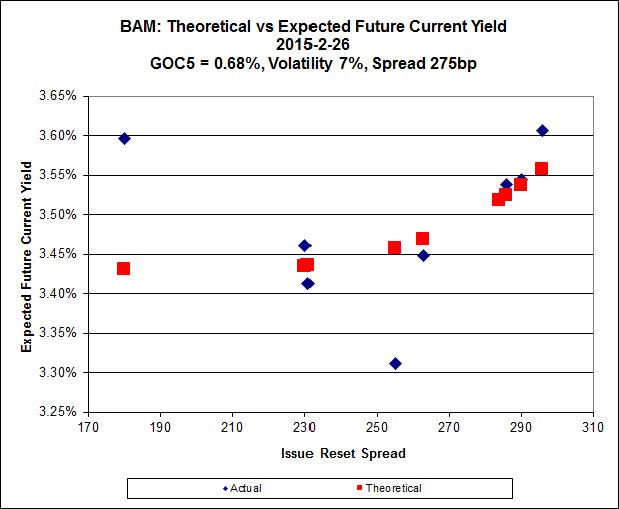
The fit on this series is actually quite reasonable – it’s the scale that makes it look so weird.
The cheapest issue relative to its peers is BAM.PR.X, resetting at +180bp on 2017-6-30, bid at 17.24 to be $0.84 cheap. BAM.PF.E, resetting at +255bp 2020-3-31 is bid at 24.39 and appears to be $1.03 rich.

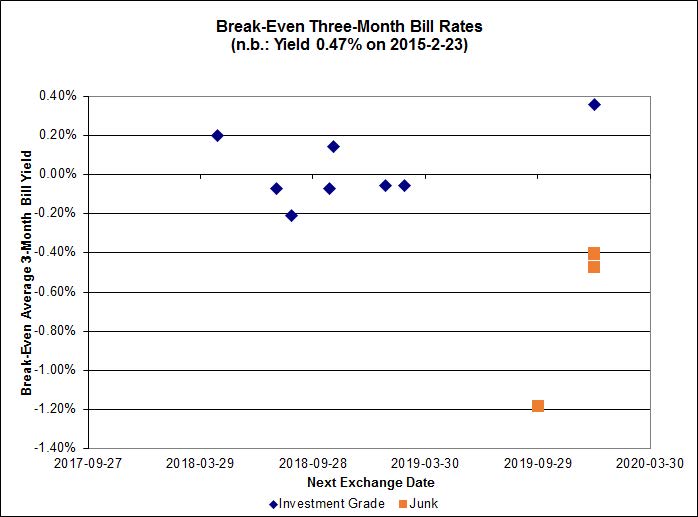
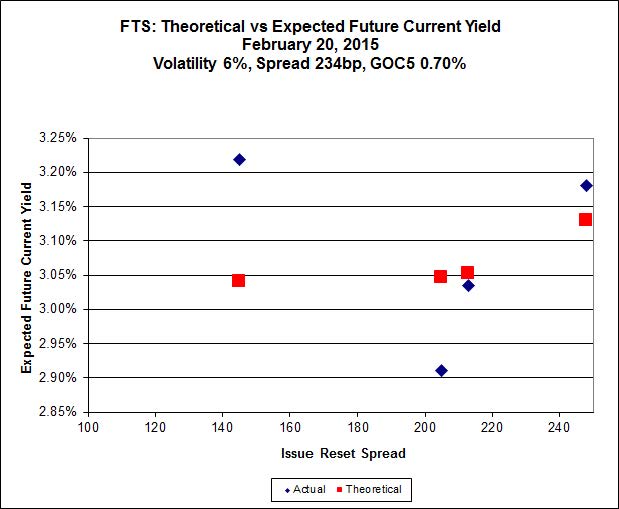
Click for Big
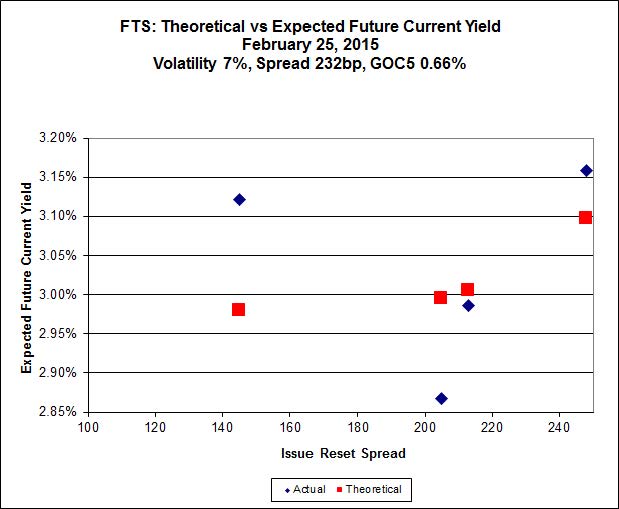
This is just weird because the middle is expensive and the ends are cheap but anyway … FTS.PR.H, with a spread of +145bp, and bid at 16.86, looks $0.83 cheap and resets 2015-6-1. FTS.PR.K, with a spread of +205bp and resetting 2019-3-1, is bid at 23.51 and is $0.94 rich.

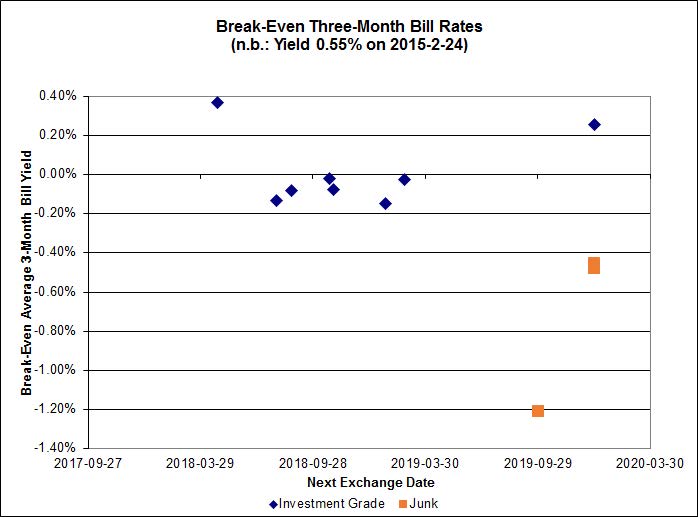
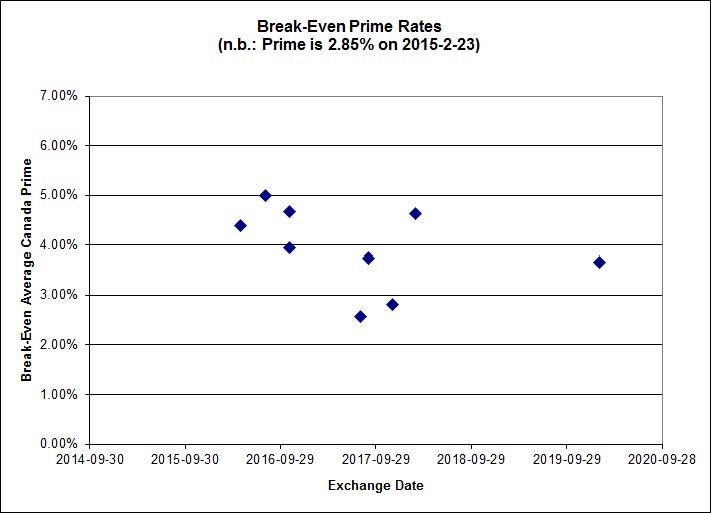
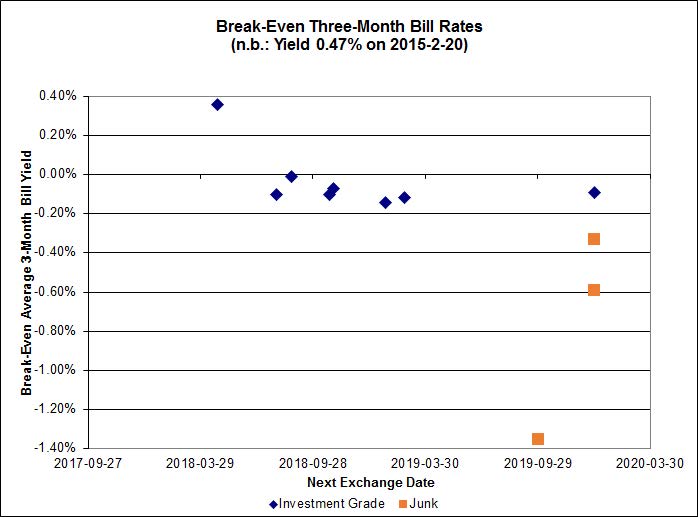
Click for Big
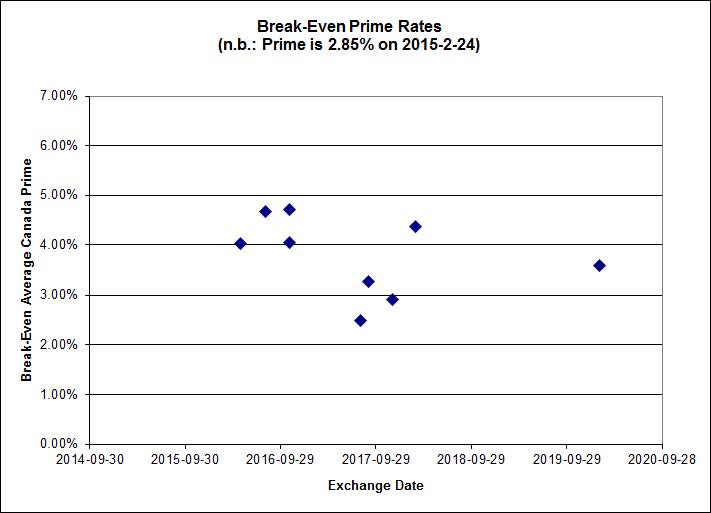
Most of the investment grade break-even rates are close to zero.
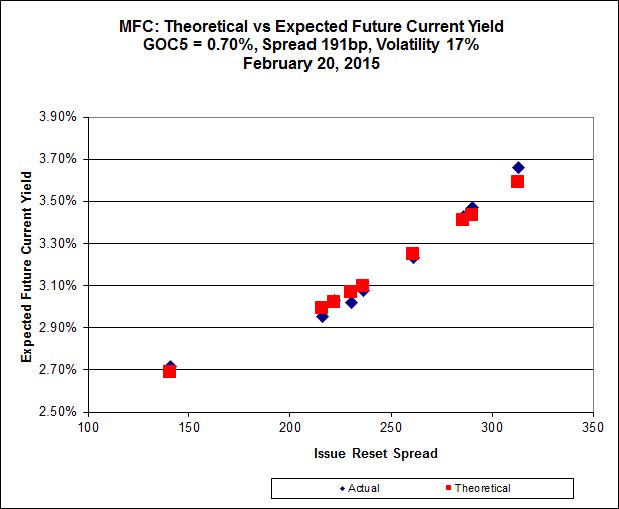
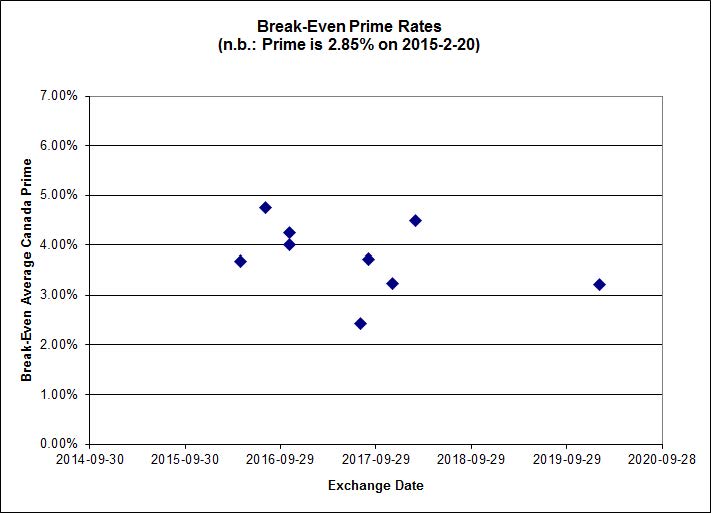
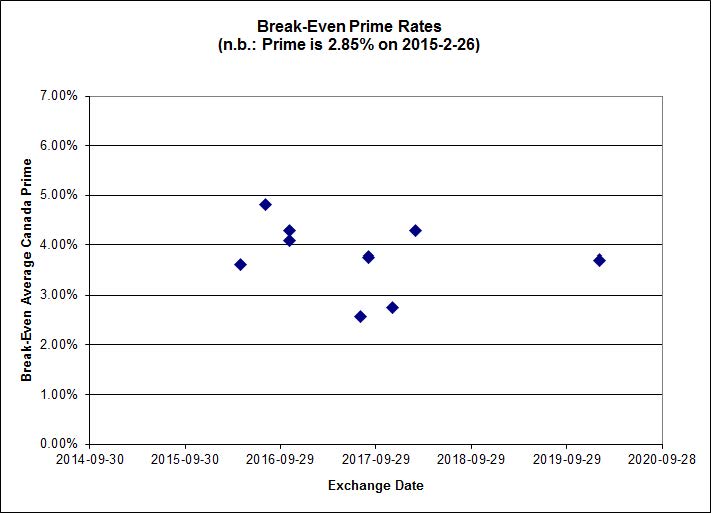
On the other hand, the market’s distaste for product linked to Money Market rates does not extend to prime, as shown by the FixedFloater/RatchetRate pairs:
Click for Big
Shall we just say that this exhibits a high level of confidence in the continued rapacity of Canadian banks?
| HIMIPref™ Preferred Indices These values reflect the December 2008 revision of the HIMIPref™ Indices Values are provisional and are finalized monthly |
|||||||
| Index | Mean Current Yield (at bid) |
Median YTW |
Median Average Trading Value |
Median Mod Dur (YTW) |
Issues | Day’s Perf. | Index Value |
| Ratchet | 0.00 % | 0.00 % | 0 | 0.00 | 0 | 0.1262 % | 2,294.0 |
| FixedFloater | 4.37 % | 3.52 % | 18,699 | 18.38 | 1 | 1.0233 % | 4,041.0 |
| Floater | 3.14 % | 3.29 % | 64,663 | 18.94 | 4 | 0.1262 % | 2,438.6 |
| OpRet | 4.08 % | 1.39 % | 110,236 | 0.31 | 1 | 0.0000 % | 2,760.4 |
| SplitShare | 4.40 % | 4.28 % | 28,352 | 3.55 | 6 | 0.2370 % | 3,220.0 |
| Interest-Bearing | 0.00 % | 0.00 % | 0 | 0.00 | 0 | 0.0000 % | 2,524.1 |
| Perpetual-Premium | 5.33 % | -0.17 % | 55,716 | 0.08 | 24 | 0.0049 % | 2,515.3 |
| Perpetual-Discount | 4.95 % | 4.92 % | 106,817 | 15.65 | 10 | -0.1791 % | 2,795.8 |
| FixedReset | 4.45 % | 3.41 % | 213,018 | 16.83 | 78 | -0.3973 % | 2,401.8 |
| Deemed-Retractible | 4.92 % | 0.11 % | 100,920 | 0.17 | 39 | -0.0989 % | 2,650.0 |
| FloatingReset | 2.43 % | 2.85 % | 94,896 | 6.38 | 7 | 0.1022 % | 2,326.6 |
| Performance Highlights | |||
| Issue | Index | Change | Notes |
| MFC.PR.C | Deemed-Retractible | -2.64 % | YTW SCENARIO Maturity Type : Hard Maturity Maturity Date : 2025-01-31 Maturity Price : 25.00 Evaluated at bid price : 23.61 Bid-YTW : 5.22 % |
| MFC.PR.L | FixedReset | -2.42 % | YTW SCENARIO Maturity Type : Hard Maturity Maturity Date : 2025-01-31 Maturity Price : 25.00 Evaluated at bid price : 23.42 Bid-YTW : 4.09 % |
| PWF.PR.P | FixedReset | -2.15 % | YTW SCENARIO Maturity Type : Limit Maturity Maturity Date : 2045-02-26 Maturity Price : 18.20 Evaluated at bid price : 18.20 Bid-YTW : 3.23 % |
| SLF.PR.H | FixedReset | -2.03 % | YTW SCENARIO Maturity Type : Hard Maturity Maturity Date : 2025-01-31 Maturity Price : 25.00 Evaluated at bid price : 23.66 Bid-YTW : 3.61 % |
| ENB.PR.F | FixedReset | -2.02 % | YTW SCENARIO Maturity Type : Limit Maturity Maturity Date : 2045-02-26 Maturity Price : 19.40 Evaluated at bid price : 19.40 Bid-YTW : 4.28 % |
| TRP.PR.C | FixedReset | -1.75 % | YTW SCENARIO Maturity Type : Limit Maturity Maturity Date : 2045-02-26 Maturity Price : 16.31 Evaluated at bid price : 16.31 Bid-YTW : 3.52 % |
| BAM.PR.X | FixedReset | -1.54 % | YTW SCENARIO Maturity Type : Limit Maturity Maturity Date : 2045-02-26 Maturity Price : 17.24 Evaluated at bid price : 17.24 Bid-YTW : 4.00 % |
| BAM.PF.G | FixedReset | -1.42 % | YTW SCENARIO Maturity Type : Limit Maturity Maturity Date : 2045-02-26 Maturity Price : 23.14 Evaluated at bid price : 25.00 Bid-YTW : 3.67 % |
| CU.PR.G | Perpetual-Discount | -1.38 % | YTW SCENARIO Maturity Type : Limit Maturity Maturity Date : 2045-02-26 Maturity Price : 23.29 Evaluated at bid price : 23.62 Bid-YTW : 4.77 % |
| TRP.PR.E | FixedReset | -1.35 % | YTW SCENARIO Maturity Type : Limit Maturity Maturity Date : 2045-02-26 Maturity Price : 22.83 Evaluated at bid price : 24.07 Bid-YTW : 3.33 % |
| PWF.PR.A | Floater | -1.33 % | YTW SCENARIO Maturity Type : Limit Maturity Maturity Date : 2045-02-26 Maturity Price : 17.76 Evaluated at bid price : 17.76 Bid-YTW : 2.82 % |
| MFC.PR.N | FixedReset | -1.31 % | YTW SCENARIO Maturity Type : Hard Maturity Maturity Date : 2025-01-31 Maturity Price : 25.00 Evaluated at bid price : 24.18 Bid-YTW : 3.80 % |
| VNR.PR.A | FixedReset | -1.20 % | YTW SCENARIO Maturity Type : Limit Maturity Maturity Date : 2045-02-26 Maturity Price : 23.33 Evaluated at bid price : 24.70 Bid-YTW : 3.55 % |
| MFC.PR.M | FixedReset | -1.14 % | YTW SCENARIO Maturity Type : Hard Maturity Maturity Date : 2025-01-31 Maturity Price : 25.00 Evaluated at bid price : 24.26 Bid-YTW : 3.82 % |
| MFC.PR.B | Deemed-Retractible | -1.10 % | YTW SCENARIO Maturity Type : Hard Maturity Maturity Date : 2025-01-31 Maturity Price : 25.00 Evaluated at bid price : 24.30 Bid-YTW : 5.00 % |
| TRP.PR.D | FixedReset | -1.05 % | YTW SCENARIO Maturity Type : Limit Maturity Maturity Date : 2045-02-26 Maturity Price : 22.63 Evaluated at bid price : 23.56 Bid-YTW : 3.37 % |
| MFC.PR.I | FixedReset | -1.04 % | YTW SCENARIO Maturity Type : Call Maturity Date : 2017-09-19 Maturity Price : 25.00 Evaluated at bid price : 25.63 Bid-YTW : 3.28 % |
| BAM.PR.G | FixedFloater | 1.02 % | YTW SCENARIO Maturity Type : Limit Maturity Maturity Date : 2045-02-26 Maturity Price : 21.90 Evaluated at bid price : 21.72 Bid-YTW : 3.52 % |
| TRP.PR.B | FixedReset | 1.17 % | YTW SCENARIO Maturity Type : Limit Maturity Maturity Date : 2045-02-26 Maturity Price : 14.42 Evaluated at bid price : 14.42 Bid-YTW : 3.35 % |
| ENB.PF.A | FixedReset | 1.23 % | YTW SCENARIO Maturity Type : Limit Maturity Maturity Date : 2045-02-26 Maturity Price : 21.77 Evaluated at bid price : 22.17 Bid-YTW : 4.01 % |
| BAM.PR.K | Floater | 1.47 % | YTW SCENARIO Maturity Type : Limit Maturity Maturity Date : 2045-02-26 Maturity Price : 15.20 Evaluated at bid price : 15.20 Bid-YTW : 3.31 % |
| ENB.PF.G | FixedReset | 1.50 % | YTW SCENARIO Maturity Type : Limit Maturity Maturity Date : 2045-02-26 Maturity Price : 21.89 Evaluated at bid price : 22.40 Bid-YTW : 4.02 % |
| ENB.PF.C | FixedReset | 1.55 % | YTW SCENARIO Maturity Type : Limit Maturity Maturity Date : 2045-02-26 Maturity Price : 21.81 Evaluated at bid price : 22.25 Bid-YTW : 3.99 % |
| CGI.PR.D | SplitShare | 1.58 % | YTW SCENARIO Maturity Type : Soft Maturity Maturity Date : 2023-06-14 Maturity Price : 25.00 Evaluated at bid price : 25.70 Bid-YTW : 3.35 % |
| Volume Highlights | |||
| Issue | Index | Shares Traded |
Notes |
| RY.PR.J | FixedReset | 144,700 | Recent new issue. YTW SCENARIO Maturity Type : Limit Maturity Maturity Date : 2045-02-26 Maturity Price : 23.15 Evaluated at bid price : 25.02 Bid-YTW : 3.32 % |
| OSP.PR.A | SplitShare | 110,207 | Recent new issue. YTW SCENARIO Maturity Type : Hard Maturity Maturity Date : 2020-03-31 Maturity Price : 10.00 Evaluated at bid price : 10.12 Bid-YTW : 4.77 % |
| CM.PR.O | FixedReset | 73,930 | TD crossed 50,000 at 24.70. YTW SCENARIO Maturity Type : Limit Maturity Maturity Date : 2045-02-26 Maturity Price : 23.09 Evaluated at bid price : 24.67 Bid-YTW : 3.11 % |
| ENB.PR.F | FixedReset | 65,111 | RBC bought 10,100 from Scotia at 19.80. YTW SCENARIO Maturity Type : Limit Maturity Maturity Date : 2045-02-26 Maturity Price : 19.40 Evaluated at bid price : 19.40 Bid-YTW : 4.28 % |
| ENB.PR.N | FixedReset | 63,458 | Scotia crossed 14,000 at 20.30. YTW SCENARIO Maturity Type : Limit Maturity Maturity Date : 2045-02-26 Maturity Price : 20.34 Evaluated at bid price : 20.34 Bid-YTW : 4.24 % |
| BMO.PR.S | FixedReset | 49,288 | Scotia crossed blocks of 17,600 and 25,000, both at 24.95. YTW SCENARIO Maturity Type : Limit Maturity Maturity Date : 2045-02-26 Maturity Price : 23.20 Evaluated at bid price : 24.93 Bid-YTW : 3.05 % |
| There were 41 other index-included issues trading in excess of 10,000 shares. | |||
| Wide Spread Highlights | ||
| Issue | Index | Quote Data and Yield Notes |
| MFC.PR.C | Deemed-Retractible | Quote: 23.61 – 24.34 Spot Rate : 0.7300 Average : 0.4221 YTW SCENARIO |
| MFC.PR.L | FixedReset | Quote: 23.42 – 24.25 Spot Rate : 0.8300 Average : 0.6360 YTW SCENARIO |
| RY.PR.F | Deemed-Retractible | Quote: 25.50 – 25.91 Spot Rate : 0.4100 Average : 0.2356 YTW SCENARIO |
| BAM.PF.G | FixedReset | Quote: 25.00 – 25.39 Spot Rate : 0.3900 Average : 0.2405 YTW SCENARIO |
| BAM.PR.N | Perpetual-Discount | Quote: 23.28 – 23.65 Spot Rate : 0.3700 Average : 0.2318 YTW SCENARIO |
| ENB.PR.F | FixedReset | Quote: 19.40 – 19.85 Spot Rate : 0.4500 Average : 0.3197 YTW SCENARIO |