Category: Market Action

Market Action

December 15, 2014

STRIPS are taking off!

An obscure corner of the $12.4 trillion market for U.S. government debt is providing one of the clearest signs yet that bond investors are writing off the threat of inflation for years, if not decades, to come.

Demand for Strips, created when Wall Street banks separate the interest payments from the principal of U.S. debt and sell each at a discount, has boosted the amount outstanding to an average $211 billion this year, the most since 1999, data from the Treasury Department show. The securities, the most vulnerable to inflation of all U.S. government bonds, posted the biggest returns this year by rallying almost 50 percent.

This is particularly impressive given that the yield curve is relatively flat; the STRIPS term curve will always (by inexorable mathematics) be steeper than the bond term curve, on an accelerating basis as the bond curve gets steeper … some of these investors might find themselves bankrupt and bewildered if the curve steepens; which, theoretically, it should do as the market starts pricing in policy rate hikes (cf. 1994).

There is much wailing over drops in the CAD:

The Canadian dollar slumped below the 86-cent mark today as oil prices slipped again.

And don’t expect it to get much better, though there may be some higher points along the way.

The loonie, as Canada’s dollar coin is known, closed at 85.79 cents U.S. today, down more than half a cent.

This came as oil prices, which had stabilized, tumbled yet again, continuing the weeks of turmoil.

But it ain’t got nuthin’ on the ruble:

The ruble tumbled the most since 1998, sliding past 60 for the first time, as traders tested Russia’s willingness to defend the currency amid an oil slump that’s pushing the economy toward recession.

The ruble weakened 9.1 percent to 64.0005 per dollar at 7:57 p.m. in Moscow, the steepest slide on a closing basis since the year Russia defaulted on local-currency debt. The 10-year government bond yield rose 23 basis points to 13.23 percent. Three-month implied volatility for the ruble climbed to a six-year high as the rout triggered the Bank of Russia to sell foreign exchange, according to BCS Financial Group and MDM Bank.

Traders are pressing the central bank to buy more rubles to limit a selloff that has wiped out 22 percent of the currency’s value this month. Oil’s slide toward $60 a barrel in London and sanctions over the conflict in Ukraine are undermining confidence in Russian assets as evidence mounts that the economy is entering a recession. Industrial output fell the most in more than a year in November, data showed today.

Assiduous Reader JP, who continues to send me interesting stuff when youse guys can’t be bothered, sends me a picture, and tells me to note the high and low:

ruble_141215
Click for Big

Faced with this, Russia’s central bank had little choice but to acknowledge Russia’s third world status:

The central bank increased the key rate to 17 percent from 10.5 percent effective today, it said in a statement on its website. Policy makers gathered for an unscheduled meeting after a one-point increase on Dec. 11.

“This decision is aimed at limiting substantially increased ruble depreciation risks and inflation risks,” the bank said in the statement.

Russia’s central bank raised interest rates for the sixth time in 2014 after more than $80 billion spent from its reserves failed to stop a 49 percent selloff of the ruble, the world’s worst-performing currency this year. President Vladimir Putin, whose incursion into Ukraine’s Crimea peninsula in March prompted the U.S. and its allies to strike back with sanctions, this month called for “harsh” measures to deter currency speculators.

The ruble yesterday tumbled past 60 for the first time on record, losing 9.7 percent to 64.4455 a dollar. That extended its plunge this year to 49 percent, which overtook the Ukrainian hryvnia’s drop. Brent, the grade of oil traders look at for pricing Russia’s main export blend, slipped 79 cents, or 1.3 percent, to end the session at $61.06 a barrel on the London-based ICE Futures Europe exchange.

Basically, nobody knows what’s going on:

Canadian stocks fell, extending losses after the worst week in three years, as declines among materials and energy shares offset gains in consumer stocks.

Materials companies lost 3.3 percent as gold and silver fell on speculation the Federal Reserve is moving closer to raising U.S. interest rates amid an improving economy. Energy shares lost 0.9 percent as oil fell to the lowest level in more than five years. Talisman Energy Inc. rallied 18 percent as people familiar with the matter said Canada Pension Plan Investment Board is weighing a bid for the oil-and-gas explorer.

The Standard & Poor’s/TSX Composite Index (SPTSX) lost 25.91 points, or 0.2 percent, to 13,705.14 at 4 p.m. in Toronto, after rising as much as 0.9 percent and then falling 0.7 percent. The equity gauge dropped 5.1 percent last week, its worst weekly decline since September 2011. Trading in S&P/TSX stocks was 31 percent below the 30-day average at closing time.

Canadian equities have pared their gain for the year to 0.6 percent, after rallying as much as 15 percent to a record in September. Oil, bank and raw-material shares, which collectively account for two-thirds of the S&P/TSX, are the worst performers among 10 groups this year, led by a 20 percent slump in energy, according to data compiled by Bloomberg.

Rumours regarding Repsol / Talisman are getting very specific:

Spain’s Repsol SA has submitted an $8.3-billion (U.S.) takeover bid for Talisman Energy Inc. amid falling oil prices and questions about Talisman’s long-term prospects, a source familiar with the situation said on Monday.

Under the offer, Repsol would pay $8 (U.S.) per share of Calgary-base‎d Talisman, the source said.

It was a deceptively mixed day for the Canadian preferred share market, with PerpetualDiscounts up 13bp, FixedResets gaining 4bp and DeemedRetractibles off 1bp, but the modest averages masked a lot of turmoil. There’s yet another very lengthy list of performance highlights, dominated by losing low-spread FixedResets. We may even have entered a period of self-feeding tax-loss selling (many of the losers are also volume highlights), but we won’t know until the season ends! Volume was above average.

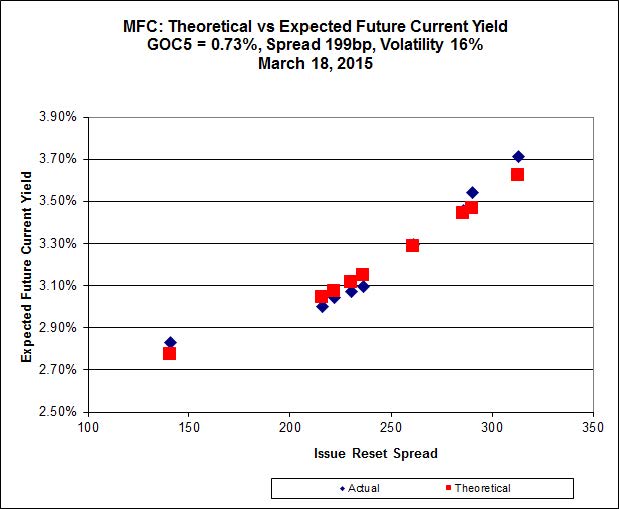
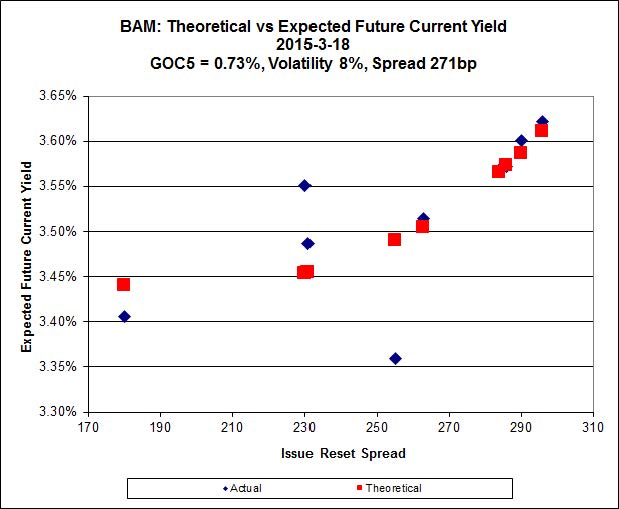
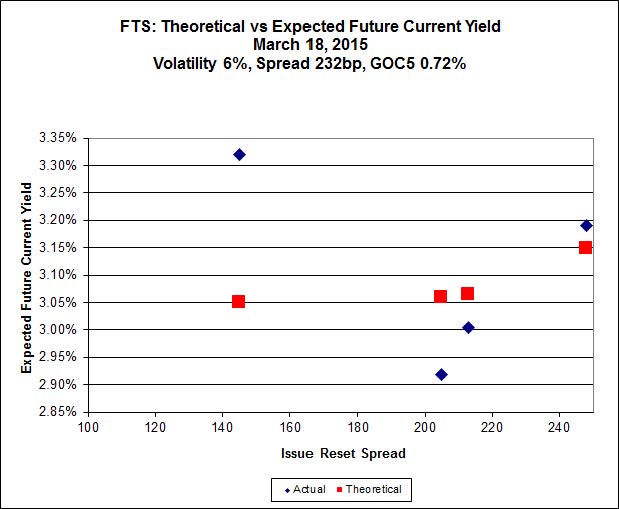
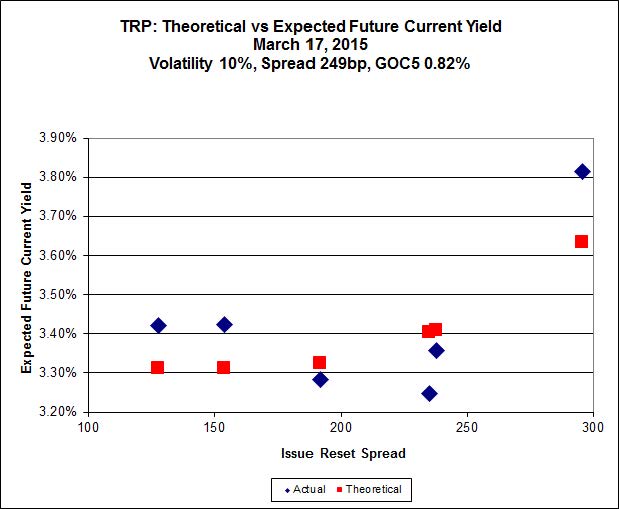
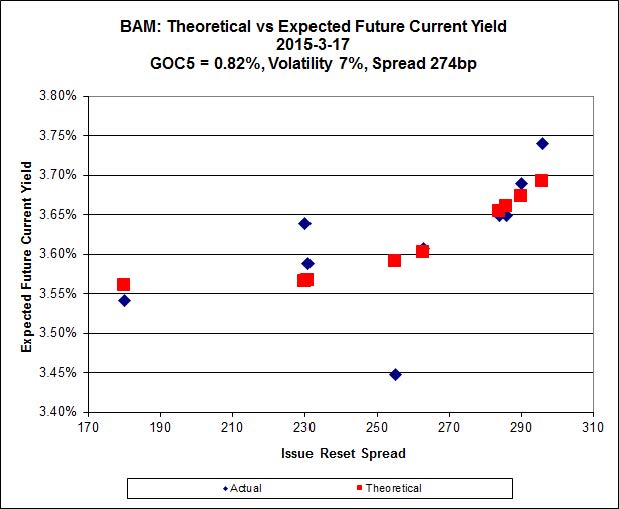
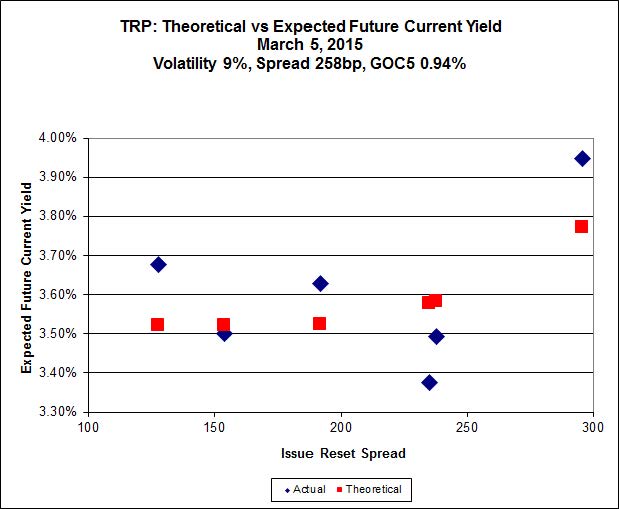
For as long as the FixedReset market is so violently unsettled, I’ll keep publishing updates of the more interesting and meaningful series of FixedResets’ Implied Volatilities. This doesn’t include Enbridge because although Enbridge has a large number of issues outstanding, all of which are quite liquid, the range of Issue Reset Spreads is too small for decent conclusions. The low is 212bp (ENB.PR.H; second-lowest is ENB.PR.D at 237bp) and the high is a mere 268 for ENB.PF.G.

Remember that all rich /cheap assessments are:

  • based on Implied Volatility Theory only
  • are relative only to other FixedResets from the same issuer
  • assume constant GOC-5 yield
  • assume constant Implied Volatility
  • assume constant spread

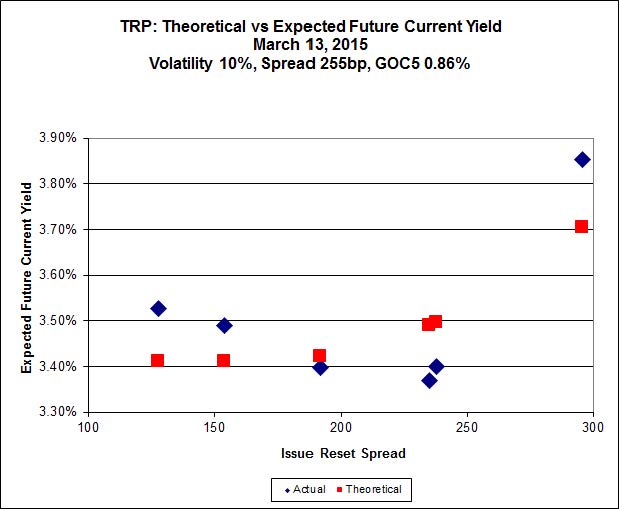
Here’s TRP:

impVol_TRP_141215
Click for Big

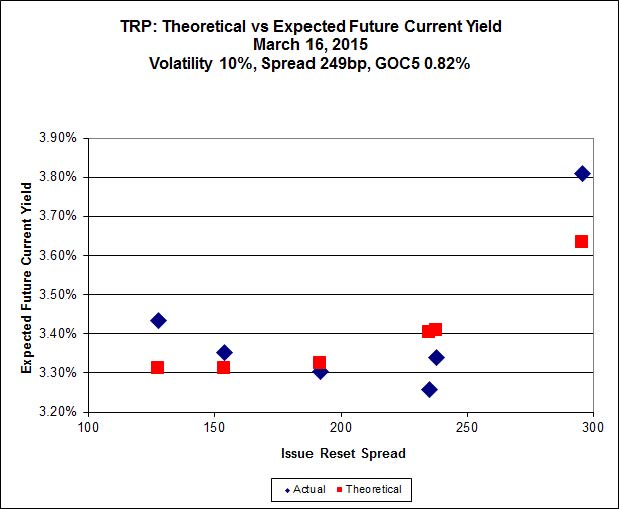
So according to this, TRP.PR.A, bid at 19.20, is $2.13 cheap (!), but it has already reset (at +192). TRP.PR.D, bid at 25.15 and resetting at +238bp on 2019-4-30 is $0.81 rich and TRP.PR.E, bid at 25.20 and resetting at +235bp on 2019-10-30, is $1.00 rich. The TRP issues seem to be steadily rationalizing, but there continues to be pressure on TRP.PR.A.

Now, this is really interesting. TRP.PR.A will pay 3.266%, which is to say $0.8165, until its next reset date 2019-12-31. TRP.PR.E will continue to pay its initial dividend of $1.0625 until it resets 2019-10-30 at +235. See that? Two month’s difference in reset. I think we can disregard forecasts of changes in GOC-5 yield that get that precise. That is to say, over the next five years, TRP.PR.E will pay a total of about $1.25 more than TRP.PR.A. Then it will reset at 46bp more, which is to say $0.115 p.a., forever.

And yet the difference in price is … is … SIX DOLLARS! That seems to me to be a lot to pay for a short term payment of $1.25, leaving $4.75, to earn $0.115, or 2.42%. But some people, it would seem, find this quite reasonable.

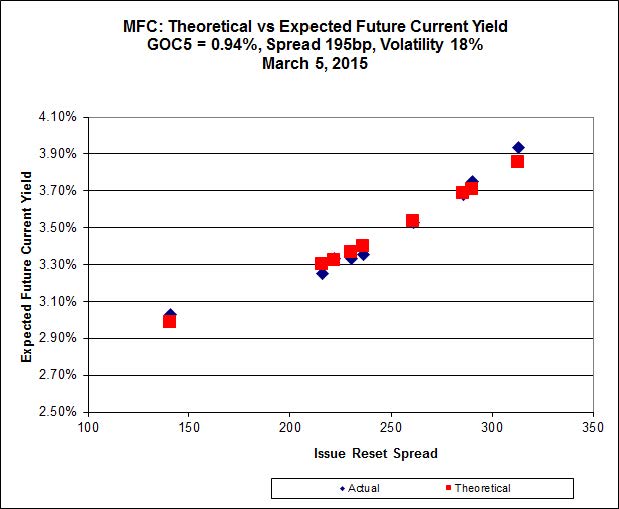
impVol_MFC_141215
Click for Big

MFC has a very good fit to theory, but the Implied Volatility is very high.

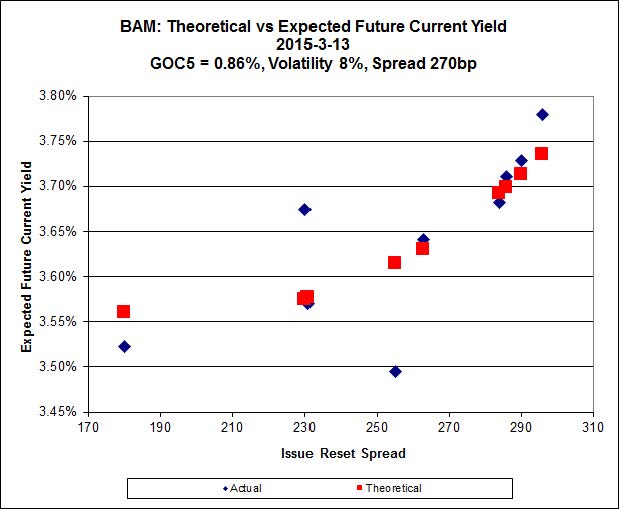
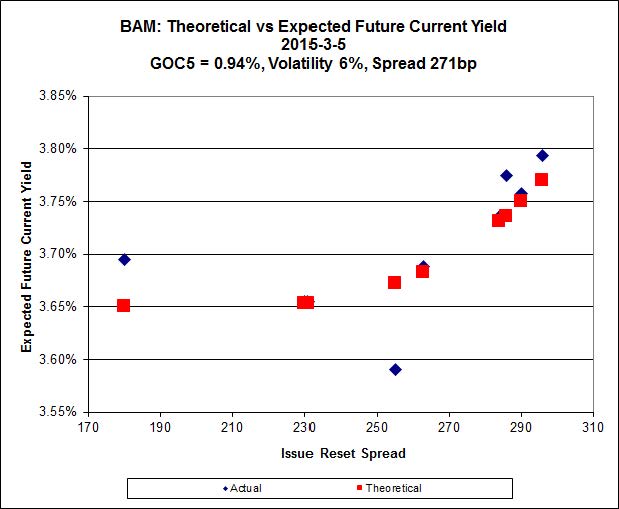
impVol_BAM_141215
Click for Big

There continues to be extraordinary cheapness in the lowest-spread issue, BAM.PR.X, resetting at +180bp on 2017-6-30, is bid at 20.12 and appears to be $0.89 cheap, while BAM.PR.R, resetting at +230bp 2016-6-30 is bid at 25.00 and appears to be $1.49 rich.

impVol_FTS_141215
Click for Big

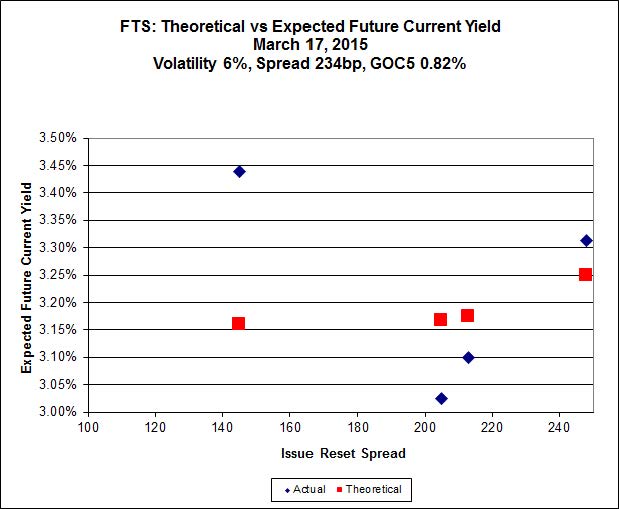
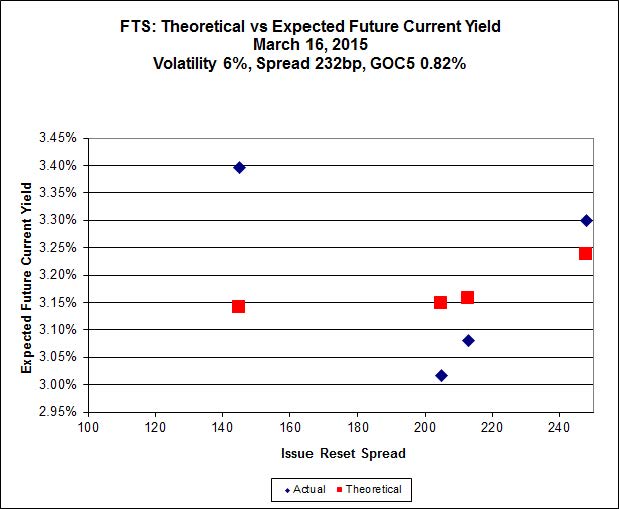
This is just weird because the middle is expensive and the ends are cheap but anyway … FTS.PR.H, with a spread of +145bp, and bid at 18.40, looks $1.01 cheap and resets 2015-6-1. FTS.PR.K, with a spread of +205bp, and bid at 24.20, looks $0.66 expensive and resets 2019-3-1

HIMIPref™ Preferred Indices
These values reflect the December 2008 revision of the HIMIPref™ Indices

Values are provisional and are finalized monthly
Index Mean
Current
Yield
(at bid)
Median
YTW
Median
Average
Trading
Value
Median
Mod Dur
(YTW)
Issues Day’s Perf. Index Value
Ratchet 0.00 % 0.00 % 0 0.00 0 0.3030 % 2,509.2
FixedFloater 0.00 % 0.00 % 0 0.00 0 0.3030 % 3,972.6
Floater 3.02 % 3.11 % 59,635 19.45 4 0.3030 % 2,667.5
OpRet 4.41 % -3.87 % 27,159 0.08 2 -0.0979 % 2,749.3
SplitShare 4.31 % 4.11 % 45,189 3.71 5 -0.0531 % 3,173.5
Interest-Bearing 0.00 % 0.00 % 0 0.00 0 -0.0979 % 2,514.0
Perpetual-Premium 5.44 % -0.36 % 73,710 0.08 20 -0.0509 % 2,473.9
Perpetual-Discount 5.22 % 5.14 % 109,492 15.21 15 0.1326 % 2,636.3
FixedReset 4.28 % 3.64 % 225,234 16.44 75 0.0382 % 2,517.2
Deemed-Retractible 5.00 % 1.81 % 97,526 0.20 40 -0.0080 % 2,600.7
FloatingReset 2.56 % 2.10 % 64,904 3.52 5 0.0079 % 2,533.6
Performance Highlights
Issue Index Change Notes
TRP.PR.A FixedReset -3.52 % YTW SCENARIO
Maturity Type : Limit Maturity
Maturity Date : 2044-12-15
Maturity Price : 19.20
Evaluated at bid price : 19.20
Bid-YTW : 4.22 %
FTS.PR.H FixedReset -2.65 % YTW SCENARIO
Maturity Type : Limit Maturity
Maturity Date : 2044-12-15
Maturity Price : 18.40
Evaluated at bid price : 18.40
Bid-YTW : 3.81 %
ENB.PR.T FixedReset -2.03 % YTW SCENARIO
Maturity Type : Limit Maturity
Maturity Date : 2044-12-15
Maturity Price : 21.82
Evaluated at bid price : 22.23
Bid-YTW : 4.34 %
HSE.PR.A FixedReset -1.86 % YTW SCENARIO
Maturity Type : Limit Maturity
Maturity Date : 2044-12-15
Maturity Price : 19.04
Evaluated at bid price : 19.04
Bid-YTW : 4.11 %
ENB.PR.A Perpetual-Premium -1.74 % YTW SCENARIO
Maturity Type : Limit Maturity
Maturity Date : 2044-12-15
Maturity Price : 24.56
Evaluated at bid price : 24.81
Bid-YTW : 5.58 %
FTS.PR.K FixedReset -1.71 % YTW SCENARIO
Maturity Type : Limit Maturity
Maturity Date : 2044-12-15
Maturity Price : 22.92
Evaluated at bid price : 24.20
Bid-YTW : 3.53 %
ENB.PR.H FixedReset -1.49 % YTW SCENARIO
Maturity Type : Limit Maturity
Maturity Date : 2044-12-15
Maturity Price : 20.48
Evaluated at bid price : 20.48
Bid-YTW : 4.36 %
ENB.PF.G FixedReset -1.34 % YTW SCENARIO
Maturity Type : Limit Maturity
Maturity Date : 2044-12-15
Maturity Price : 22.55
Evaluated at bid price : 23.59
Bid-YTW : 4.32 %
BMO.PR.Q FixedReset -1.08 % YTW SCENARIO
Maturity Type : Hard Maturity
Maturity Date : 2022-01-31
Maturity Price : 25.00
Evaluated at bid price : 23.74
Bid-YTW : 3.67 %
GWO.PR.G Deemed-Retractible -1.04 % YTW SCENARIO
Maturity Type : Hard Maturity
Maturity Date : 2025-01-31
Maturity Price : 25.00
Evaluated at bid price : 24.65
Bid-YTW : 5.39 %
PWF.PR.S Perpetual-Discount -1.03 % YTW SCENARIO
Maturity Type : Limit Maturity
Maturity Date : 2044-12-15
Maturity Price : 23.58
Evaluated at bid price : 23.95
Bid-YTW : 5.06 %
PWF.PR.T FixedReset 1.02 % YTW SCENARIO
Maturity Type : Limit Maturity
Maturity Date : 2044-12-15
Maturity Price : 23.45
Evaluated at bid price : 25.70
Bid-YTW : 3.56 %
BNS.PR.P FixedReset 1.17 % YTW SCENARIO
Maturity Type : Call
Maturity Date : 2018-04-25
Maturity Price : 25.00
Evaluated at bid price : 26.00
Bid-YTW : 2.24 %
BNS.PR.Y FixedReset 1.51 % YTW SCENARIO
Maturity Type : Hard Maturity
Maturity Date : 2022-01-31
Maturity Price : 25.00
Evaluated at bid price : 24.15
Bid-YTW : 3.00 %
MFC.PR.J FixedReset 1.54 % YTW SCENARIO
Maturity Type : Call
Maturity Date : 2018-03-19
Maturity Price : 25.00
Evaluated at bid price : 25.65
Bid-YTW : 3.16 %
TRP.PR.D FixedReset 2.28 % YTW SCENARIO
Maturity Type : Limit Maturity
Maturity Date : 2044-12-15
Maturity Price : 23.26
Evaluated at bid price : 25.15
Bid-YTW : 3.64 %
Volume Highlights
Issue Index Shares
Traded
Notes
FTS.PR.H FixedReset 214,150 Desjardins crossed 188,300 at 18.00.
YTW SCENARIO
Maturity Type : Limit Maturity
Maturity Date : 2044-12-15
Maturity Price : 18.40
Evaluated at bid price : 18.40
Bid-YTW : 3.81 %
TRP.PR.A FixedReset 120,518 Will reset at 3.266%. Desjardins crossed 20,800 at 19.33. RBC crossed blocks of 28,200 and 24,200 at the same price.
YTW SCENARIO
Maturity Type : Limit Maturity
Maturity Date : 2044-12-15
Maturity Price : 19.20
Evaluated at bid price : 19.20
Bid-YTW : 4.22 %
ENB.PR.Y FixedReset 79,491 Scotia bought 10,700 from National at 21.90.
YTW SCENARIO
Maturity Type : Limit Maturity
Maturity Date : 2044-12-15
Maturity Price : 21.59
Evaluated at bid price : 21.92
Bid-YTW : 4.30 %
CM.PR.E Perpetual-Premium 36,275 Called for redemption 2015-1-31.
YTW SCENARIO
Maturity Type : Call
Maturity Date : 2015-01-14
Maturity Price : 25.00
Evaluated at bid price : 25.30
Bid-YTW : -0.42 %
TRP.PR.C FixedReset 33,937 RBC crossed 13,200 at 18.96.
YTW SCENARIO
Maturity Type : Limit Maturity
Maturity Date : 2044-12-15
Maturity Price : 18.71
Evaluated at bid price : 18.71
Bid-YTW : 3.97 %
BNS.PR.Q FixedReset 29,083 RBC crossed 25,000 at 25.77.
YTW SCENARIO
Maturity Type : Call
Maturity Date : 2018-10-25
Maturity Price : 25.00
Evaluated at bid price : 25.72
Bid-YTW : 2.95 %
There were 36 other index-included issues trading in excess of 10,000 shares.
Wide Spread Highlights
Issue Index Quote Data and Yield Notes
CGI.PR.D SplitShare Quote: 25.05 – 26.14
Spot Rate : 1.0900
Average : 0.6202

YTW SCENARIO
Maturity Type : Soft Maturity
Maturity Date : 2023-06-14
Maturity Price : 25.00
Evaluated at bid price : 25.05
Bid-YTW : 3.74 %

PWF.PR.A Floater Quote: 19.25 – 20.00
Spot Rate : 0.7500
Average : 0.4576

YTW SCENARIO
Maturity Type : Limit Maturity
Maturity Date : 2044-12-15
Maturity Price : 19.25
Evaluated at bid price : 19.25
Bid-YTW : 2.74 %

ENB.PF.G FixedReset Quote: 23.59 – 24.15
Spot Rate : 0.5600
Average : 0.3519

YTW SCENARIO
Maturity Type : Limit Maturity
Maturity Date : 2044-12-15
Maturity Price : 22.55
Evaluated at bid price : 23.59
Bid-YTW : 4.32 %

ENB.PR.A Perpetual-Premium Quote: 24.81 – 25.30
Spot Rate : 0.4900
Average : 0.2943

YTW SCENARIO
Maturity Type : Limit Maturity
Maturity Date : 2044-12-15
Maturity Price : 24.56
Evaluated at bid price : 24.81
Bid-YTW : 5.58 %

BAM.PF.A FixedReset Quote: 25.33 – 25.75
Spot Rate : 0.4200
Average : 0.2618

YTW SCENARIO
Maturity Type : Limit Maturity
Maturity Date : 2044-12-15
Maturity Price : 23.38
Evaluated at bid price : 25.33
Bid-YTW : 4.09 %

MFC.PR.B Deemed-Retractible Quote: 23.62 – 24.07
Spot Rate : 0.4500
Average : 0.3005

YTW SCENARIO
Maturity Type : Hard Maturity
Maturity Date : 2025-01-31
Maturity Price : 25.00
Evaluated at bid price : 23.62
Bid-YTW : 5.39 %

Market Action

December 12, 2014

Well, that was a week and a half!

U.S. stocks sank, with the Dow Jones Industrial Average capping its biggest weekly drop in three years, as oil continued to slide and Chinese industrial data raised concern over a global economic slowdown.

Materials stocks declined the most in the Standard & Poor’s 500 Index, losing 2.9 percent as a group, while energy shares dropped 2.2 percent. International Business Machines Corp., DuPont Co. and Exxon Mobil Corp. sank at least 2.9 percent to lead declines in all 30 Dow stocks.

The S&P 500 lost 1.6 percent to 2,002.33 at 4 p.m. in New York, extending losses in the final hour to cap a weekly drop of 3.5 percent. The Dow sank 315.51 points, or 1.8 percent, to 17,280.83. The Dow slid 3.8 percent for the week, its biggest decline since November 2011.

Canada did worse:

Canadian stocks tumbled with equities around the world, capping the worst week in three years, as the continuing selloff in oil fueled concerns over a global economic slowdown.

Energy stocks dropped with oil prices as RMP Energy Inc. and Pacific Rubiales Energy Corp. slid at least 7.9 percent. Consumer-discretionary stocks sank as Amaya Inc. plunged 18 percent. Talisman Energy Inc. soared 17 percent on speculation of a deal with Repsol SA.

The Standard & Poor’s/TSX Composite Index (SPTSX) fell 173.22 points, or 1.3 percent, to 13,731.9 at 4 p.m. in Toronto. The equity gauge dropped 5.1 percent over five days, its worst weekly decline since September 2011. Trading in S&P/TSX stocks was 12 percent above the 30-day average at this time of day.

But it’s an ill wind…:

Inflation is moribund and bond buyers love it.

As crude oil leads a collapse in commodity prices, a German gauge of the outlook for inflation over the next five years has fallen below zero. With no increases in consumer prices in sight, bondholders’ interest and repayments are worth more, inflaming demand for fixed income. The longest maturities are setting the pace from Europe to the U.S.

The rush for bonds pushed yields in Germany and six other euro-area nations to record lows today, while in the U.S, 30-year yields closed at the lowest level since 2012, according to data compiled by Bloomberg. Adding to the momentum is the prospect that central-bank measures to rekindle inflation would involve efforts to keep down borrowing costs, including so-called quantitative easing from the European Central Bank

and Treasuries…:

Treasuries rallied, with 10-year yields reaching the lowest in eight weeks, as a plunge in crude oil raised concern global inflation is slipping further below central-bank targets before the Federal Reserve meets next week.

The notes posted the biggest weekly decline in yield since June 2012 as crude oil futures fell below $58 a barrel in New York. Fed policy makers will review whether to retain the vow to hold interest rates at virtually zero for a “considerable time.” The biggest U.S. jobs gains in November since January 2012 fueled speculation last week of quicker interest-rate increases, while reports showing slowing factory output in China’s and financial turmoil in Greece represent additional economic headwinds for the U.S.

Treasury 10-year note yields fell eight basis points, or 0.08 percentage point, to 2.08 percent at 5 p.m. in New York, according to Bloomberg Bond Trader prices, after reaching the lowest level since Oct. 16. The 2.25 percent security rose 23/32 or $7.19 per $1,000 face amount, to 101 15/32. The yield has fallen 22 basis points this week, the most since June 2012.

So it seems as if the CSE is introducing market-makers:

Following the successful completion of a pilot project with two symbols, the CSE is now accepting applications for Market Makers for all CSE-listed securities. As outlined in the November 14 notice the CSE is modifying its market making programme to improve execution quality and service for retail investors. Market Makers will have the following responsibilities in their assigned stocks:

  • •Maintain a bid/ask spread goal
  • •Provide a Guaranteed Minimum Fill for eligible orders
  • •Provide automatic odd lot execution, so that all incoming market or better limit odd lot orders will be auto traded at the bid/ask if they cannot be filled by booked odd lot orders;
  • •Ensure a reasonable bid/ask in the context of current market conditions
  • •Undergo periodic performance reviews

If the Toronto Stock Exchange is any guide, then:

  • The bid/ask spread goal will neither be publicized nor enforced
  • The size of the Guaranteed Minimum Fill will be top secret information, available only to those who pay for it
  • Automatic odd lot execution will be fine. Yay!
  • A reasonable bid/ask spread will be good fodder for jokes
  • performance reviews will not be public and nobody will ever lose their assignment

DBRS downgraded Timmy’s:

DBRS Limited (DBRS) has today downgraded the Issuer Rating of Tim Hortons Inc. (THI or the Company) to BB (low) and its Senior Unsecured Debt to B, with a recovery rating of RR6; the trends are Stable. This action follows the Company’s announcement that it has received regulatory approval for and its shareholders have voted in favour of the proposed transaction to create a new global quick-service restaurant leader that would own both THI and Burger King Worldwide, Inc. (Burger King) under a new parent company, Restaurant Brands International (RBI). DBRS has removed the ratings from Under Review with Negative Implications.

Financial Risk Profile
In terms of financial profile, RBI is expected to have balance sheet debt of over $9 billion and preferred shares of $3 billion. Combined with pro forma earnings, DBRS estimates the combined entity will have lease-adjusted debt-to-EBITDAR excluding the preferred shares of approximately 6.23 times (x) and fixed-charge coverage of 1.96x, including the preferred dividend, credit metrics considered at the lower-end of the B range of ratings. That said, the combined entity should nevertheless generate meaningful levels of free cash flow (based on solid operating cash flow and low maintenance capex) beginning in 2016 and could deleverage significantly through a combination of debt repayment and earnings growth.

But, wonder of wonders, the Canadian preferred share market had a very good day, with PerpetualDiscounts up 8bp, FixedResets rocketing up 62bp and DeemedRetractibles gaining 3bp. Not surprisingly, given the averages, the lengthy Performance Highlights table is dominated by FixedReset winners. Volume was high.

For as long as the FixedReset market is so violently unsettled, I’ll keep publishing updates of the more interesting and meaningful series of FixedResets’ Implied Volatilities. This doesn’t include Enbridge because although Enbridge has a large number of issues outstanding, all of which are quite liquid, the range of Issue Reset Spreads is too small for decent conclusions. The low is 212bp (ENB.PR.H; second-lowest is ENB.PR.D at 237bp) and the high is a mere 268 for ENB.PF.G.

Remember that all rich /cheap assessments are:

  • based on Implied Volatility Theory only
  • are relative only to other FixedResets from the same issuer
  • assume constant GOC-5 yield
  • assume constant Implied Volatility
  • assume constant spread

Here’s TRP:

impVol_TRP_141212
Click for Big

So according to this, TRP.PR.A, bid at 19.90, is $1.29 cheap, but it has already reset. TRP.PR.B, bid at 17.20, resetting 2015-6-30 is about 0.21 rich and TRP.PR.C, bid at 18.65, resetting 2016-1-30 is fairly priced. The TRP issues seem to be steadily rationalizing, but there continues to be pressure on TRP.PR.A.

impVol_MFC_141212
Click for Big

It looks like we’re back in the situation in which eight of the nine issues are well-behaved in accordance with theory, but extraordinary pressure on the lowest-spread issue, MFC.PR.F, is distorting the whole calculation. According to the distorted fit, MFC.PR.F, resetting at +141 on 2016-6-19 is about $0.62 cheap, while MFC.PR.L, resetting at +216 on 2019-6-19, is about $0.61 rich.

BAM is a little difficult to figure out:

impVol_BAM_141212
Click for Big

As with MFC, it looks as if extraordinary cheapness in the lowest-spread issue, BAM.PR.X, resetting at +180bp on 2017-6-30, may be throwing off the Implied Volatility calculation; be that as it may, BAM.PR.X is bid at 20.10 and appears to be $0.99 cheap, while BAM.PR.R, resetting at +230bp 2016-6-30 is bid at 25.02 and appears to be $1.43 rich.

impVol_FTS_141212
Click for Big

This is just weird because the middle is expensive and the ends are cheap but anyway … FTS.PR.H, with a spread of +145bp, and bid at 18.90, looks $0.81 cheap and resets 2015-6-1. FTS.PR.K, with a spread of +205bp, and bid at 24.62, looks $0.82 expensive and resets 2019-3-1

And now it’s time for PrefLetter!

HIMIPref™ Preferred Indices
These values reflect the December 2008 revision of the HIMIPref™ Indices

Values are provisional and are finalized monthly
Index Mean
Current
Yield
(at bid)
Median
YTW
Median
Average
Trading
Value
Median
Mod Dur
(YTW)
Issues Day’s Perf. Index Value
Ratchet 0.00 % 0.00 % 0 0.00 0 -0.8015 % 2,501.7
FixedFloater 0.00 % 0.00 % 0 0.00 0 -0.8015 % 3,960.6
Floater 3.03 % 3.13 % 61,910 19.42 4 -0.8015 % 2,659.4
OpRet 4.41 % -5.72 % 28,284 0.08 2 -0.1369 % 2,752.0
SplitShare 4.30 % 4.07 % 44,928 3.72 5 -0.1096 % 3,175.2
Interest-Bearing 0.00 % 0.00 % 0 0.00 0 -0.1369 % 2,516.4
Perpetual-Premium 5.44 % 1.31 % 74,566 0.08 20 0.0137 % 2,475.1
Perpetual-Discount 5.23 % 5.15 % 111,129 15.21 15 0.0750 % 2,632.9
FixedReset 4.28 % 3.64 % 224,047 16.51 75 0.6184 % 2,516.2
Deemed-Retractible 5.00 % 1.32 % 97,795 0.21 40 0.0279 % 2,600.9
FloatingReset 2.56 % 2.12 % 64,801 3.53 5 -0.3147 % 2,533.4
Performance Highlights
Issue Index Change Notes
TRP.PR.A FixedReset -2.45 % YTW SCENARIO
Maturity Type : Limit Maturity
Maturity Date : 2044-12-12
Maturity Price : 19.90
Evaluated at bid price : 19.90
Bid-YTW : 4.07 %
TRP.PR.C FixedReset -2.41 % YTW SCENARIO
Maturity Type : Limit Maturity
Maturity Date : 2044-12-12
Maturity Price : 18.65
Evaluated at bid price : 18.65
Bid-YTW : 3.98 %
BAM.PR.C Floater -1.24 % YTW SCENARIO
Maturity Type : Limit Maturity
Maturity Date : 2044-12-12
Maturity Price : 16.70
Evaluated at bid price : 16.70
Bid-YTW : 3.14 %
BAM.PR.B Floater -1.19 % YTW SCENARIO
Maturity Type : Limit Maturity
Maturity Date : 2044-12-12
Maturity Price : 16.61
Evaluated at bid price : 16.61
Bid-YTW : 3.15 %
FTS.PR.H FixedReset -1.05 % YTW SCENARIO
Maturity Type : Limit Maturity
Maturity Date : 2044-12-12
Maturity Price : 18.90
Evaluated at bid price : 18.90
Bid-YTW : 3.70 %
CU.PR.C FixedReset 1.00 % YTW SCENARIO
Maturity Type : Limit Maturity
Maturity Date : 2044-12-12
Maturity Price : 23.56
Evaluated at bid price : 25.25
Bid-YTW : 3.60 %
BNS.PR.R FixedReset 1.02 % YTW SCENARIO
Maturity Type : Hard Maturity
Maturity Date : 2022-01-31
Maturity Price : 25.00
Evaluated at bid price : 25.65
Bid-YTW : 3.25 %
IFC.PR.C FixedReset 1.10 % YTW SCENARIO
Maturity Type : Call
Maturity Date : 2016-09-30
Maturity Price : 25.00
Evaluated at bid price : 25.80
Bid-YTW : 2.26 %
MFC.PR.C Deemed-Retractible 1.10 % YTW SCENARIO
Maturity Type : Hard Maturity
Maturity Date : 2025-01-31
Maturity Price : 25.00
Evaluated at bid price : 22.90
Bid-YTW : 5.62 %
BAM.PR.R FixedReset 1.21 % YTW SCENARIO
Maturity Type : Limit Maturity
Maturity Date : 2044-12-12
Maturity Price : 23.72
Evaluated at bid price : 25.02
Bid-YTW : 3.64 %
BNS.PR.Q FixedReset 1.26 % YTW SCENARIO
Maturity Type : Call
Maturity Date : 2018-10-25
Maturity Price : 25.00
Evaluated at bid price : 25.70
Bid-YTW : 2.97 %
FTS.PR.K FixedReset 1.28 % YTW SCENARIO
Maturity Type : Limit Maturity
Maturity Date : 2044-12-12
Maturity Price : 23.09
Evaluated at bid price : 24.62
Bid-YTW : 3.44 %
ENB.PR.T FixedReset 1.29 % YTW SCENARIO
Maturity Type : Limit Maturity
Maturity Date : 2044-12-12
Maturity Price : 22.12
Evaluated at bid price : 22.69
Bid-YTW : 4.23 %
BAM.PF.F FixedReset 1.31 % YTW SCENARIO
Maturity Type : Call
Maturity Date : 2019-09-30
Maturity Price : 25.00
Evaluated at bid price : 25.53
Bid-YTW : 3.98 %
NA.PR.S FixedReset 1.39 % YTW SCENARIO
Maturity Type : Limit Maturity
Maturity Date : 2044-12-12
Maturity Price : 23.35
Evaluated at bid price : 25.45
Bid-YTW : 3.60 %
TRP.PR.E FixedReset 1.61 % YTW SCENARIO
Maturity Type : Limit Maturity
Maturity Date : 2044-12-12
Maturity Price : 23.24
Evaluated at bid price : 25.20
Bid-YTW : 3.67 %
IFC.PR.A FixedReset 1.72 % YTW SCENARIO
Maturity Type : Hard Maturity
Maturity Date : 2025-01-31
Maturity Price : 25.00
Evaluated at bid price : 23.00
Bid-YTW : 4.39 %
MFC.PR.L FixedReset 1.87 % YTW SCENARIO
Maturity Type : Hard Maturity
Maturity Date : 2025-01-31
Maturity Price : 25.00
Evaluated at bid price : 25.04
Bid-YTW : 3.66 %
BMO.PR.M FixedReset 1.91 % YTW SCENARIO
Maturity Type : Hard Maturity
Maturity Date : 2022-01-31
Maturity Price : 25.00
Evaluated at bid price : 25.12
Bid-YTW : 3.15 %
MFC.PR.F FixedReset 1.93 % YTW SCENARIO
Maturity Type : Hard Maturity
Maturity Date : 2025-01-31
Maturity Price : 25.00
Evaluated at bid price : 21.15
Bid-YTW : 4.92 %
BAM.PF.A FixedReset 1.96 % YTW SCENARIO
Maturity Type : Call
Maturity Date : 2018-09-30
Maturity Price : 25.00
Evaluated at bid price : 25.51
Bid-YTW : 3.87 %
BNS.PR.P FixedReset 2.15 % YTW SCENARIO
Maturity Type : Call
Maturity Date : 2018-04-25
Maturity Price : 25.00
Evaluated at bid price : 25.70
Bid-YTW : 2.60 %
BAM.PF.B FixedReset 2.39 % YTW SCENARIO
Maturity Type : Limit Maturity
Maturity Date : 2044-12-12
Maturity Price : 23.18
Evaluated at bid price : 24.88
Bid-YTW : 3.90 %
GWO.PR.N FixedReset 2.54 % YTW SCENARIO
Maturity Type : Hard Maturity
Maturity Date : 2025-01-31
Maturity Price : 25.00
Evaluated at bid price : 20.16
Bid-YTW : 5.19 %
MFC.PR.H FixedReset 2.93 % YTW SCENARIO
Maturity Type : Call
Maturity Date : 2017-03-19
Maturity Price : 25.00
Evaluated at bid price : 26.01
Bid-YTW : 2.72 %
PWF.PR.T FixedReset 5.47 % YTW SCENARIO
Maturity Type : Limit Maturity
Maturity Date : 2044-12-12
Maturity Price : 23.37
Evaluated at bid price : 25.44
Bid-YTW : 3.61 %
Volume Highlights
Issue Index Shares
Traded
Notes
IAG.PR.E Deemed-Retractible 148,462 Nesbitt crossed 148,400 at 25.98.
YTW SCENARIO
Maturity Type : Call
Maturity Date : 2015-01-30
Maturity Price : 26.00
Evaluated at bid price : 25.97
Bid-YTW : 4.43 %
ENB.PR.Y FixedReset 122,022 RBC crossed 97,800 at 21.90.
YTW SCENARIO
Maturity Type : Limit Maturity
Maturity Date : 2044-12-12
Maturity Price : 21.58
Evaluated at bid price : 21.91
Bid-YTW : 4.30 %
FTS.PR.M FixedReset 106,445 Scotia crossed blocks of 53,200 and 40,000, both at 25.15.
YTW SCENARIO
Maturity Type : Limit Maturity
Maturity Date : 2044-12-12
Maturity Price : 23.23
Evaluated at bid price : 25.20
Bid-YTW : 3.71 %
MFC.PR.N FixedReset 71,890 Recent new issue.
YTW SCENARIO
Maturity Type : Hard Maturity
Maturity Date : 2025-01-31
Maturity Price : 25.00
Evaluated at bid price : 25.01
Bid-YTW : 3.74 %
TRP.PR.A FixedReset 53,405 Will reset at 3.266%.
YTW SCENARIO
Maturity Type : Limit Maturity
Maturity Date : 2044-12-12
Maturity Price : 19.90
Evaluated at bid price : 19.90
Bid-YTW : 4.07 %
CM.PR.E Perpetual-Premium 48,584 Called for redemption 2015-1-31.
YTW SCENARIO
Maturity Type : Call
Maturity Date : 2015-01-11
Maturity Price : 25.00
Evaluated at bid price : 25.30
Bid-YTW : -0.97 %
There were 45 other index-included issues trading in excess of 10,000 shares.
Wide Spread Highlights
Issue Index Quote Data and Yield Notes
NEW.PR.D SplitShare Quote: 32.47 – 33.35
Spot Rate : 0.8800
Average : 0.6946

YTW SCENARIO
Maturity Type : Call
Maturity Date : 2015-06-26
Maturity Price : 32.07
Evaluated at bid price : 32.47
Bid-YTW : 3.52 %

PWF.PR.P FixedReset Quote: 20.60 – 21.18
Spot Rate : 0.5800
Average : 0.4300

YTW SCENARIO
Maturity Type : Limit Maturity
Maturity Date : 2044-12-12
Maturity Price : 20.60
Evaluated at bid price : 20.60
Bid-YTW : 3.67 %

TRP.PR.D FixedReset Quote: 24.59 – 25.16
Spot Rate : 0.5700
Average : 0.4215

YTW SCENARIO
Maturity Type : Limit Maturity
Maturity Date : 2044-12-12
Maturity Price : 23.06
Evaluated at bid price : 24.59
Bid-YTW : 3.75 %

TRP.PR.C FixedReset Quote: 18.65 – 19.10
Spot Rate : 0.4500
Average : 0.3112

YTW SCENARIO
Maturity Type : Limit Maturity
Maturity Date : 2044-12-12
Maturity Price : 18.65
Evaluated at bid price : 18.65
Bid-YTW : 3.98 %

IGM.PR.B Perpetual-Premium Quote: 26.05 – 26.50
Spot Rate : 0.4500
Average : 0.3421

YTW SCENARIO
Maturity Type : Call
Maturity Date : 2018-12-31
Maturity Price : 25.00
Evaluated at bid price : 26.05
Bid-YTW : 4.96 %

TRP.PR.B FixedReset Quote: 17.20 – 17.49
Spot Rate : 0.2900
Average : 0.1856

YTW SCENARIO
Maturity Type : Limit Maturity
Maturity Date : 2044-12-12
Maturity Price : 17.20
Evaluated at bid price : 17.20
Bid-YTW : 3.81 %

Market Action

December 11, 2014

The war on markets continues:

Citigroup Inc. (C) and Goldman Sachs Group Inc. were among 10 banks fined for failing to shield analysts from pressure to promote stocks a decade after a U.S. crackdown sought to end Wall Street conflicts of interest.

The investment banks promised favorable research to Toys “R” Us Inc. and its private-equity owners in 2010 to win roles in its initial public offering, the Financial Industry Regulatory Authority said today in a statement. The regulator fined the firms a total of $43.5 million, faulting them for “implicitly or explicitly” making promises that their analysts would give positive coverage. Six of the 10 firms didn’t have adequate supervisory procedures to prevent the practice.

Such silliness. Everything needs to be sold and brokerages are sales organizations; pretending otherwise just leads to problems and building an incentive to get around the rules right into the rules. The tension inherent in the current pretense of objectivity is unsustainable; however, as with all other unsustainable financial market tensions, it is impossible to tell just how the situation will eventually resolve.

Rob Carrick of the Globe writes a piece titled Preferred shares will not protect you like bonds will :

Where preferreds do not deliver is in a stock market decline. As the example of the past month shows, you get only a modest buffer against the broader market’s losses. Bonds, by contrast, will often rise in price as stocks sink.

Investors who hold preferred shares have to ask themselves the same question as people who have migrated from bonds to dividend-paying common shares. The question is this: What’s my priority – protecting my portfolio by hedging against stock market risk, or generating an attractive flow of income? If you’re in preferred shares for the income and can live with sliding share prices, then consider them as a bond substitute or companion. If portfolio buoyancy is your goal, then look to bonds and move your preferred shares over the equity side of your portfolio.

Let’s look at part of that again:

Bonds, by contrast, will often rise in price as stocks sink.

What kind of bonds? Long, short, corporate, government? How often will they rise in price as stocks sink? How much? What was the trigger for the decline in stocks? This is all very vague, but ever since Ben Graham made his silly mistake it’s been a very popular fallacy.

As mentioned yesterday, I read through the BoC Financial Stability Report article by Ian Foucher and Kyle Gray titled Exchange-Traded Funds: Evolution of Benefits, Vulnerabilities and Risks:

  • The global market for exchange-traded funds (ETFs) has exhibited strong growth in recent years, reaching US$2.3 trillion by the end of 2013. ETFs have clear advantages for investors, such as low-cost portfolio diversification and the liquidity of an exchange-traded product. However, recent disruptions in certain ETF products have highlighted the need to better understand the vulnerabilities and risks associated with this market.
  • ETFs are generally perceived by investors as having equity-like liquidity, but in times of stress, this liquidity may prove illusory for some funds. Synthetic ETFs also carry additional counterparty and collateral risk. If any of these risks materialized, it could trigger an investor run, which could negatively impact the underlying market as well as other similar funds.
  • The synthetic ETF market in Canada has a high concentration of counterparty risk compared with other jurisdictions. However, given the small size of this market segment, it does not represent a significant vulnerability for the Canadian financial system. Nonetheless, rapid changes in the ETF market imply that authorities need to monitor developments closely.

Well, it’s nice to have Canadian data and Canada-centric discussion, but there’s nothing really new that I can see. See the post Synthetic ETFs a Threat to Financial Stability? for links to a paper on the subject by Srichander Ramaswamy.

And let’s look at another part:

If portfolio buoyancy is your goal, then look to bonds and move your preferred shares over the equity side of your portfolio

Well, for most people that’s a pretty stupid goal, frankly. Ask not what you can do for your portfolio. Ask rather what your portfolio can do for you.

Q: Why did you scrimp and save for forty years?

A: Well, you see, my investment objective is portfolio buoyancy.

If portfolio buoyancy is your goal – for some bizarre reason that almost certainly has nothing to do with your actual life – even CAPM will tell you the right answer: reduce market exposure.

What kind of bonds? Maybe junk energy bonds?

The danger of stimulus-induced bubbles is starting to play out in the market for energy-company debt.

Since early 2010, energy producers have raised $550 billion of new bonds and loans as the Federal Reserve held borrowing costs near zero, according to Deutsche Bank AG. With oil prices plunging, investors are questioning the ability of some issuers to meet their debt obligations. Research firm CreditSights Inc. predicts the default rate for energy junk bonds will double to eight percent next year.

“Anything that becomes a mania — it ends badly,” said Tim Gramatovich, who helps manage more than $800 million as chief investment officer of Santa Barbara, California-based Peritus Asset Management. “And this is a mania.”

But after the series of bad days we’ve been having, insurance sure would be nice!

luckInsurance

Well, according to my figures it was a mixed day on the Canadian preferred share market, but it will be remembered from yesterday that the Toronto Stock Exchange sold me moronic data for FTS.PR.F, making it down 11.87% on a bid/bid basis; today it has bounced back 11.16% and that has screwed up the figures again, which are PerpetualDiscounts up 60bp, FixedResets down 54bp and DeemedRetractibles gaining 4bp. The S&P/TSX indices, which use price/price to calculate returns, are TXPR down 54bp and TXPL down 81bp, so it was a pretty rough day. There is yet another lengthy list of performance highlights which is yet again dominated by losing FixedResets – although it is nice to see SLF.PR.G and MFC.PR.F, recent heavy heavy heavy losers, on the plus side of the ledger for a change. Volume was very high.

For as long as the FixedReset market is so violently unsettled, I’ll keep publishing updates of the more interesting and meaningful series of FixedResets’ Implied Volatilities. This doesn’t include Enbridge because although Enbridge has a large number of issues outstanding, all of which are quite liquid, the range of Issue Reset Spreads is too small for decent conclusions. The low is 212bp (ENB.PR.H; second-lowest is ENB.PR.D at 237bp) and the high is a mere 268 for ENB.PF.G.

Remember that all rich /cheap assessments are:

  • based on Implied Volatility Theory only
  • are relative only to other FixedResets from the same issuer
  • assume constant GOC-5 yield
  • assume constant Implied Volatility
  • assume constant spread

Here’s TRP:

impVol_TRP_141211
Click for Big

So according to this, TRP.PR.A, bid at 20.40, is $1.08 cheap, but it has already reset. TRP.PR.B, bid at 17.25, resetting 2015-6-30 and TRP.PR.C, bid at 19.11, resetting 2016-1-30 are both fairly priced. The TRP issues seem to be steadily rationalizing, but there continues to be pressure on TRP.PR.A.

impVol_MFC_141211
Click for Big

Excellent performance by MFC.PR.F today restored the Implied Volatility calculation to approximately what is was on December 8. Implied Volatility is very high at 38% – which indicates to me that the market accepts a relatively high degree of directionality (towards par) in future prices – MFC.PR.F, resetting at +141 on 2016-6-19 is about $0.85 cheap, while MFC.PR.H, resetting at +313 on 2017-3-19, is about $1.02 cheap.

As shown by the next two charts, the curve-fitting for MFC is much less ambiguous than it has been for the past two days.

impVol_MFC_141211_varSpread
Click for Big
impVol_MFC_141211_varVol
Click for Big
Click for Big

BAM is a little hard to figure out.

impVol_BAM_141211
Click for Big

As with MFC on December 9 and December 10, it looks as if extraordinary cheapness in the lowest-spread issue, BAM.PR.X, resetting at +180bp on 2017-6-30, may be throwing off the Implied Volatility calculation; but that would leave the remaining issues trading at an very high Implied Volatility without any reason – whereas the MFC issues have, at a minimum, a chance of becoming subject to NVCC rules.

As calculated, though, BAM.PR.X, bid at 20.10, seems about $0.84 cheap while BAM.PR.R, resetting at +230 on 2016-6-30 and bid at 24.72, seems $1.40 rich.

impVol_FTS_141211
Click for Big

This is just weird because the middle is expensive and the ends are cheap but anyway … FTS.PR.H, with a spread of +145bp, and bid at 19.10, looks $0.66 cheap and resets 2015-6-1. FTS.PR.K, with a spread of +205bp, and bid at 24.31, looks $0.66 expensive and resets 2019-3-1

HIMIPref™ Preferred Indices
These values reflect the December 2008 revision of the HIMIPref™ Indices

Values are provisional and are finalized monthly
Index Mean
Current
Yield
(at bid)
Median
YTW
Median
Average
Trading
Value
Median
Mod Dur
(YTW)
Issues Day’s Perf. Index Value
Ratchet 0.00 % 0.00 % 0 0.00 0 -0.1226 % 2,521.9
FixedFloater 0.00 % 0.00 % 0 0.00 0 -0.1226 % 3,992.6
Floater 3.01 % 3.10 % 62,468 19.50 4 -0.1226 % 2,680.9
OpRet 4.40 % -9.95 % 27,474 0.08 2 0.1567 % 2,755.8
SplitShare 4.29 % 4.03 % 41,608 3.72 5 0.2125 % 3,178.6
Interest-Bearing 0.00 % 0.00 % 0 0.00 0 0.1567 % 2,519.9
Perpetual-Premium 5.44 % -1.15 % 74,743 0.08 20 0.0118 % 2,474.8
Perpetual-Discount 5.23 % 5.13 % 110,442 15.23 15 0.5967 % 2,630.9
FixedReset 4.31 % 3.79 % 215,621 16.45 75 -0.5437 % 2,500.7
Deemed-Retractible 5.00 % -1.37 % 101,195 0.21 40 0.0430 % 2,600.2
FloatingReset 2.55 % 2.03 % 63,755 3.46 5 -0.1100 % 2,541.4
Performance Highlights
Issue Index Change Notes
IFC.PR.A FixedReset -5.29 % YTW SCENARIO
Maturity Type : Hard Maturity
Maturity Date : 2025-01-31
Maturity Price : 25.00
Evaluated at bid price : 22.61
Bid-YTW : 4.70 %
PWF.PR.T FixedReset -4.66 % YTW SCENARIO
Maturity Type : Limit Maturity
Maturity Date : 2044-12-11
Maturity Price : 22.89
Evaluated at bid price : 24.12
Bid-YTW : 4.00 %
MFC.PR.H FixedReset -2.24 % YTW SCENARIO
Maturity Type : Call
Maturity Date : 2017-03-19
Maturity Price : 25.00
Evaluated at bid price : 25.27
Bid-YTW : 4.07 %
BMO.PR.M FixedReset -2.22 % YTW SCENARIO
Maturity Type : Hard Maturity
Maturity Date : 2022-01-31
Maturity Price : 25.00
Evaluated at bid price : 24.65
Bid-YTW : 3.52 %
TRP.PR.A FixedReset -2.11 % YTW SCENARIO
Maturity Type : Limit Maturity
Maturity Date : 2044-12-11
Maturity Price : 20.40
Evaluated at bid price : 20.40
Bid-YTW : 4.14 %
CU.PR.C FixedReset -1.96 % YTW SCENARIO
Maturity Type : Limit Maturity
Maturity Date : 2044-12-11
Maturity Price : 23.48
Evaluated at bid price : 25.00
Bid-YTW : 3.78 %
BMO.PR.Q FixedReset -1.85 % YTW SCENARIO
Maturity Type : Hard Maturity
Maturity Date : 2022-01-31
Maturity Price : 25.00
Evaluated at bid price : 23.90
Bid-YTW : 3.67 %
BAM.PF.B FixedReset -1.83 % YTW SCENARIO
Maturity Type : Limit Maturity
Maturity Date : 2044-12-11
Maturity Price : 22.96
Evaluated at bid price : 24.30
Bid-YTW : 4.14 %
BAM.PR.Z FixedReset -1.77 % YTW SCENARIO
Maturity Type : Limit Maturity
Maturity Date : 2044-12-11
Maturity Price : 23.44
Evaluated at bid price : 25.20
Bid-YTW : 4.33 %
MFC.PR.L FixedReset -1.68 % YTW SCENARIO
Maturity Type : Hard Maturity
Maturity Date : 2025-01-31
Maturity Price : 25.00
Evaluated at bid price : 24.58
Bid-YTW : 3.96 %
ENB.PR.T FixedReset -1.62 % YTW SCENARIO
Maturity Type : Limit Maturity
Maturity Date : 2044-12-11
Maturity Price : 21.94
Evaluated at bid price : 22.40
Bid-YTW : 4.42 %
BAM.PR.X FixedReset -1.51 % YTW SCENARIO
Maturity Type : Limit Maturity
Maturity Date : 2044-12-11
Maturity Price : 20.10
Evaluated at bid price : 20.10
Bid-YTW : 4.27 %
FTS.PR.M FixedReset -1.50 % YTW SCENARIO
Maturity Type : Limit Maturity
Maturity Date : 2044-12-11
Maturity Price : 23.16
Evaluated at bid price : 25.00
Bid-YTW : 3.87 %
TRP.PR.E FixedReset -1.39 % YTW SCENARIO
Maturity Type : Limit Maturity
Maturity Date : 2044-12-11
Maturity Price : 23.10
Evaluated at bid price : 24.80
Bid-YTW : 3.86 %
BNS.PR.P FixedReset -1.33 % YTW SCENARIO
Maturity Type : Call
Maturity Date : 2018-04-25
Maturity Price : 25.00
Evaluated at bid price : 25.16
Bid-YTW : 3.27 %
BAM.PF.A FixedReset -1.32 % YTW SCENARIO
Maturity Type : Limit Maturity
Maturity Date : 2044-12-11
Maturity Price : 23.28
Evaluated at bid price : 25.02
Bid-YTW : 4.27 %
FTS.PR.K FixedReset -1.26 % YTW SCENARIO
Maturity Type : Limit Maturity
Maturity Date : 2044-12-11
Maturity Price : 22.97
Evaluated at bid price : 24.31
Bid-YTW : 3.62 %
NA.PR.S FixedReset -1.22 % YTW SCENARIO
Maturity Type : Limit Maturity
Maturity Date : 2044-12-11
Maturity Price : 23.24
Evaluated at bid price : 25.10
Bid-YTW : 3.79 %
BNS.PR.Y FixedReset -1.09 % YTW SCENARIO
Maturity Type : Hard Maturity
Maturity Date : 2022-01-31
Maturity Price : 25.00
Evaluated at bid price : 23.60
Bid-YTW : 3.50 %
BNS.PR.Z FixedReset -1.07 % YTW SCENARIO
Maturity Type : Hard Maturity
Maturity Date : 2022-01-31
Maturity Price : 25.00
Evaluated at bid price : 24.11
Bid-YTW : 3.59 %
FTS.PR.J Perpetual-Discount -1.04 % YTW SCENARIO
Maturity Type : Limit Maturity
Maturity Date : 2044-12-11
Maturity Price : 23.39
Evaluated at bid price : 23.75
Bid-YTW : 5.02 %
BNS.PR.R FixedReset -1.01 % YTW SCENARIO
Maturity Type : Hard Maturity
Maturity Date : 2022-01-31
Maturity Price : 25.00
Evaluated at bid price : 25.39
Bid-YTW : 3.47 %
SLF.PR.G FixedReset 2.77 % YTW SCENARIO
Maturity Type : Hard Maturity
Maturity Date : 2025-01-31
Maturity Price : 25.00
Evaluated at bid price : 20.05
Bid-YTW : 5.49 %
MFC.PR.F FixedReset 5.06 % YTW SCENARIO
Maturity Type : Hard Maturity
Maturity Date : 2025-01-31
Maturity Price : 25.00
Evaluated at bid price : 20.75
Bid-YTW : 5.28 %
FTS.PR.F Perpetual-Discount 11.16 % YTW SCENARIO
Maturity Type : Limit Maturity
Maturity Date : 2044-12-11
Maturity Price : 23.70
Evaluated at bid price : 24.01
Bid-YTW : 5.13 %
Volume Highlights
Issue Index Shares
Traded
Notes
TRP.PR.A FixedReset 275,974 Will reset at 3.266% effective December 31. Desjardins crossed 200,000 at 20.30.
YTW SCENARIO
Maturity Type : Limit Maturity
Maturity Date : 2044-12-11
Maturity Price : 20.40
Evaluated at bid price : 20.40
Bid-YTW : 4.14 %
MFC.PR.N FixedReset 189,774 Recent new issue.
YTW SCENARIO
Maturity Type : Hard Maturity
Maturity Date : 2025-01-31
Maturity Price : 25.00
Evaluated at bid price : 25.02
Bid-YTW : 3.79 %
ENB.PR.N FixedReset 63,796 TD crossed 21,800 at 23.30.
YTW SCENARIO
Maturity Type : Limit Maturity
Maturity Date : 2044-12-11
Maturity Price : 22.36
Evaluated at bid price : 23.02
Bid-YTW : 4.42 %
ENB.PR.B FixedReset 58,272 TD crossed 39,700 at 23.10.
YTW SCENARIO
Maturity Type : Limit Maturity
Maturity Date : 2044-12-11
Maturity Price : 22.44
Evaluated at bid price : 22.90
Bid-YTW : 4.22 %
TRP.PR.E FixedReset 56,600 RBC crossed 50,000 at 25.27.
YTW SCENARIO
Maturity Type : Limit Maturity
Maturity Date : 2044-12-11
Maturity Price : 23.10
Evaluated at bid price : 24.80
Bid-YTW : 3.86 %
BAM.PR.Z FixedReset 47,893 YTW SCENARIO
Maturity Type : Limit Maturity
Maturity Date : 2044-12-11
Maturity Price : 23.44
Evaluated at bid price : 25.20
Bid-YTW : 4.33 %
There were 53 other index-included issues trading in excess of 10,000 shares.
Wide Spread Highlights
Issue Index Quote Data and Yield Notes
IFC.PR.A FixedReset Quote: 22.61 – 24.07
Spot Rate : 1.4600
Average : 0.8330

YTW SCENARIO
Maturity Type : Hard Maturity
Maturity Date : 2025-01-31
Maturity Price : 25.00
Evaluated at bid price : 22.61
Bid-YTW : 4.70 %

PWF.PR.T FixedReset Quote: 24.12 – 25.56
Spot Rate : 1.4400
Average : 0.9067

YTW SCENARIO
Maturity Type : Limit Maturity
Maturity Date : 2044-12-11
Maturity Price : 22.89
Evaluated at bid price : 24.12
Bid-YTW : 4.00 %

TD.PR.S FixedReset Quote: 25.23 – 26.35
Spot Rate : 1.1200
Average : 0.6319

YTW SCENARIO
Maturity Type : Hard Maturity
Maturity Date : 2022-01-31
Maturity Price : 25.00
Evaluated at bid price : 25.23
Bid-YTW : 3.15 %

BAM.PF.B FixedReset Quote: 24.30 – 24.92
Spot Rate : 0.6200
Average : 0.3781

YTW SCENARIO
Maturity Type : Limit Maturity
Maturity Date : 2044-12-11
Maturity Price : 22.96
Evaluated at bid price : 24.30
Bid-YTW : 4.14 %

MFC.PR.H FixedReset Quote: 25.27 – 25.94
Spot Rate : 0.6700
Average : 0.4360

YTW SCENARIO
Maturity Type : Call
Maturity Date : 2017-03-19
Maturity Price : 25.00
Evaluated at bid price : 25.27
Bid-YTW : 4.07 %

FTS.PR.K FixedReset Quote: 24.31 – 24.96
Spot Rate : 0.6500
Average : 0.4235

YTW SCENARIO
Maturity Type : Limit Maturity
Maturity Date : 2044-12-11
Maturity Price : 22.97
Evaluated at bid price : 24.31
Bid-YTW : 3.62 %

Market Action

December 10, 2014

The Boston Fed published a paper by Daniel Cooper and J. Christina Wang titled Student Loan Debt and Economic Outcomes:

This policy brief advances the growing literature on how student loan debt affects individuals’ other economic decisions. Specifically, it examines the impact of student loan liabilities on individuals’ homeownership status and wealth accumulation. The analysis employs a rich set of financial and demographic control variables that are not available in many of the existing studies that use credit bureau data. Overall, student debt lowers the likelihood of homeownership for a group of students who attended college during the 1990s. There is also a fairly strong negative correlation between student loan debt and wealth (excluding student loan debt) for a group of households with at least some college experience.

Indeed, student loan debt has now surpassed credit card debt to become the second largest amount of household debt outstanding after mortgage debt (see Figure 1). Unlike credit card debt and other household liabilities, however, student debt cannot be discharged in bankruptcy.

Consistent with the previous literature on socio-economic inequality in the United States, African Americans and Hispanics have substantially less wealth than Caucasians. This negative effect is largely reversed, however, among those minority homeowners with student loan debt outstanding. This result likely reflects the fact that, among minorities, those who pursued higher education—even if they had to borrow to do so—likely have greater earning power and can accumulate more assets while they are young than minorities who did not attend college.

They also published an interesting paper by Claire Greene and Scott Schuh titled U.S. Consumers’ Holdings and Use of $100 Bills:

Conventional wisdom asserts that $100 bills are often associated with crime and foreign cash holdings, leading some commentators to call for their elimination; in light of this view, it is useful to examine the legal, domestic use of cash. This report uses new data from the 2012 Diary of Consumer Payment Choice (DCPC) to evaluate consumer use of $100 bills as a means of payment. On a typical day in the United States, 5.2 percent of consumers have a $100 bill in their pocket, purse, or wallet. But only 22 percent of U.S. consumers have at least $100 in their wallet, pocket, or purse. Of these cash-intensive consumers, the main association with holding a $100 bill is the amount of cash carried. A consumer who carries $400 to $699 has a 64 percent probability of carrying at least one $100 bill.

Recently, Harvard economist Kenneth Rogoff called for the total elimination of $100 bills.4 According to Rogoff (2014), the evidence suggests that, in most countries, more than 50 percent of currency is used to facilitate anonymous transactions for tax evasion or other illegal activities.

The DCPC shows that consumers still use cash heavily as a means of payment. U.S. consumers age 18 and older carry an average of $56 on their person (pocket, purse, or wallet), and the median consumer carries $22. Cash is still the most common method of payment for consumers (40.3 percent of the number of payments per month), even though the dollar value of these payments is relatively low (14.2 percent of value per month) because the average cash payment is small ($20.73). Only 6.6 percent of reported cash payments by number of transactions (12.3 percent by value) were in categories that were not well defined or documented and, therefore, might be more likely to be associated with criminal or underground economic activity.

Over the last three decades, the value of 100s shipped by the Fed to depository institutions has increased dramatically relative to other denominations. This could be due in part to inflation, to the elimination of the larger denominations, and/or to an increase in demand for U.S. currency outside the United States. Hundreds represented just about 10 percent of the value of cash shipped in January 1974, compared with 45 percent in 2010.8 In 2013, the value of $100 bills in circulation was $925 billion—enough for every person in the United States (including children) to hold $3,000 in $100 bills.

On any given day in October 2012, 5.2 percent of U.S. consumers carried at least one $100 bill in their pocket, purse, or wallet (on person). This statistic is somewhat incomplete because only consumers carrying at least $100 of cash (total of all denominations) could be carrying a $100 bill. As shown in Figure 6, cash holdings on person by U.S. consumers are skewed toward values much less than $100: 78 percent of consumers carried $99 or less, including 28 percent who carried $19 or less. A small proportion of consumers carry the largest amounts of cash in value. Only 22 percent of U.S. consumers carried $100 or more; just 8 percent carried $200 or more. Therefore, it is necessary to ask who carries $100 before asking who carries a $100 bill.

Among consumers who carry $100 or more, about one in six (17.6 percent) carries at least one $100 bill. The probability of carrying a $100 bill rises as a consumer’s total cash on person increases, as shown in Figure 8. For consumers carrying between $400 and $699, the probability of carrying $100 bill is more than 60 percent. The probability jumps to 94 percent when cash holdings exceed $700. In addition, as cash on person increases, consumers carry more $100 bills (Figure 9).

If they are carrying at least $100 and all other factors are equal, women are more likely than men to carry a $100 bill or bills and people younger than 25 are more likely than people 25 years old or older to carry a $100 bill or bills. No other demographic characteristics are helpful in explaining the probability of holding a $100 bill by a consumer who carries at least $100.

Patricia L. Olasker and Mindy Gilbert of Davies Ward Phillips & Vineberg LLP have submitted a comment letter on the National Securities Regulator legislation:

The PCMA introduces numerous substantive changes from the current securities law of Ontario. These include:

  • •change to the long-standing and widely used definition of “misrepresentation”;
  • •the broadening of the insider trading prohibition to include conduct that stops short of a sale of a security and to include transactions in securities of non-reporting companies;
  • •change to the exception to the tipping prohibition;
  • •introduction of a novel fiduciary relationship between underwriters and their clients;
  • •unprecedented regulation of shareholders holding 20% or more of a public company as if they were “market participants”; and
  • •introduction of a novel “obstruction” prohibition prohibiting the withholding of information from the regulatory authority and potentially intruding on the solicitor/client relationship.


We are also concerned about the extent to which the PCMA takes a platform approach to legislation. Not only are entire areas of the law proposed to be addressed in regulations, but the legislation omits a number of well-established elements of securities law. We believe that fundamental established elements of the existing law should be enshrined in the legislation itself. The commentary accompanying the release of the draft legislation noted that the platform approach was intended to promote “regulatory flexibility allowing the Authority to respond to market developments in a timely manner”. Our concern with this is threefold:

  • 1.It allows for legislation by regulatory fiat with limited political accountability.
  • 2.It undermines one of the key features of a sound capital market − namely, stability and predictability in the legal and regulatory regime, which are essential to transaction planning. With vast sections of the law, including key cornerstone elements, being left to regulation, there is significant risk of instability in the law, with the potential for substantive changes to be effected through a process subject to no more discipline than a 90-day request for comments.
  • 3.We are sceptical of the premise that more regulatory flexibility is required than exists under the current regime. In fact, with the introduction of the federal Capital Markets Stability Act, which will allow the cooperative regulator to act to address systemic risks to the capital markets, one could argue that less rather than more regulatory flexibility is necessary at the PCMA level.

    This echoes many of the concerns raised by Jeffrey MacIntosh.

    And the BOC has published a paper by Gregory Bauer titled International House Price Cycles, Monetary Policy and Risk Premiums:

    Using a panel logit framework, the paper provides an estimate of the likelihood of a house price correction in 18 OECD countries. The analysis shows that a simple measure of the degree of house price overvaluation contains a lot of information about subsequent price reversals. Corrections are typically triggered by a sharp tightening in the monetary policy interest rate relative to a baseline level in each country. Two different assessments of the current and future baseline estimates of monetary policy interest rates are provided: a simple Taylor rule and one extracted from a term structure model. A case study based on the Canadian housing market is presented.

    In this paper, we construct a model to forecast house price corrections in the national housing markets of 18 OECD countries. We focus on large corrections: the (real) national house price index must decline by at least 10 per cent and the correction must last at least four quarters. There are 43 such corrections in our post-1975 sample, which highlights the advantage of an international data set. More importantly for policy-makers, the corrections appear to be triggered by increases in central bank policy rates.

    In theory, it should be possible to estimate the degree of house price overvaluation and the consequent likelihood of a correction using the data from a single country only. However, it will be di¢ cult to estimate the degree of overvaluation in a given country if the values of homes in the markets are already away from their fundamental values. Regressing one upward-trending series (such as real house prices) on another trending series (such as real per capita income) will always produce a coefficient that can justify most of the current level of valuation. The addition of many other countries, with housing market cycles that may be different from that of Canada, will impose more discipline on the estimation of such a coefficient.

    Figure 2 displays the real house price index in each country along with the periods that have been identified as corrections. The country with the highest number of corrections is Spain, at six corrections between 1975Q1 and 2014Q2. Denmark has experienced …five corrections over its history. Japan records the longest duration of a housing market correction at 61 quarters, or 15 years. Other notable countries with long correction durations are Spain (26 quarters), Germany (25 quarters), Italy (25 quarters) and Sweden (25 quarters).

    Canada’’s historical record shows two such corrections. Prices declined by a total of 30 per cent over a period of six quarters starting in 1981Q3, and by 17 per cent over a one-year period beginning in 1990Q2. For comparison, the United States also saw two housing market corrections. The first occurred in 2006Q4 and lasted seven quarters, and the second began in 2009Q1 and ended …five quarters later. During these two periods, the country experienced house price declines of 10 per cent and 14 per cent, respectively.

    The Canadian and other country average amounts of overvaluation are shown in Figure 3. The average amount of overvaluation across the other 17 OECD countries (black line) shows considerable variation over time, reaching approximately 15 per cent at the height of the latest boom period. Canadian house prices (red line) were considered to be “fairly” valued in 2004, but are now estimated to be overvalued by slightly over 20 per cent (as of 2014Q2). The interquartile range of the 18 country estimates (the 25th and 75th percentile of overvaluation at each point in time) is shown in dotted lines.

    There are a number of conclusions of interest to policy-makers. First, the relatively simple way of assessing house price overvaluation has good forecasting power for subsequent corrections. The variable is signifi…cant in all specifi…cations and at all horizons. Second, while the two methods of estimating the monetary policy stance of the central banks produce similar results, the method of extracting a global risk premium from the long-term interest rate has some advantages. The expectations component is forward looking and rises well in advance of the corrections. This may be quite useful to policy-makers today who face the zero lower bound on current policy rates while the long-term rates incorporate expectations of future rate increases.

    Third, there is a distinct forecast-horizon aspect to the results. Attempting to forecast a house price decline that is going to start in the next quarter is extremely difficult. The signals from this modelling approach are very weak and would be engulfed by the noise.

    The BoC warned of rising illiquidity in the Canadian corporate bond market:

    The Bank of Canada warned that investors in the nation’s corporate bond market may be underestimating the difficulty of selling the securities in a market downturn, putting them at risk of greater losses.

    Rising holdings of corporate bonds in mutual and exchange-traded funds could exacerbate price swings if the funds are forced to sell in a rout, the central bank said in its semi-annual Financial System Review. Some market participants also “believe” dealers are reducing market-making activity, or acting as the middleman between trades, which may make it harder to unwind large positions, the bank said.

    “A potential deterioration of liquidity in Canadian corporate bond markets may not be fully priced in,” according to the report. “Market trends suggest that more sizable price swings might be observed in the future than previously, should investors seek to simultaneously unwind large positions.”

    The greater role of ETFs and mutual funds in the market could cause “price dislocations” if investors cash out and funds are forced to sell underlying corporate bond holdings at lower prices, the report said.

    I’ll try to review the Review in a while.

    Update: The Financial System Review, December 2014 isn’t really all that interesting, although I may review their article on ETFs tomorrow. The Bloomberg story is a fair synopsis of what is said about corporate bonds on pp. 21-22 of the publication, except that the bank is concerned that rising holdings by foreigners could increase exposure to external shocks.

    And, oh yeah, there was a little bit of action in the equities market:

    Canadian stocks sank the most in 17 months, sending the benchmark gauge to the lowest level since February, as crude resumed a selloff after OPEC said demand will drop next year.

    Penn West Petroleum Ltd. and Crescent Point Energy Corp. plunged at least 9.8 percent as energy producers sank to a 2012 low. Laurentian Bank of Canada (LB) dropped 5.3 percent to pace declines among financial services stocks. All 10 main groups in the benchmark index lost at least 0.4 percent.

    The Standard & Poor’s/TSX Composite Index (SPTSX) fell 342.78 points, or 2.4 percent, to 13,852.95 at 4 p.m. in Toronto. The equity gauge has dropped 4.3 percent this week, paring its advance this year to 1.7 percent. Trading volume was 38 percent above the 30-day average.

    Oil, bank and raw-materials are the biggest laggards in Canada for the first time since at least 1988, fueling concern the nation’s economy is fading just as the U.S. is taking off. The three industries, which collectively account for two-thirds of the S&P/TSX, are the worst performers among 10 groups this year, led by a 18 percent slump in energy, according to data compiled by Bloomberg.

    Which is kind of tough news for preferred share investors who have tried to escape the downturn.

    badLuck
    Click for Big

    Technically, it was a mixed day for the Canadian preferred share market, with PerpetualDiscounts losing 92bp, FixedResets down 25bp and DeemedRetractibles squeaking out a gain of 3bp; PUT THAT GUN DOWN, IT WASN’T THAT BAD! The loss for PerpetualDiscounts is grossly overstated due to some more Toronto Stock Exchanges idiocy (either with respect to its market makers, or its reporting, I’m not sure which). About 60bp of the reported tumble in PerpetualDiscounts is due to an overstatement of the bad day experienced by FTS.PR.F; see the Performance Highlights table for an explanation. The Performance Highlights table is, again, dominated by lower-spread FixedResets and has a good contingent of credit-nervous ENB issues. Volume was average.

    PerpetualDiscounts now yield 5.14% (the mispricing of FTS.PR.H is not a disaster, since this is a median figure), equivalent to 6.68% interest at the standard conversion factor of 1.3x. Long corporates now yield about 4.05%, so the pre-tax interest-equivalent spread (in this context, the “Seniority Spread”) is now about 255bp, a significant increase from the 235bp reported November 26.

    For as long as the FixedReset market is so violently unsettled, I’ll keep publishing updates of the more interesting and meaningful series of FixedResets’ Implied Volatilities. This doesn’t include Enbridge because although Enbridge has a large number of issues outstanding, all of which are quite liquid, the range of Issue Reset Spreads is too small for decent conclusions. The low is 212bp (ENB.PR.H; second-lowest is ENB.PR.D at 237bp) and the high is a mere 268 for ENB.PF.G.

    Remember that all rich /cheap assessments are:

    • based on Implied Volatility Theory only
    • are relative only to other FixedResets from the same issuer
    • assume constant GOC-5 yield
    • assume constant Implied Volatility
    • assume constant spread

    Here’s TRP:

    impVol_TRP_141210
    Click for Big

    So according to this, TRP.PR.A, bid at 20.84, is $0.76 cheap, but it has already reset. TRP.PR.B, bid at 17.35, resetting 2015-6-30 and TRP.PR.C, bid at 19.01, resetting 2016-1-30 are both fairly priced. The TRP issues seem to be steadily rationalizing, but there continues to be pressure on TRP.PR.A.

    The MFC series continues to be weird.

    impVol_MFC_141210
    Click for Big

    Clearly MFC.PR.F, resetting at +141 on 2016-06-19, is out of step with the others and is screwing up the calculation. To the extent that one can trust both Implied Volatility Theory AND the market’s reasonably more-or-less consistent application of it, MFC.PR.F should be bid significantly higher than its current 19.75 and the calculated Implied Volatility should be higher than the distorted value of 14%. The fit is pretty poor – all one can really tell is that the Spread is more than about 80bp and the Implied Volatility is more than about 12%.

    impVol_MFC_141210_varSpread
    Click for Big
    impVol_MFC_141210_varVol
    Click for Big

    The BAM series is now also a little out of whack:

    impVol_BAM_141210
    Click for Big

    BAM.PR.X, with a +180bp spread, bid at 20.70, looks $0.80 cheap and doesn’t reset until 2017-6-30 while BAM.PR.R, with a +230bp spread, bid at 25.23, looks $1.36 rich and resets 2016-6-30. So go figure that one out, wise guy. As with the MFC series above, it seems that the extreme cheapness of the lowest-spread issue is materially distorting the calculation of Implied Volatility.

    impVol_FTS_141210
    Click for Big

    This is just weird because the middle is expensive and the ends are cheap but anyway … FTS.PR.H, with a spread of +145bp, and bid at 19.16, looks $0.71 cheap and resets 2015-6-1. FTS.PR.K, with a spread of +205bp, and bid at 24.62, looks $0.75 expensive and resets 2019-3-1

    impVol_BCE_141210
    Click for Big

    Oddly, the fit for BCE is pretty good, with the model having no problem fitting BCE.PR.K, resetting at +188bp on 2016-12-30, to the curve formed by the other BCE FixedResets.

    HIMIPref™ Preferred Indices
    These values reflect the December 2008 revision of the HIMIPref™ Indices

    Values are provisional and are finalized monthly
    Index Mean
    Current
    Yield
    (at bid)
    Median
    YTW
    Median
    Average
    Trading
    Value
    Median
    Mod Dur
    (YTW)
    Issues Day’s Perf. Index Value
    Ratchet 0.00 % 0.00 % 0 0.00 0 0.0711 % 2,525.0
    FixedFloater 0.00 % 0.00 % 0 0.00 0 0.0711 % 3,997.5
    Floater 2.99 % 3.11 % 61,290 19.38 4 0.0711 % 2,684.2
    OpRet 4.41 % -6.03 % 28,395 0.08 2 -0.0196 % 2,751.5
    SplitShare 4.30 % 4.02 % 38,826 3.73 5 -0.2087 % 3,171.9
    Interest-Bearing 0.00 % 0.00 % 0 0.00 0 -0.0196 % 2,515.9
    Perpetual-Premium 5.44 % -1.34 % 72,943 0.08 20 -0.0959 % 2,474.5
    Perpetual-Discount 5.24 % 5.14 % 111,527 15.23 15 -0.9199 % 2,615.3
    FixedReset 4.28 % 3.75 % 206,125 16.26 75 -0.2491 % 2,514.4
    Deemed-Retractible 5.00 % 1.75 % 101,180 0.14 40 0.0319 % 2,599.1
    FloatingReset 2.55 % 1.89 % 60,563 3.47 5 -0.2508 % 2,544.2
    Performance Highlights
    Issue Index Change Notes
    FTS.PR.F Perpetual-Discount -11.87 % The “Last” quote, sold to me by the Toronto Stock Exchange of 21.60-24.82 is nonsensical, since there were a number of tiny trades at 3:55pm at about 24.20 (thirteen, all of 100 shares, plus one 95-share odd-lot). The low for the day was 24.19. It is not clear whether this huge burst of market activity overwhelmed the market maker who ran home crying before the bell, or whether a bid was cancelled between the “Close” and the “Last” and I’m not going to spend time and money figuring it out either because, frankly, I’m sick of these clowns.
    YTW SCENARIO
    Maturity Type : Limit Maturity
    Maturity Date : 2044-12-10
    Maturity Price : 21.60
    Evaluated at bid price : 21.60
    Bid-YTW : 5.72 %
    FTS.PR.H FixedReset -3.33 % YTW SCENARIO
    Maturity Type : Limit Maturity
    Maturity Date : 2044-12-10
    Maturity Price : 19.16
    Evaluated at bid price : 19.16
    Bid-YTW : 3.83 %
    TRP.PR.C FixedReset -2.76 % YTW SCENARIO
    Maturity Type : Limit Maturity
    Maturity Date : 2044-12-10
    Maturity Price : 19.01
    Evaluated at bid price : 19.01
    Bid-YTW : 4.09 %
    TRP.PR.A FixedReset -2.48 % YTW SCENARIO
    Maturity Type : Limit Maturity
    Maturity Date : 2044-12-10
    Maturity Price : 20.84
    Evaluated at bid price : 20.84
    Bid-YTW : 4.06 %
    ENB.PF.C FixedReset -2.38 % YTW SCENARIO
    Maturity Type : Limit Maturity
    Maturity Date : 2044-12-10
    Maturity Price : 22.46
    Evaluated at bid price : 23.36
    Bid-YTW : 4.44 %
    ENB.PF.E FixedReset -2.05 % YTW SCENARIO
    Maturity Type : Limit Maturity
    Maturity Date : 2044-12-10
    Maturity Price : 22.47
    Evaluated at bid price : 23.41
    Bid-YTW : 4.44 %
    ENB.PR.N FixedReset -1.86 % YTW SCENARIO
    Maturity Type : Limit Maturity
    Maturity Date : 2044-12-10
    Maturity Price : 22.43
    Evaluated at bid price : 23.16
    Bid-YTW : 4.38 %
    FTS.PR.J Perpetual-Discount -1.48 % YTW SCENARIO
    Maturity Type : Limit Maturity
    Maturity Date : 2044-12-10
    Maturity Price : 23.62
    Evaluated at bid price : 24.00
    Bid-YTW : 4.96 %
    ENB.PF.A FixedReset -1.42 % YTW SCENARIO
    Maturity Type : Limit Maturity
    Maturity Date : 2044-12-10
    Maturity Price : 22.57
    Evaluated at bid price : 23.56
    Bid-YTW : 4.40 %
    ENB.PF.G FixedReset -1.26 % YTW SCENARIO
    Maturity Type : Limit Maturity
    Maturity Date : 2044-12-10
    Maturity Price : 22.54
    Evaluated at bid price : 23.56
    Bid-YTW : 4.43 %
    MFC.PR.F FixedReset -1.25 % YTW SCENARIO
    Maturity Type : Hard Maturity
    Maturity Date : 2025-01-31
    Maturity Price : 25.00
    Evaluated at bid price : 19.75
    Bid-YTW : 5.87 %
    SLF.PR.G FixedReset -1.22 % YTW SCENARIO
    Maturity Type : Hard Maturity
    Maturity Date : 2025-01-31
    Maturity Price : 25.00
    Evaluated at bid price : 19.51
    Bid-YTW : 5.81 %
    BNS.PR.Z FixedReset -1.18 % YTW SCENARIO
    Maturity Type : Hard Maturity
    Maturity Date : 2022-01-31
    Maturity Price : 25.00
    Evaluated at bid price : 24.37
    Bid-YTW : 3.42 %
    BAM.PR.X FixedReset -1.00 % YTW SCENARIO
    Maturity Type : Limit Maturity
    Maturity Date : 2044-12-10
    Maturity Price : 20.70
    Evaluated at bid price : 20.70
    Bid-YTW : 4.22 %
    MFC.PR.B Deemed-Retractible 1.13 % YTW SCENARIO
    Maturity Type : Hard Maturity
    Maturity Date : 2025-01-31
    Maturity Price : 25.00
    Evaluated at bid price : 23.26
    Bid-YTW : 5.58 %
    GWO.PR.N FixedReset 1.29 % YTW SCENARIO
    Maturity Type : Hard Maturity
    Maturity Date : 2025-01-31
    Maturity Price : 25.00
    Evaluated at bid price : 19.61
    Bid-YTW : 5.66 %
    MFC.PR.L FixedReset 3.91 % YTW SCENARIO
    Maturity Type : Hard Maturity
    Maturity Date : 2025-01-31
    Maturity Price : 25.00
    Evaluated at bid price : 25.00
    Bid-YTW : 3.75 %
    Volume Highlights
    Issue Index Shares
    Traded
    Notes
    ENB.PF.C FixedReset 180,591 Nesbitt sold 10,700 to RBC at 23.89 and crossed 146,700 at 23.50.
    YTW SCENARIO
    Maturity Type : Limit Maturity
    Maturity Date : 2044-12-10
    Maturity Price : 22.46
    Evaluated at bid price : 23.36
    Bid-YTW : 4.44 %
    BAM.PR.X FixedReset 105,958 Nesbitt crossed 94,700 at 20.85.
    YTW SCENARIO
    Maturity Type : Limit Maturity
    Maturity Date : 2044-12-10
    Maturity Price : 20.70
    Evaluated at bid price : 20.70
    Bid-YTW : 4.22 %
    TRP.PR.A FixedReset 94,514 Will reset at 3.266% effective December 31.
    YTW SCENARIO
    Maturity Type : Limit Maturity
    Maturity Date : 2044-12-10
    Maturity Price : 20.84
    Evaluated at bid price : 20.84
    Bid-YTW : 4.06 %
    HSE.PR.C FixedReset 79,500 Recent new issue.
    YTW SCENARIO
    Maturity Type : Limit Maturity
    Maturity Date : 2044-12-10
    Maturity Price : 23.15
    Evaluated at bid price : 24.98
    Bid-YTW : 4.47 %
    ENB.PR.A Perpetual-Premium 65,438 Scotia bought two blocks from Nesbitt, of 26,000 and 20,000, both at 25.50.
    YTW SCENARIO
    Maturity Type : Call
    Maturity Date : 2015-01-09
    Maturity Price : 25.00
    Evaluated at bid price : 25.25
    Bid-YTW : -4.93 %
    ENB.PR.D FixedReset 59,120 Nesbitt crossed 40,000 at 23.00.
    YTW SCENARIO
    Maturity Type : Limit Maturity
    Maturity Date : 2044-12-10
    Maturity Price : 22.31
    Evaluated at bid price : 22.83
    Bid-YTW : 4.21 %
    There were 33 other index-included issues trading in excess of 10,000 shares.
    Wide Spread Highlights
    Issue Index Quote Data and Yield Notes
    FTS.PR.F Perpetual-Discount Quote: 21.60 – 24.80
    Spot Rate : 3.2000
    Average : 1.7894

    YTW SCENARIO
    Maturity Type : Limit Maturity
    Maturity Date : 2044-12-10
    Maturity Price : 21.60
    Evaluated at bid price : 21.60
    Bid-YTW : 5.72 %

    HSE.PR.A FixedReset Quote: 19.41 – 20.21
    Spot Rate : 0.8000
    Average : 0.5156

    YTW SCENARIO
    Maturity Type : Limit Maturity
    Maturity Date : 2044-12-10
    Maturity Price : 19.41
    Evaluated at bid price : 19.41
    Bid-YTW : 4.20 %

    FTS.PR.H FixedReset Quote: 19.16 – 19.74
    Spot Rate : 0.5800
    Average : 0.3744

    YTW SCENARIO
    Maturity Type : Limit Maturity
    Maturity Date : 2044-12-10
    Maturity Price : 19.16
    Evaluated at bid price : 19.16
    Bid-YTW : 3.83 %

    MFC.PR.G FixedReset Quote: 25.60 – 26.10
    Spot Rate : 0.5000
    Average : 0.3390

    YTW SCENARIO
    Maturity Type : Call
    Maturity Date : 2016-12-19
    Maturity Price : 25.00
    Evaluated at bid price : 25.60
    Bid-YTW : 3.13 %

    NEW.PR.D SplitShare Quote: 32.51 – 33.23
    Spot Rate : 0.7200
    Average : 0.5696

    YTW SCENARIO
    Maturity Type : Call
    Maturity Date : 2015-06-26
    Maturity Price : 32.07
    Evaluated at bid price : 32.51
    Bid-YTW : 3.22 %

    FTS.PR.J Perpetual-Discount Quote: 24.00 – 24.50
    Spot Rate : 0.5000
    Average : 0.3510

    YTW SCENARIO
    Maturity Type : Limit Maturity
    Maturity Date : 2044-12-10
    Maturity Price : 23.62
    Evaluated at bid price : 24.00
    Bid-YTW : 4.96 %

    Market Action

    December 9, 2014

    Securities market participants will be gratified to learn that the tradition of administrative efficiency in Canadian securities regulation will be continued by the national securities regulator:

    Canada’s new securities regulator is facing another delay on the bumpy road to its launch in 2015.

    The group of participating provinces announced Friday that the regulations to outline the operating details of the new Cooperative Capital Markets Regulator will now be delayed until early spring and will not be out by Dec. 19, as previously anticipated.

    Greek markets are beginning to resemble Canadian ones:

    Greek stocks suffered their steepest daily fall in more than a quarter century on Tuesday and its bond yields jumped after Prime Minister Antonis Samaras brought forward a presidential election in a gamble over his, and the country’s future.

    If Mr. Samaras fails to secure victory in parliament for his presidential candidate, snap national elections will be called that the leftist Syriza party – a fierce opponent of Greece’s bailout deal with the European Union and IMF – is likely to win.

    The Athens general stock index tumbled 12.8 pe rcent, its biggest loss in a day since 1987. An index of Greece’s listed banks fell 14.7 per cent, with Attica Bank down 27.5 per cent.

    The decision sent 10-year Greek government bond yields up 74 basis points to 8.09 per cent.

    Canadian preferred share investors are currently looking for indicators to guide them through current market turmoil:

    imagesQWLPGS53

    The Canadian preferred share market took another good whacking today, with PerpetualDiscounts losing 41bp, FixedResets down 39bp and DeemedRetractibles off 20bp. The performance highlights table contains its usual lengthy list of FixedReset losers, but it is of interest to note that a large number of the credit-uncertain Enbridge issues were included. Volume was above average.

    For as long as the FixedReset market is so violently unsettled, I’ll keep publishing updates of the more interesting and meaningful series of FixedResets’ Implied Volatilities. This doesn’t include Enbridge because although Enbridge has a large number of issues outstanding, all of which are quite liquid, the range of Issue Reset Spreads is too small for decent conclusions. The low is 212bp (ENB.PR.H; second-lowest is ENB.PR.D at 237bp) and the high is a mere 268 for ENB.PF.G.

    Remember that all rich /cheap assessments are
    » based on Implied Volatility Theory only
    » are relative only to other FixedResets from the same issuer
    » assume constant GOC-5 yield
    » assume constant Implied Volatility
    » assume constant spread

    Here’s TRP:
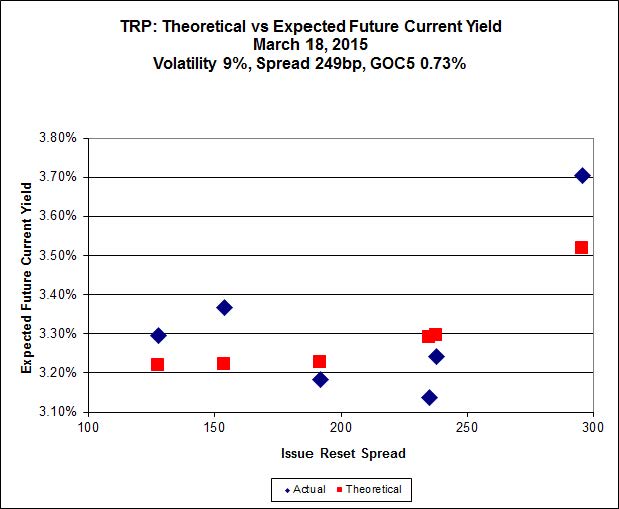
    ImpVol_TRP_141209
    Click for Big

    So according to this, TRP.PR.A, bid at 21.37, is $0.44 cheap, but it has already reset. TRP.PR.B, bid at 17.46, is $0.18 cheap, but it resets 2015-6-30. TRP.PR.C, bid at 19.55, is $0.21 expensive, but it resets 2016-1-30. The TRP issues seem to be steadily rationalizing.

    The MFC series is just weird.

    ImpVol_MFC_141209
    Click for Big

    Clearly MFC.PR.F, resetting at +141 on 2016-06-19, is out of step with the others and is screwing up the calculation. To the extent that one can trust both Implied Volatility Theory AND the market’s reasonably more-or-less consistent application of it, MFC.PR.F should be bid significantly higher than its current 20.00 and the calculated Implied Volatility should be higher than the distorted value of 28%. The fit is pretty poor – all one can really tell is that the Spread is more than about 80bp and the Implied Volatility is more than about 13%.

    ImpVol_MFC_varSpread_141209

    Click for Big
    ImpVol_MFC_varVol_141209
    Click for Big

    The BAM series is now also a little out of whack:

    ImpVol_BAM_141209
    Click for Big

    BAM.PR.X, with a +180bp spread, bid at 20.91, looks $0.68 cheap and doesn’t reset until 2017-6-30 – but Implied Volatility continues to drop rapidly (a reduction in Implied Volatility flattens the curve and causes low-spread issues to underperform). BAM.PR.R, with a +230bp spread, bid at 25.34, looks $1.43 rich and resets 2016-6-30. So go figure that one out, wise guy.

    ImpVol_FTS_141209

    This is just weird because the middle is expensive and the ends are cheap but anyway … FTS.PR.H, with a spread of +145bp, and bid at 19.82, looks $0.35 cheap and resets 2015-6-1. FTS.PR.K, with a spread of +205bp, and bid at 24.62, looks $0.53 expensive and resets 2019-3-1

    HIMIPref™ Preferred Indices
    These values reflect the December 2008 revision of the HIMIPref™ Indices

    Values are provisional and are finalized monthly
    Index Mean
    Current
    Yield
    (at bid)
    Median
    YTW
    Median
    Average
    Trading
    Value
    Median
    Mod Dur
    (YTW)
    Issues Day’s Perf. Index Value
    Ratchet 0.00 % 0.00 % 0 0.00 0 -0.2129 % 2,523.2
    FixedFloater 0.00 % 0.00 % 0 0.00 0 -0.2129 % 3,994.7
    Floater 2.99 % 3.11 % 62,134 19.38 4 -0.2129 % 2,682.3
    OpRet 4.41 % -6.18 % 28,767 0.08 2 -0.2345 % 2,752.0
    SplitShare 4.29 % 4.01 % 39,096 3.73 5 0.0202 % 3,178.5
    Interest-Bearing 0.00 % 0.00 % 0 0.00 0 -0.2345 % 2,516.4
    Perpetual-Premium 5.44 % -1.52 % 72,150 0.09 20 0.0196 % 2,476.9
    Perpetual-Discount 5.19 % 5.12 % 112,430 15.22 15 -0.4110 % 2,639.6
    FixedReset 4.27 % 3.74 % 199,857 16.40 75 -0.3933 % 2,520.7
    Deemed-Retractible 5.00 % 1.77 % 102,744 0.21 40 -0.2029 % 2,598.2
    FloatingReset 2.54 % 1.89 % 60,996 3.47 5 0.0000 % 2,550.6
    Performance Highlights
    Issue Index Change Notes
    MFC.PR.L FixedReset -3.99 % YTW SCENARIO
    Maturity Type : Hard Maturity
    Maturity Date : 2025-01-31
    Maturity Price : 25.00
    Evaluated at bid price : 24.06
    Bid-YTW : 4.22 %
    MFC.PR.F FixedReset -3.61 % YTW SCENARIO
    Maturity Type : Hard Maturity
    Maturity Date : 2025-01-31
    Maturity Price : 25.00
    Evaluated at bid price : 20.00
    Bid-YTW : 5.72 %
    ENB.PR.H FixedReset -3.18 % YTW SCENARIO
    Maturity Type : Limit Maturity
    Maturity Date : 2044-12-09
    Maturity Price : 20.68
    Evaluated at bid price : 20.68
    Bid-YTW : 4.45 %
    ENB.PF.C FixedReset -2.09 % YTW SCENARIO
    Maturity Type : Limit Maturity
    Maturity Date : 2044-12-09
    Maturity Price : 22.73
    Evaluated at bid price : 23.93
    Bid-YTW : 4.31 %
    ENB.PR.Y FixedReset -2.05 % YTW SCENARIO
    Maturity Type : Limit Maturity
    Maturity Date : 2044-12-09
    Maturity Price : 21.65
    Evaluated at bid price : 22.00
    Bid-YTW : 4.40 %
    ENB.PF.G FixedReset -2.01 % YTW SCENARIO
    Maturity Type : Limit Maturity
    Maturity Date : 2044-12-09
    Maturity Price : 22.68
    Evaluated at bid price : 23.86
    Bid-YTW : 4.36 %
    ENB.PF.A FixedReset -1.85 % YTW SCENARIO
    Maturity Type : Limit Maturity
    Maturity Date : 2044-12-09
    Maturity Price : 22.73
    Evaluated at bid price : 23.90
    Bid-YTW : 4.33 %
    ENB.PF.E FixedReset -1.69 % YTW SCENARIO
    Maturity Type : Limit Maturity
    Maturity Date : 2044-12-09
    Maturity Price : 22.71
    Evaluated at bid price : 23.90
    Bid-YTW : 4.33 %
    ENB.PR.F FixedReset -1.48 % YTW SCENARIO
    Maturity Type : Limit Maturity
    Maturity Date : 2044-12-09
    Maturity Price : 22.53
    Evaluated at bid price : 23.25
    Bid-YTW : 4.24 %
    ENB.PR.P FixedReset -1.38 % YTW SCENARIO
    Maturity Type : Limit Maturity
    Maturity Date : 2044-12-09
    Maturity Price : 22.21
    Evaluated at bid price : 22.80
    Bid-YTW : 4.33 %
    MFC.PR.B Deemed-Retractible -1.37 % YTW SCENARIO
    Maturity Type : Hard Maturity
    Maturity Date : 2025-01-31
    Maturity Price : 25.00
    Evaluated at bid price : 23.00
    Bid-YTW : 5.72 %
    CU.PR.C FixedReset -1.36 % YTW SCENARIO
    Maturity Type : Call
    Maturity Date : 2017-06-01
    Maturity Price : 25.00
    Evaluated at bid price : 25.30
    Bid-YTW : 3.55 %
    BAM.PR.R FixedReset -1.36 % YTW SCENARIO
    Maturity Type : Limit Maturity
    Maturity Date : 2044-12-09
    Maturity Price : 23.83
    Evaluated at bid price : 25.34
    Bid-YTW : 3.79 %
    CU.PR.D Perpetual-Discount -1.36 % YTW SCENARIO
    Maturity Type : Limit Maturity
    Maturity Date : 2044-12-09
    Maturity Price : 23.61
    Evaluated at bid price : 24.00
    Bid-YTW : 5.12 %
    GWO.PR.I Deemed-Retractible -1.35 % YTW SCENARIO
    Maturity Type : Hard Maturity
    Maturity Date : 2025-01-31
    Maturity Price : 25.00
    Evaluated at bid price : 22.69
    Bid-YTW : 5.71 %
    BAM.PR.X FixedReset -1.32 % YTW SCENARIO
    Maturity Type : Limit Maturity
    Maturity Date : 2044-12-09
    Maturity Price : 20.91
    Evaluated at bid price : 20.91
    Bid-YTW : 4.18 %
    TRP.PR.C FixedReset -1.26 % YTW SCENARIO
    Maturity Type : Limit Maturity
    Maturity Date : 2044-12-09
    Maturity Price : 19.55
    Evaluated at bid price : 19.55
    Bid-YTW : 3.97 %
    SLF.PR.B Deemed-Retractible -1.20 % YTW SCENARIO
    Maturity Type : Hard Maturity
    Maturity Date : 2025-01-31
    Maturity Price : 25.00
    Evaluated at bid price : 23.92
    Bid-YTW : 5.35 %
    ENB.PR.J FixedReset -1.17 % YTW SCENARIO
    Maturity Type : Limit Maturity
    Maturity Date : 2044-12-09
    Maturity Price : 22.71
    Evaluated at bid price : 23.74
    Bid-YTW : 4.28 %
    ENB.PR.N FixedReset -1.13 % YTW SCENARIO
    Maturity Type : Limit Maturity
    Maturity Date : 2044-12-09
    Maturity Price : 22.67
    Evaluated at bid price : 23.60
    Bid-YTW : 4.28 %
    CU.PR.E Perpetual-Discount -1.07 % YTW SCENARIO
    Maturity Type : Limit Maturity
    Maturity Date : 2044-12-09
    Maturity Price : 23.61
    Evaluated at bid price : 24.00
    Bid-YTW : 5.12 %
    SLF.PR.D Deemed-Retractible -1.01 % YTW SCENARIO
    Maturity Type : Hard Maturity
    Maturity Date : 2025-01-31
    Maturity Price : 25.00
    Evaluated at bid price : 22.60
    Bid-YTW : 5.71 %
    CGI.PR.D SplitShare 1.09 % YTW SCENARIO
    Maturity Type : Soft Maturity
    Maturity Date : 2023-06-14
    Maturity Price : 25.00
    Evaluated at bid price : 25.09
    Bid-YTW : 3.71 %
    MFC.PR.M FixedReset 1.37 % YTW SCENARIO
    Maturity Type : Call
    Maturity Date : 2019-12-19
    Maturity Price : 25.00
    Evaluated at bid price : 25.15
    Bid-YTW : 3.76 %
    TRP.PR.B FixedReset 1.51 % YTW SCENARIO
    Maturity Type : Limit Maturity
    Maturity Date : 2044-12-09
    Maturity Price : 17.46
    Evaluated at bid price : 17.46
    Bid-YTW : 3.95 %
    SLF.PR.G FixedReset 3.40 % YTW SCENARIO
    Maturity Type : Hard Maturity
    Maturity Date : 2025-01-31
    Maturity Price : 25.00
    Evaluated at bid price : 19.75
    Bid-YTW : 5.66 %
    Volume Highlights
    Issue Index Shares
    Traded
    Notes
    HSE.PR.C FixedReset 619,946 New issue settled today.
    YTW SCENARIO
    Maturity Type : Limit Maturity
    Maturity Date : 2044-12-09
    Maturity Price : 23.16
    Evaluated at bid price : 25.01
    Bid-YTW : 4.46 %
    BMO.PR.P FixedReset 133,054 YTW SCENARIO
    Maturity Type : Call
    Maturity Date : 2015-02-25
    Maturity Price : 25.00
    Evaluated at bid price : 25.32
    Bid-YTW : 0.37 %
    IAG.PR.E Deemed-Retractible 125,050 YTW SCENARIO
    Maturity Type : Call
    Maturity Date : 2015-01-30
    Maturity Price : 26.00
    Evaluated at bid price : 25.97
    Bid-YTW : 4.17 %
    TRP.PR.A FixedReset 113,648 YTW SCENARIO
    Maturity Type : Limit Maturity
    Maturity Date : 2044-12-09
    Maturity Price : 21.37
    Evaluated at bid price : 21.37
    Bid-YTW : 3.95 %
    ENB.PR.D FixedReset 83,910 YTW SCENARIO
    Maturity Type : Limit Maturity
    Maturity Date : 2044-12-09
    Maturity Price : 22.41
    Evaluated at bid price : 23.00
    Bid-YTW : 4.17 %
    TD.PF.B FixedReset 77,745 YTW SCENARIO
    Maturity Type : Limit Maturity
    Maturity Date : 2044-12-09
    Maturity Price : 23.21
    Evaluated at bid price : 25.07
    Bid-YTW : 3.63 %
    There were 39 other index-included issues trading in excess of 10,000 shares.
    Wide Spread Highlights
    Issue Index Quote Data and Yield Notes
    MFC.PR.L FixedReset Quote: 24.06 – 25.06
    Spot Rate : 1.0000
    Average : 0.5532

    YTW SCENARIO
    Maturity Type : Hard Maturity
    Maturity Date : 2025-01-31
    Maturity Price : 25.00
    Evaluated at bid price : 24.06
    Bid-YTW : 4.22 %

    PVS.PR.C SplitShare Quote: 25.61 – 26.83
    Spot Rate : 1.2200
    Average : 0.8660

    YTW SCENARIO
    Maturity Type : Hard Maturity
    Maturity Date : 2017-12-10
    Maturity Price : 25.00
    Evaluated at bid price : 25.61
    Bid-YTW : 4.01 %

    ELF.PR.H Perpetual-Premium Quote: 25.35 – 26.00
    Spot Rate : 0.6500
    Average : 0.4410

    YTW SCENARIO
    Maturity Type : Limit Maturity
    Maturity Date : 2044-12-09
    Maturity Price : 24.88
    Evaluated at bid price : 25.35
    Bid-YTW : 5.49 %

    GWO.PR.N FixedReset Quote: 19.36 – 19.99
    Spot Rate : 0.6300
    Average : 0.4257

    YTW SCENARIO
    Maturity Type : Hard Maturity
    Maturity Date : 2025-01-31
    Maturity Price : 25.00
    Evaluated at bid price : 19.36
    Bid-YTW : 5.81 %

    TRP.PR.C FixedReset Quote: 19.55 – 20.14
    Spot Rate : 0.5900
    Average : 0.4054

    YTW SCENARIO
    Maturity Type : Limit Maturity
    Maturity Date : 2044-12-09
    Maturity Price : 19.55
    Evaluated at bid price : 19.55
    Bid-YTW : 3.97 %

    TRP.PR.D FixedReset Quote: 24.90 – 25.34
    Spot Rate : 0.4400
    Average : 0.2816

    YTW SCENARIO
    Maturity Type : Limit Maturity
    Maturity Date : 2044-12-09
    Maturity Price : 23.18
    Evaluated at bid price : 24.90
    Bid-YTW : 3.80 %

    Market Action

    December 8, 2014

    Assiduous Reader JP, who often sends me interesting snippets, unlike youse other bums, brings to my attention a small preferred share issue from China:

    Industrial and Commercial Bank of China will issue US$5.7 billion worth of preferred shares in three currencies in what will be the largest offshore issuance of hybrid securities from a mainland firm.

    ICBC proposed issuing US$2.94 billion in dollar-denominated shares, €600 million (HK$5.73 billion) and 12 billion yuan (HK$15.13 billion) all priced at 6 per cent, according to a regulatory filing.

    The shares will count as additional tier-1 capital, boosting the bank’s capital adequacy ratio as defined by Basel III, an international accord aimed at raising the viability of banks and avoiding public bailouts.

    The record deal also marked the first time a mainland bank issued offshore preferred shares denominated in three currencies.

    ICBC International was the sole global coordinator and UBS, Bank of America Merrill Lynch and Goldman Sachs were joint book-runners on the deal.

    It’s nice to see some real progress on solar power efficiency:

    UNSW’s solar researchers have converted over 40% of the sunlight hitting a solar system into electricity, the highest efficiency ever reported.

    The world-beating efficiency was achieved in outdoor tests in Sydney, before being independently confirmed by the National Renewable Energy Laboratory (NREL) at their outdoor test facility in the United States.

    The work was funded by the Australian Renewable Energy Agency (ARENA) and supported by the Australia–US Institute for Advanced Photovoltaics (AUSIAPV).

    “This is the highest efficiency ever reported for sunlight conversion into electricity,” UNSW Scientia Professor and Director of the Australian Centre for Advanced Photovoltaics (ACAP) Professor Martin Green said.

    The price wasn’t mentioned, but the basic idea comes first, right? Then give it to the engineers to make it cheap. Too bad this research wasn’t done in Ontari-ari-ari-owe, but we blew our solar budget on political grandstanding.

    After posting the MAPF November statements, I posted the following on the Canada Post Facebook Page:

    I just sent a batch of letters with Madonna & Child stamps when a thought struck me and caused me to check your website.

    I see your “Holiday 2014” collection is dominated by Santa Claus – rather childish in my view, but the important thing is that they are stamps and you stick them on letters and they get delivered.

    But why are there no stamps with an Islamic theme? No Jewish stamps? No stamps for Kwanzai, Bohdi Day, Pancha Ganapati or Yule? It would make things more interesting.

    It was an awful day for equities:

    Oil, bank and raw-materials are the biggest laggards in Canada for the first time since at least 1988, fueling concern the nation’s economy is fading just as the U.S. is taking off.

    The three industries, which collectively account for two-thirds of the Standard & Poor’s/TSX Composite Index, are the worst performers among 10 groups this year, according to data compiled by Bloomberg. The nation’s largest banks joined oil and materials in a rout that erased 4.1 percent from the benchmark index in three days, including the biggest one-day retreat since June 2013.

    The selloff in the biggest pillars of the Canadian equity market comes as data showing a weaker jobs market coupled with slowing exports suggest a tentative economic recovery. Banks have slumped as earnings last week collectively missed estimates amid declining trading revenue and sluggish consumer borrowing. Meanwhile, the S&P 500 Index has reached all-time highs on signs of accelerating growth.

    The S&P 500/TSX tumbled 329.53 points, or 2.3 percent, to 14,144.17 yesterday as the selloff in oil accelerated, with energy companies plunging the most since August 2011 as crude dropped to a five-year low.

    The Canadian benchmark equity gauge has plunged 9.7 percent since reaching a record on Sept. 3, wiping out more than C$270 billion in market value and reducing its gain for the year to 3.8 percent. The S&P/TSX, which was the second-best performing market among developed nations through the first half of the year, now ranks 16th.

    Happy crowds of preferred share investors held parades for their portfolios today.

    funeralProcession
    Click for Big

    And with TXPR and TXPL down 0.76% and 0.96%, why not?

    It was an appallingly poor day for the Canadian preferred share market, with PerpetualDiscounts off 24bp, FixedResets losing 85bp and DeemedRetractibles down 36bp. There is a very lengthy list of losers, dominated by FixedResets. Volume was high.

    And given these massive changes, let’s have another look at some pictures of Implied Volatility. Remember that all rich /cheap assessments are

    • based on Implied Volatility Theory only
    • are relative only to other FixedResets from the same issuer
    • assume constant GOC-5 yield
    • assume constant Implied Volatility
    • assume constant spread

    Here’s TRP:

    ImpVol_TRP_141208A
    Click for Big

    So according to this, TRP.PR.A, bid at 21.36, is $0.57 cheap, but it has already reset. TRP.PR.B, bid at 17.20, is $0.55 cheap, but it resets 2015-6-30. TRP.PR.C, bid at 19.75, is $0.30 expensive, but it resets 2016-1-30. It looks like the market is beginning to realize that TRP.PR.C is overpriced.

    ImpVol_MFC_141208
    Click for Big

    MFC implied volatility is still very high. The low-spread MFC.PR.F looks a little cheap … and it doesn’t reset until 2016-6-19.

    ImpVol_BAM_141208
    Click for Big

    BAM.PR.X, with a +180bp spread, bid at 21.15, looks $0.79 cheap and doesn’t reset until 2017-6-30 – but Implied Volatility is still a little high and is dropping rapidly (a reduction in Implied Volatility flattens the curve and causes low-spread issues to underperform). BAM.PR.R, with a +230bp spread, bid at 25.51, looks $1.56 rich and resets 2016-6-30. So go figure that one out, wise guy.

    ImpVol_FTS_141208
    Click for Big

    This is just weird because the middle is expensive and the ends are cheap but anyway … FTS.PR.H, with a spread of +145bp, and bid at 20.00, looks $0.41 cheap and resets 2015-6-1. FTS.PR.K, with a spread of +205bp, and bid at 24.70, looks $0.54 expensive and resets 2019-3-1

    HIMIPref™ Preferred Indices
    These values reflect the December 2008 revision of the HIMIPref™ Indices

    Values are provisional and are finalized monthly
    Index Mean
    Current
    Yield
    (at bid)
    Median
    YTW
    Median
    Average
    Trading
    Value
    Median
    Mod Dur
    (YTW)
    Issues Day’s Perf. Index Value
    Ratchet 0.00 % 0.00 % 0 0.00 0 -0.3254 % 2,528.6
    FixedFloater 0.00 % 0.00 % 0 0.00 0 -0.3254 % 4,003.2
    Floater 2.98 % 3.09 % 62,509 19.42 4 -0.3254 % 2,688.0
    OpRet 4.40 % -11.74 % 26,639 0.08 2 -0.0195 % 2,758.5
    SplitShare 4.30 % 3.92 % 40,711 3.73 5 -0.2697 % 3,177.9
    Interest-Bearing 0.00 % 0.00 % 0 0.00 0 -0.0195 % 2,522.4
    Perpetual-Premium 5.44 % -1.70 % 70,645 0.08 20 -0.4542 % 2,476.4
    Perpetual-Discount 5.17 % 5.11 % 113,618 15.27 15 -0.2392 % 2,650.5
    FixedReset 4.25 % 3.71 % 182,150 16.54 74 -0.8512 % 2,530.6
    Deemed-Retractible 4.99 % 0.67 % 103,056 0.14 40 -0.3755 % 2,603.5
    FloatingReset 2.54 % 1.89 % 60,065 0.08 5 -0.0861 % 2,550.6
    Performance Highlights
    Issue Index Change Notes
    TRP.PR.C FixedReset -3.51 % YTW SCENARIO
    Maturity Type : Limit Maturity
    Maturity Date : 2044-12-08
    Maturity Price : 19.80
    Evaluated at bid price : 19.80
    Bid-YTW : 3.92 %
    ENB.PR.T FixedReset -3.49 % YTW SCENARIO
    Maturity Type : Limit Maturity
    Maturity Date : 2044-12-08
    Maturity Price : 22.28
    Evaluated at bid price : 22.95
    Bid-YTW : 4.30 %
    PWF.PR.P FixedReset -3.36 % YTW SCENARIO
    Maturity Type : Limit Maturity
    Maturity Date : 2044-12-08
    Maturity Price : 20.40
    Evaluated at bid price : 20.40
    Bid-YTW : 3.87 %
    MFC.PR.F FixedReset -3.35 % YTW SCENARIO
    Maturity Type : Hard Maturity
    Maturity Date : 2025-01-31
    Maturity Price : 25.00
    Evaluated at bid price : 20.75
    Bid-YTW : 5.27 %
    SLF.PR.G FixedReset -3.05 % YTW SCENARIO
    Maturity Type : Hard Maturity
    Maturity Date : 2025-01-31
    Maturity Price : 25.00
    Evaluated at bid price : 19.10
    Bid-YTW : 6.06 %
    ENB.PR.P FixedReset -2.49 % YTW SCENARIO
    Maturity Type : Limit Maturity
    Maturity Date : 2044-12-08
    Maturity Price : 22.39
    Evaluated at bid price : 23.12
    Bid-YTW : 4.26 %
    MFC.PR.I FixedReset -2.38 % YTW SCENARIO
    Maturity Type : Call
    Maturity Date : 2017-09-19
    Maturity Price : 25.00
    Evaluated at bid price : 25.42
    Bid-YTW : 3.73 %
    GWO.PR.N FixedReset -2.37 % YTW SCENARIO
    Maturity Type : Hard Maturity
    Maturity Date : 2025-01-31
    Maturity Price : 25.00
    Evaluated at bid price : 19.33
    Bid-YTW : 5.83 %
    HSE.PR.A FixedReset -2.27 % YTW SCENARIO
    Maturity Type : Limit Maturity
    Maturity Date : 2044-12-08
    Maturity Price : 19.35
    Evaluated at bid price : 19.35
    Bid-YTW : 4.21 %
    ENB.PR.J FixedReset -2.16 % YTW SCENARIO
    Maturity Type : Limit Maturity
    Maturity Date : 2044-12-08
    Maturity Price : 22.84
    Evaluated at bid price : 24.02
    Bid-YTW : 4.21 %
    ENB.PR.F FixedReset -1.87 % YTW SCENARIO
    Maturity Type : Limit Maturity
    Maturity Date : 2044-12-08
    Maturity Price : 22.72
    Evaluated at bid price : 23.60
    Bid-YTW : 4.17 %
    ENB.PF.E FixedReset -1.86 % YTW SCENARIO
    Maturity Type : Limit Maturity
    Maturity Date : 2044-12-08
    Maturity Price : 22.88
    Evaluated at bid price : 24.31
    Bid-YTW : 4.24 %
    ENB.PF.G FixedReset -1.85 % YTW SCENARIO
    Maturity Type : Limit Maturity
    Maturity Date : 2044-12-08
    Maturity Price : 22.88
    Evaluated at bid price : 24.35
    Bid-YTW : 4.25 %
    ENB.PF.A FixedReset -1.81 % YTW SCENARIO
    Maturity Type : Limit Maturity
    Maturity Date : 2044-12-08
    Maturity Price : 22.92
    Evaluated at bid price : 24.35
    Bid-YTW : 4.22 %
    MFC.PR.M FixedReset -1.74 % YTW SCENARIO
    Maturity Type : Hard Maturity
    Maturity Date : 2025-01-31
    Maturity Price : 25.00
    Evaluated at bid price : 24.81
    Bid-YTW : 3.95 %
    MFC.PR.C Deemed-Retractible -1.67 % YTW SCENARIO
    Maturity Type : Hard Maturity
    Maturity Date : 2025-01-31
    Maturity Price : 25.00
    Evaluated at bid price : 22.41
    Bid-YTW : 5.89 %
    BNS.PR.Y FixedReset -1.62 % YTW SCENARIO
    Maturity Type : Hard Maturity
    Maturity Date : 2022-01-31
    Maturity Price : 25.00
    Evaluated at bid price : 23.67
    Bid-YTW : 3.44 %
    IGM.PR.B Perpetual-Premium -1.52 % YTW SCENARIO
    Maturity Type : Call
    Maturity Date : 2018-12-31
    Maturity Price : 25.00
    Evaluated at bid price : 26.00
    Bid-YTW : 5.00 %
    ENB.PF.C FixedReset -1.45 % YTW SCENARIO
    Maturity Type : Limit Maturity
    Maturity Date : 2044-12-08
    Maturity Price : 22.94
    Evaluated at bid price : 24.44
    Bid-YTW : 4.19 %
    SLF.PR.A Deemed-Retractible -1.39 % YTW SCENARIO
    Maturity Type : Hard Maturity
    Maturity Date : 2025-01-31
    Maturity Price : 25.00
    Evaluated at bid price : 24.11
    Bid-YTW : 5.20 %
    GWO.PR.Q Deemed-Retractible -1.37 % YTW SCENARIO
    Maturity Type : Hard Maturity
    Maturity Date : 2025-01-31
    Maturity Price : 25.00
    Evaluated at bid price : 25.15
    Bid-YTW : 5.06 %
    BAM.PR.T FixedReset -1.36 % YTW SCENARIO
    Maturity Type : Limit Maturity
    Maturity Date : 2044-12-08
    Maturity Price : 23.36
    Evaluated at bid price : 24.61
    Bid-YTW : 3.88 %
    SLF.PR.E Deemed-Retractible -1.34 % YTW SCENARIO
    Maturity Type : Hard Maturity
    Maturity Date : 2025-01-31
    Maturity Price : 25.00
    Evaluated at bid price : 22.77
    Bid-YTW : 5.66 %
    ENB.PR.D FixedReset -1.33 % YTW SCENARIO
    Maturity Type : Limit Maturity
    Maturity Date : 2044-12-08
    Maturity Price : 22.44
    Evaluated at bid price : 23.05
    Bid-YTW : 4.16 %
    POW.PR.G Perpetual-Premium -1.30 % YTW SCENARIO
    Maturity Type : Call
    Maturity Date : 2021-04-15
    Maturity Price : 25.00
    Evaluated at bid price : 26.65
    Bid-YTW : 4.57 %
    ENB.PR.H FixedReset -1.25 % YTW SCENARIO
    Maturity Type : Limit Maturity
    Maturity Date : 2044-12-08
    Maturity Price : 21.36
    Evaluated at bid price : 21.36
    Bid-YTW : 4.30 %
    ELF.PR.H Perpetual-Premium -1.17 % YTW SCENARIO
    Maturity Type : Limit Maturity
    Maturity Date : 2044-12-08
    Maturity Price : 24.83
    Evaluated at bid price : 25.30
    Bid-YTW : 5.50 %
    PWF.PR.T FixedReset -1.16 % YTW SCENARIO
    Maturity Type : Limit Maturity
    Maturity Date : 2044-12-08
    Maturity Price : 23.39
    Evaluated at bid price : 25.50
    Bid-YTW : 3.71 %
    SLF.PR.B Deemed-Retractible -1.14 % YTW SCENARIO
    Maturity Type : Hard Maturity
    Maturity Date : 2025-01-31
    Maturity Price : 25.00
    Evaluated at bid price : 24.21
    Bid-YTW : 5.20 %
    PWF.PR.R Perpetual-Premium -1.10 % YTW SCENARIO
    Maturity Type : Call
    Maturity Date : 2021-04-30
    Maturity Price : 25.00
    Evaluated at bid price : 26.06
    Bid-YTW : 4.85 %
    GWO.PR.I Deemed-Retractible -1.08 % YTW SCENARIO
    Maturity Type : Hard Maturity
    Maturity Date : 2025-01-31
    Maturity Price : 25.00
    Evaluated at bid price : 23.00
    Bid-YTW : 5.53 %
    SLF.PR.I FixedReset -1.04 % YTW SCENARIO
    Maturity Type : Call
    Maturity Date : 2016-12-31
    Maturity Price : 25.00
    Evaluated at bid price : 25.78
    Bid-YTW : 2.56 %
    BAM.PF.C Perpetual-Discount -1.01 % YTW SCENARIO
    Maturity Type : Limit Maturity
    Maturity Date : 2044-12-08
    Maturity Price : 21.27
    Evaluated at bid price : 21.56
    Bid-YTW : 5.72 %
    Volume Highlights
    Issue Index Shares
    Traded
    Notes
    BMO.PR.P FixedReset 259,575 Desjardins crossed 200,000 at 25.32. TD crossed 53,600 at the same price.
    YTW SCENARIO
    Maturity Type : Call
    Maturity Date : 2015-02-25
    Maturity Price : 25.00
    Evaluated at bid price : 25.30
    Bid-YTW : 0.73 %
    TRP.PR.A FixedReset 182,016 Will reset to 3.266% effective December 31. Nesbitt crossed 30,000 at 21.36. TD crossed 25,000 at the same price and Scotia crossed 30,000 at the same price again.
    YTW SCENARIO
    Maturity Type : Limit Maturity
    Maturity Date : 2044-12-08
    Maturity Price : 21.36
    Evaluated at bid price : 21.36
    Bid-YTW : 3.95 %
    ENB.PR.T FixedReset 102,709 RBC crossed 50,700 at 23.15 and 21,800 at 23.00.
    YTW SCENARIO
    Maturity Type : Limit Maturity
    Maturity Date : 2044-12-08
    Maturity Price : 22.28
    Evaluated at bid price : 22.95
    Bid-YTW : 4.30 %
    BAM.PF.F FixedReset 87,304 Desjardins crossed 75,000 at 25.70.
    YTW SCENARIO
    Maturity Type : Call
    Maturity Date : 2019-09-30
    Maturity Price : 25.00
    Evaluated at bid price : 25.68
    Bid-YTW : 4.09 %
    FTS.PR.M FixedReset 73,932 RBC crossed 70,000 at 25.60.
    YTW SCENARIO
    Maturity Type : Call
    Maturity Date : 2019-12-01
    Maturity Price : 25.00
    Evaluated at bid price : 25.50
    Bid-YTW : 3.69 %
    MFC.PR.M FixedReset 54,843 Scotia crossed 35,000 at 25.25.
    YTW SCENARIO
    Maturity Type : Hard Maturity
    Maturity Date : 2025-01-31
    Maturity Price : 25.00
    Evaluated at bid price : 24.81
    Bid-YTW : 3.95 %
    There were 41 other index-included issues trading in excess of 10,000 shares.
    Wide Spread Highlights
    Issue Index Quote Data and Yield Notes
    PWF.PR.A Floater Quote: 19.20 – 20.20
    Spot Rate : 1.0000
    Average : 0.6772

    YTW SCENARIO
    Maturity Type : Limit Maturity
    Maturity Date : 2044-12-08
    Maturity Price : 19.20
    Evaluated at bid price : 19.20
    Bid-YTW : 2.75 %

    MFC.PR.I FixedReset Quote: 25.42 – 25.95
    Spot Rate : 0.5300
    Average : 0.3221

    YTW SCENARIO
    Maturity Type : Call
    Maturity Date : 2017-09-19
    Maturity Price : 25.00
    Evaluated at bid price : 25.42
    Bid-YTW : 3.73 %

    IGM.PR.B Perpetual-Premium Quote: 26.00 – 26.46
    Spot Rate : 0.4600
    Average : 0.2744

    YTW SCENARIO
    Maturity Type : Call
    Maturity Date : 2018-12-31
    Maturity Price : 25.00
    Evaluated at bid price : 26.00
    Bid-YTW : 5.00 %

    MFC.PR.M FixedReset Quote: 24.81 – 25.23
    Spot Rate : 0.4200
    Average : 0.2506

    YTW SCENARIO
    Maturity Type : Hard Maturity
    Maturity Date : 2025-01-31
    Maturity Price : 25.00
    Evaluated at bid price : 24.81
    Bid-YTW : 3.95 %

    MFC.PR.F FixedReset Quote: 20.75 – 21.20
    Spot Rate : 0.4500
    Average : 0.2812

    YTW SCENARIO
    Maturity Type : Hard Maturity
    Maturity Date : 2025-01-31
    Maturity Price : 25.00
    Evaluated at bid price : 20.75
    Bid-YTW : 5.27 %

    MFC.PR.C Deemed-Retractible Quote: 22.41 – 23.10
    Spot Rate : 0.6900
    Average : 0.5286

    YTW SCENARIO
    Maturity Type : Hard Maturity
    Maturity Date : 2025-01-31
    Maturity Price : 25.00
    Evaluated at bid price : 22.41
    Bid-YTW : 5.89 %

    Market Action

    December 5, 2014

    Jobs, jobs, jobs!

    A November surprise that included a jump in wages as well as the biggest hiring surge in almost three years suggests the world’s largest economy is putting aside doubts about the strength of the expansion.

    The 321,000 advance in payrolls followed a 243,000 increase in October that was stronger than previously reported, Labor Department figures showed today in Washington. The jobless rate held at a six-year low of 5.8 percent and earnings rose by the most since June of last year.

    The breadth of industries hiring last month was the broadest since 1998, a sign the benefits of the expansion were rippling through the economy.

    Factory payrolls rose by the most in a year, professional and business services companies took on more employees than at any time since November 2010, financial firms boosted payrolls by the most since early 2012 and hiring at retailers picked up.

    The yield on the benchmark 10-year Treasury note rose to 2.31 percent at 2:47 p.m. in New York from 2.24 percent late yesterday. The Bloomberg Dollar Spot Index, which tracks the greenback against 10 trading partners, gained 0.8 percent, and the Standard & Poor’s 500 Index advanced 0.2 percent.

    Up north, not so much:

    The Canadian dollar reached a five-year low as data showed the economy lost jobs in November while U.S. payrolls swelled, adding to speculation the Federal Reserve will raise interest rates before the Bank of Canada.

    The currency erased a weekly gain as the report showed employment fell by 10,700 jobs. The drop bolstered a Bank of Canada statement this week that, while the recovery shows signs of broadening, the labor market “continues to indicate significant slack in the economy.” The nation added 117,200 jobs over the previous two months.

    Canadian government bonds fell, pushing the yield on the benchmark 10-year security up five basis points, or 0.05 percentage point, to 1.96 percent. It reached 1.98 percent, the highest level since Nov. 25. The price of the debt dropped 46 cents to C$104.67.

    Employment declined after jumps of 43,100 and 74,100 the last two months, Statistics Canada said today from Ottawa. The unemployment rate rose to 6.6 percent from a six-year low of 6.5 percent. Economists surveyed by Bloomberg News projected employment would be unchanged and the jobless rate would rise to 6.6 percent, according to median forecasts.

    And things are still sluggish in Germany:

    But Germany’s Bundesbank halved its 2015 growth forecast for Germany to 1.0 per cent and also cut its estimate for this year to 1.4 per cent from a forecast of 1.9 per cent made in June. It also trimmed its prediction for 2016 to 1.6 per cent.

    “However, there is reason to hope that the current sluggish phase will prove to be short-lived,” Bundesbank President Jens Weidmann said in a statement, adding that opportunities abroad would likely increase again next year.

    He also said that if crude oil prices remained subdued for a longer period, gross domestic product (GDP) could expand by an additional 0.1-0.2 percentage points in both 2015 and 2016.

    … and in Italy:

    Standard & Poor’s cut Italy’s sovereign credit rating on Friday from triple-B to triple-B-minus, just one notch above junk, saying weak growth and poor competitiveness undermined the sustainability of its huge public debt.

    The downgrade is a blow for Prime Minister Matteo Renzi, who came to office in February pledging an ambitious reform agenda to lift Italy out of recession, but has seen the economy continue to shrink.

    S&P said the new triple-B-minus rating carried a stable outlook. It forecast Italian economic growth would be just 0.2 per cent in 2015 and would average 0.5 per cent in 2014-2017.

    As recently as June, the agency had confirmed Italy’s triple-B rating and forecast average growth of 1.0 per cent over the three-year period.

    Italy’s economy is expected to shrink in 2014 for the third consecutive year.

    There’s an interesting paper by Gregory Thwaites titled Why are real interest rates so low? Secular stagnation and the relative price of investment goods:

    Over the past four decades, real interest rates have risen then fallen across the industrialised world. Over the same period, nominal investment rates are down, while house prices and household debt are up. I explain these four trends with a fifth – the widespread fall in the relative price of investment goods. I present a simple closed-economy OLG model in which households finance retirement in part by selling claims on the corporate sector (capital goods) accumulated over their working lives. As capital goods prices fall, the interest rate must fall to reflect capital losses. And in the long run, a given quantity of saving buys more capital goods. This has ambiguous effects on interest rates in the long run: if the production function is inelastic, in line with most estimates in the literature, interest rates stay low even after relative prices have stopped falling. Lower interest rates reduce the user cost of housing, raising house prices and, given that housing is bought early in life, increasing household debt. I extend the model to allow for a heterogeneous bequest motive, and show that wealth inequality rises but consumption inequality falls. I test the model on cross-country data and find support for its assumptions and predictions. The analysis in this paper shows recent debates on macroeconomic imbalances and household and government indebtedness in a new light. In particular, low real interest rates may be the new normal. The debt of the young provides an alternative outlet for the retirement savings of the old; preventing the accumulation of debt, for example through macroprudential policy, leads to a bigger fall in interest rates.

    This paper fleshes out a new, complementary explanation for the falls in real interest rates, rises in household debt and falling investment rates across the industrialised world. The story is based on the widespread fall in the price of investment goods – the machines, equipment and buildings that firms buy – relative to the prices of other things the economy produces. This fall has reduced the demand for savings, rather than the supply.

    This makes sense to me. When you’re starting a business, you don’t (usually) need $100-million for a new factory any more; $10,000 for a couple of new computers will (often) do the trick. Thanks to Ian McGugan of the Globe for writing a review.

    It’s a black day … the UK is redeeming some perps:

    U.K. Chancellor George Osborne is to repay the state’s century-old war debt. By current standards, the undated stock is expensive for the government to service. Terms give holders of the hard-to-trade bond a decent payoff. It looks like a win-win. Time could prove a harsher judge of the deal.

    The British government issued its War Loan in 1917. At first, the undated debt offered a yield of 5 per cent. It was restructured in 1947 to pay 3.5 per cent. Even that lower figure looks expensive by current standards. Weak economic growth and low inflation have suppressed long-dated yields. Ten-year UK government debt gives only 2 per cent at present.

    I’ve always been fond of the British perps … fortunately, my all-time favourite, the 2.5% annuities issued in 1853 are still outstanding … all £1-million of them!

    BSD.PR.A was confirmed at Pfd-4(low) by DBRS:

    As of December 1, 2014, the Portfolio consisted of 72.0% Canadian common stock, 22.0% REITs, 4.0% limited partnerships and 2.0% Canadian preferred stock. The rating was last confirmed in December 2013 and performance has been generally positive in the first half year of 2014, but has since been volatile. Downside protection available to holders of the Preferred Securities rose to 29.9% in June 2014, but has since been volatile, dropping to approximately 20.0% at the end of November 2014 (similar to November 2013 levels). The yield on the Portfolio has decreased slightly, causing the distribution coverage ratio to drop to 0.70 times (as of November 28, 2014). The rating on the Preferred Securities continues to be constrained by the large percentage of underlying securities in the Portfolio that are not rated by any rating agency and the grind on the Portfolio due to distributions exceeding income.

    I suggest that preferred share investors stop looking at their monitors and go for a nice walk … like this guy:

    endOfTheWorld

    It was another awful day for the Canadian preferred share market, with PerpetualDiscounts losing 38bp, FixedResets down 36bp and DeemedRetractibles off 5bp. Another lengthy Performance Report is – again – dominated by losing FixedResets which are – again – predominantly lower spread and Enbridge issues. Despite four issues (recent heavy losers) breaking the 100,000 share barrier, volume was slightly below average.

    All this poor performance by the lower-reset issues should imply a decrease in Implied Volatility, so here are some pictures:

    impVol_TRP_141205
    Click for Big

    So according to this, TRP.PR.A, bid at 21.40, is $0.74 cheap, but it has already reset. TRP.PR.B, bid at 17.37, is $0.60 cheap, but it resets 2015-6-30. TRP.PR.C, bid at 20.52, is $0.86 expensive, but it resets 2016-1-30. So an alternative way of resolving the differences between these three issues is to expect the GOC-5 yield to stay at 1.48% until TRP.PR.B resets, but to increase to about 1.72% prior to TRP.PR.C resetting.

    impVol_MFC_141205
    Click for Big

    MFC volatility is still very high. The low-spread MFC.PR.F looks a little cheap … and it doesn’t reset until 2016-6-19.

    impVol_BAM_141205
    Click for Big

    BAM.PR.X, with a +180bp spread, bid at 21.40, looks $1.06 cheap and doesn’t reset until 2017-6-30. BAM.PR.R, with a +230bp spread, bid at 25.71, looks $1.48 rich and resets 2016-6-30. So go figure that one out, wise guy.

    impVol_FTS_141205
    Click for Big

    This is just weird because the middle is expensive and the ends are cheap but anyway … FTS.PR.H, with a spread of +145bp, and bid at 20.01, looks $0.39 cheap and resets 2015-6-1. FTS.PR.K, with a spread of +205bp, and bid at 24.81, looks $0.56 expensive and resets 2019-3-1.

    HIMIPref™ Preferred Indices
    These values reflect the December 2008 revision of the HIMIPref™ Indices

    Values are provisional and are finalized monthly
    Index Mean
    Current
    Yield
    (at bid)
    Median
    YTW
    Median
    Average
    Trading
    Value
    Median
    Mod Dur
    (YTW)
    Issues Day’s Perf. Index Value
    Ratchet 0.00 % 0.00 % 0 0.00 0 0.7412 % 2,536.8
    FixedFloater 0.00 % 0.00 % 0 0.00 0 0.7412 % 4,016.3
    Floater 2.97 % 3.08 % 62,774 19.45 4 0.7412 % 2,696.8
    OpRet 4.40 % -11.75 % 26,721 0.08 2 -0.0195 % 2,759.0
    SplitShare 4.28 % 3.84 % 40,220 3.74 5 -0.3663 % 3,186.5
    Interest-Bearing 0.00 % 0.00 % 0 0.00 0 -0.0195 % 2,522.8
    Perpetual-Premium 5.41 % -2.53 % 73,249 0.09 20 0.0117 % 2,487.7
    Perpetual-Discount 5.16 % 5.06 % 114,478 15.34 15 -0.3773 % 2,656.8
    FixedReset 4.21 % 3.63 % 194,795 16.75 74 -0.3560 % 2,552.4
    Deemed-Retractible 4.97 % -0.83 % 102,250 0.15 40 -0.0505 % 2,613.3
    FloatingReset 2.53 % 1.87 % 59,644 3.48 5 0.3221 % 2,552.8
    Performance Highlights
    Issue Index Change Notes
    SLF.PR.G FixedReset -2.48 % YTW SCENARIO
    Maturity Type : Hard Maturity
    Maturity Date : 2025-01-31
    Maturity Price : 25.00
    Evaluated at bid price : 19.70
    Bid-YTW : 5.60 %
    GWO.PR.N FixedReset -2.46 % YTW SCENARIO
    Maturity Type : Hard Maturity
    Maturity Date : 2025-01-31
    Maturity Price : 25.00
    Evaluated at bid price : 19.80
    Bid-YTW : 5.46 %
    TRP.PR.B FixedReset -2.14 % YTW SCENARIO
    Maturity Type : Limit Maturity
    Maturity Date : 2044-12-05
    Maturity Price : 17.37
    Evaluated at bid price : 17.37
    Bid-YTW : 3.85 %
    PWF.PR.P FixedReset -1.81 % YTW SCENARIO
    Maturity Type : Limit Maturity
    Maturity Date : 2044-12-05
    Maturity Price : 21.11
    Evaluated at bid price : 21.11
    Bid-YTW : 3.65 %
    ENB.PR.B FixedReset -1.54 % YTW SCENARIO
    Maturity Type : Limit Maturity
    Maturity Date : 2044-12-05
    Maturity Price : 22.92
    Evaluated at bid price : 23.73
    Bid-YTW : 3.96 %
    CGI.PR.D SplitShare -1.51 % YTW SCENARIO
    Maturity Type : Soft Maturity
    Maturity Date : 2023-06-14
    Maturity Price : 25.00
    Evaluated at bid price : 24.85
    Bid-YTW : 3.84 %
    TRP.PR.C FixedReset -1.44 % YTW SCENARIO
    Maturity Type : Limit Maturity
    Maturity Date : 2044-12-05
    Maturity Price : 20.52
    Evaluated at bid price : 20.52
    Bid-YTW : 3.68 %
    MFC.PR.C Deemed-Retractible -1.43 % YTW SCENARIO
    Maturity Type : Hard Maturity
    Maturity Date : 2025-01-31
    Maturity Price : 25.00
    Evaluated at bid price : 22.79
    Bid-YTW : 5.67 %
    ENB.PR.H FixedReset -1.28 % YTW SCENARIO
    Maturity Type : Limit Maturity
    Maturity Date : 2044-12-05
    Maturity Price : 21.33
    Evaluated at bid price : 21.63
    Bid-YTW : 4.15 %
    ENB.PR.N FixedReset -1.27 % YTW SCENARIO
    Maturity Type : Limit Maturity
    Maturity Date : 2044-12-05
    Maturity Price : 22.90
    Evaluated at bid price : 24.10
    Bid-YTW : 4.10 %
    ENB.PR.D FixedReset -1.27 % YTW SCENARIO
    Maturity Type : Limit Maturity
    Maturity Date : 2044-12-05
    Maturity Price : 22.62
    Evaluated at bid price : 23.36
    Bid-YTW : 4.02 %
    PWF.PR.S Perpetual-Discount 1.16 % YTW SCENARIO
    Maturity Type : Limit Maturity
    Maturity Date : 2044-12-05
    Maturity Price : 24.10
    Evaluated at bid price : 24.50
    Bid-YTW : 4.93 %
    BAM.PR.B Floater 1.54 % YTW SCENARIO
    Maturity Type : Limit Maturity
    Maturity Date : 2044-12-05
    Maturity Price : 17.18
    Evaluated at bid price : 17.18
    Bid-YTW : 3.08 %
    Volume Highlights
    Issue Index Shares
    Traded
    Notes
    HSE.PR.A FixedReset 145,346 Nesbitt crossed 127,800 at 19.63.
    YTW SCENARIO
    Maturity Type : Limit Maturity
    Maturity Date : 2044-12-05
    Maturity Price : 19.80
    Evaluated at bid price : 19.80
    Bid-YTW : 4.02 %
    TRP.PR.A FixedReset 132,032 Will reset at 3.266%. Nesbitt crossed 50,000 at 21.36.
    YTW SCENARIO
    Maturity Type : Limit Maturity
    Maturity Date : 2044-12-05
    Maturity Price : 21.40
    Evaluated at bid price : 21.40
    Bid-YTW : 3.85 %
    ENB.PF.G FixedReset 122,942 RBC crossed blocks of 77,600 shares, 15,000 and 21,100, all at 24.85.
    YTW SCENARIO
    Maturity Type : Limit Maturity
    Maturity Date : 2044-12-05
    Maturity Price : 23.05
    Evaluated at bid price : 24.81
    Bid-YTW : 4.08 %
    ENB.PF.C FixedReset 102,155 Desjardins sold blocks of 49,200 and 46,300 to anonymous, both at 24.90.
    YTW SCENARIO
    Maturity Type : Limit Maturity
    Maturity Date : 2044-12-05
    Maturity Price : 23.08
    Evaluated at bid price : 24.80
    Bid-YTW : 4.05 %
    TD.PR.S FixedReset 98,336 TD crossed 90,000 at 25.42.
    YTW SCENARIO
    Maturity Type : Hard Maturity
    Maturity Date : 2022-01-31
    Maturity Price : 25.00
    Evaluated at bid price : 25.35
    Bid-YTW : 3.03 %
    TRP.PR.E FixedReset 67,400 RBC crossed 62,000 at 25.55.
    YTW SCENARIO
    Maturity Type : Limit Maturity
    Maturity Date : 2044-12-05
    Maturity Price : 23.30
    Evaluated at bid price : 25.40
    Bid-YTW : 3.67 %
    There were 24 other index-included issues trading in excess of 10,000 shares.
    Wide Spread Highlights
    Issue Index Quote Data and Yield Notes
    PVS.PR.C SplitShare Quote: 25.90 – 26.90
    Spot Rate : 1.0000
    Average : 0.8043

    YTW SCENARIO
    Maturity Type : Call
    Maturity Date : 2015-12-10
    Maturity Price : 25.50
    Evaluated at bid price : 25.90
    Bid-YTW : 3.17 %

    TD.PR.R Deemed-Retractible Quote: 26.27 – 26.88
    Spot Rate : 0.6100
    Average : 0.4440

    YTW SCENARIO
    Maturity Type : Call
    Maturity Date : 2015-01-04
    Maturity Price : 25.75
    Evaluated at bid price : 26.27
    Bid-YTW : -12.23 %

    ENB.PR.B FixedReset Quote: 23.73 – 24.23
    Spot Rate : 0.5000
    Average : 0.3427

    YTW SCENARIO
    Maturity Type : Limit Maturity
    Maturity Date : 2044-12-05
    Maturity Price : 22.92
    Evaluated at bid price : 23.73
    Bid-YTW : 3.96 %

    MFC.PR.H FixedReset Quote: 25.90 – 26.45
    Spot Rate : 0.5500
    Average : 0.4146

    YTW SCENARIO
    Maturity Type : Call
    Maturity Date : 2017-03-19
    Maturity Price : 25.00
    Evaluated at bid price : 25.90
    Bid-YTW : 2.90 %

    MFC.PR.C Deemed-Retractible Quote: 22.79 – 23.27
    Spot Rate : 0.4800
    Average : 0.3517

    YTW SCENARIO
    Maturity Type : Hard Maturity
    Maturity Date : 2025-01-31
    Maturity Price : 25.00
    Evaluated at bid price : 22.79
    Bid-YTW : 5.67 %

    FTS.PR.F Perpetual-Discount Quote: 24.51 – 25.00
    Spot Rate : 0.4900
    Average : 0.3672

    YTW SCENARIO
    Maturity Type : Limit Maturity
    Maturity Date : 2044-12-05
    Maturity Price : 24.07
    Evaluated at bid price : 24.51
    Bid-YTW : 5.01 %

    Market Action

    December 4, 2014

    Europe is inching towards quantitative easing:

    Mario Draghi dragged the European Central Bank toward more monetary stimulus with a pledge to assess the need early next year, disappointing some investors seeking faster action.

    Even as he unveiled “substantially” lower forecasts for euro-area inflation and economic growth, the ECB president said officials will wait to evaluate whether they’re doing enough to revive the weakest consumer-price growth in five years. They are already intensifying preparations for further measures, including studying the merits of buying government debt.

    If policy makers do see a need to combat a prolonged period of low inflation then “this would imply altering early next year the size, pace and composition of our measures,” Draghi told reporters in Frankfurt after his Governing Council met to set policy for the last time in 2014. “We don’t need unanimity” on the 24-member council to act, he said.

    The ECB Governing Council expects to consider a proposal for a broad-based asset program including sovereign debt next month, according to two euro-area central-bank officials familiar with deliberations who asked not to be identified because the discussion is private. The package is envisaged to include various types of bonds, but no equities, and has yet to be designed, the people said.

    Canadian equities got hammered:

    Canadian stocks fell the most in more than a year as the nation’s biggest banks posted results that missed estimates and energy shares resumed a selloff with the price of crude.

    Toronto-Dominion Bank (TD), the country’s largest lender by assets, tumbled the most in more than five years after posting fourth-quarter profit short of estimates. Energy stocks tumbled 2.1 percent as a group as oil fell. Canadian Oil Sands Ltd. (COS) sank 16 percent to a decade low after slashing its dividend. Enbridge Inc. jumped 10 percent to a record on plans to transfer C$17 billion ($14.9 billion) in assets to a fund.

    The Standard & Poor’s/TSX Composite Index (SPTSX) slumped 284.11 points, or 1.9 percent, to 14,469.95 at 4 p.m. in Toronto, the biggest drop since June 2013. The equities benchmark pared its gain to 6.2 percent this year.

    All of the 10 industries in the S&P/TSX dropped at least 0.6 percent on trading volume 45 percent higher than the 30-day average today. Global equities slumped after the European Central Bank said policy makers will reassess stimulus next quarter, damping hopes for additional bond purchases this year.

    And whenever there’s a big market move there’s only one party at fault:

    A nearly 1 per cent drop in the S&P/TSX composite index in the final hour of trading Thursday was due to a large order from Goldman Sachs to sell a basket of Canadian stocks, according to a note from the Bank of Montreal.

    Canada’s main stock index recorded one of its biggest declines of the year on Thursday, as investors reacted to another push lower in the price of crude oil as well as a disappointing earnings report from Toronto-Dominion Bank.

    According to BMO, the Goldman Sachs sell order was for approximately $600-million in a broad selection of Canadian stocks, but many were in the banking and energy sectors. The heaviest volumes sold by Goldman were shares in Royal Bank of Canada, TD Bank, Bank of Nova Scotia, Bank of Montreal, Canadian Natural Resources, Enbridge and Suncor.

    The TSX closed down 284.1 points, or 1.93 per cent, at 14,469.95, far outpacing the 0.12 per cent fall in the S&P 500. The Canadian index had been down nearly 1 per cent prior to 3 p.m. (ET), which is around when the Goldman order was believed to be transacted.

    The feds are shilling for the Toronto Exchange:

    The Canadian government has approved Burger King Worldwide Inc.’s purchase of Tim Hortons Inc. on condition it maintains employment levels and list the company in Toronto.

    To win approval under the nation’s foreign takeover law, Burger King has agreed to “work with Tim Hortons (THI) franchisees” to maintain employment levels across Canada, and accelerate expansion of new restaurants outside Canada at a “significantly greater pace than currently planned,” Industry Minister James Moore said in a statement.

    Burger King has also agreed to establish the new company’s headquarters in Oakville, Ontario and list on the Toronto Stock Exchange, according to the statement. Other commitments include managing Tim Hortons as a “distinct brand” that won’t be co-branded with Burger King and the maintenance of franchise rent and royalty structure at current levels for the next five years.

    Yay! Micromanagement and central planning! Soon we’ll all be RICH!

    Bond salesmen won’t be rich, though (emphasis added):

    Four of Canada’s six biggest banks have posted quarterly declines in trading, dragged down by plunging bond markets in October and one-time changes to how lenders value uncollaterized derivatives.

    Toronto-Dominion Bank’s trading revenue dropped 14 percent to C$296 million ($260 million) in the period ended Oct. 31 from a year earlier, led by declines in interest-rate and credit trading, the company said today. The lender recorded a C$65 million pretax charge in its wholesale bank tied to the valuation adjustment.

    Bank of Montreal (BMO) trading revenue tumbled 21 percent to C$186 million as fixed-income trading plunged 79 percent from a year earlier, the bank said in a Dec. 2 statement. The valuation adjustment reduced revenue by C$39 million.

    CIBC trading revenue fell 81 percent to C$27 million, with a C$98 million loss in interest-rates trading, the Toronto-based bank said today in a statement. The lender said it recorded an C$82 million after-tax charge tied to funding valuation adjustments.

    Trimming Capital

    Royal Bank’s total trading revenue slid 43 percent to C$371 million, fueled by a 70 percent drop in trading of interest-rate and credit securities, the Toronto-based bank said yesterday. Royal Bank had a C$51 million after-tax charge tied to the adjustments.

    Royal Bank has been trimming the capital devoted to bond trading as global regulations meant to prevent another credit crisis make it one of the lender’s most costly businesses, CFO Janice Fukakusa said.

    So bond market liquidity just got a little worse. Just in time for the long-awaited crash due to policy rate changes!

    I try to restrain myself from ranting on non-preferred share issues on this soap-box, but every now and then something irritates me enough that I think it would be a shame to deprive you of my views. Today’s rant is about a Bloomberg story titled Princeton Has a Shadow Fraternity System Nobody Controls. So in the first place, the headline is nonsense. The ‘shadow fraternity system’ certainly is under control by somebody, how could it be otherwise? The writer is merely upset that it’s not controlled by people of whom he approves.

    When Princeton officials learned that a student had mass-emailed a photo of a woman performing oral sex at one of its 11 eating clubs (social clubs that resemble fraternities), it quietly began investigating the matter. Despite the fact that passing around a photo of a sex act without the consent of those pictured is a crime in New Jersey, the university did not inform local police. The school’s squeamish approach to the incident raises questions about how it can discipline its students — and abide by stricter government guidelines for handling sexual assault — when so much of social life at the institution lives outside the walls of campus.

    “Our investigation began as soon as we received a report, just days after the alleged incident,” says Martin Mbugua, a University spokesman. The Princeton Police Department only found out about the email three weeks later, when an anonymous third party notified the police chief. Any misbehavior at the Tiger Inn, headquartered in a stately mansion on a street just off the main campus, technically falls under the jurisdiction of local police.

    In November, the Department of Education found that Princeton botched its response to reports of sexual assault and the University formally agreed to tighten its handling of alleged sexual crimes. New guidelines implemented by the government require schools to investigate sexual violence reports that occur outside of school grounds if the incident has “continuing effects on campus.”

    So the university is on the defensive about not being an official informer, and are expected to be Junior Policemen with respect to sexual violence. Sorry, buddies: these are university students we are talking about here – young men and young women. If they want something to be a police matter, they should be expected to know how to contact the police themselves. Junior Police and a Junior Justice System with the power to expel students are not the answer to anything. But meanwhile, the politicians bleat that 20-year olds are old enough to die in Afghanistan, but not old enough to take responsibility for themselves, and drip crocodile tears over the rising cost of tuition due to administrative overload.

    There was one cry on the lips of FixedReset investors today:

    clobberinTime

    One thing I can’t help but highlighting, given the horrible (second-worst) performance of TRP.PR.C today, is the Implied Volatility analysis for the TRP FixedResets:

    impVol_TRP_141204
    Click for Big

    Assiduous Readers will recognize that the overall appearance of the graph has not changed from the chart published as of the close on December 2, but Alert Assiduous Readers will notice that the fit to theory is much better. On Tuesday I asserted that:

    Prices for the TRP issues are very strange: consider that TRP.PR.A, bid at 21.15, is priced lower than TRP.PR.C, which is a FixedReset, 4.40%+154, resetting 2016-1-30, bid at 21.77. … TRP.PR.A is now $1.44 cheap while TRP.PR.C is $1.73 expensive

    Well, that was then. Now I say that TRP.PR.A is bid at 21.39 and is $0.89 cheap, while TRP.PR.C is bid at 20.82 and is $1.06 expensive. So according to me, there’s more adjustment yet to come!

    Despite that – and despite a reported 42bp decline in TXPR and a 79bp hit for TXPL – it was a mixed day for the Canadian preferred share market today, with PerpetualDiscounts off 6bp, FixedResets down 62bp and DeemedRetractibles gaining 4bp. There is a very lengthy list of performance highlights, just like the old days of 2008, dominated of course by FixedReset losers with a large contingent of Enbridge issues, spooked by the credit muttering. Volume was average.

    HIMIPref™ Preferred Indices
    These values reflect the December 2008 revision of the HIMIPref™ Indices

    Values are provisional and are finalized monthly
    Index Mean
    Current
    Yield
    (at bid)
    Median
    YTW
    Median
    Average
    Trading
    Value
    Median
    Mod Dur
    (YTW)
    Issues Day’s Perf. Index Value
    Ratchet 0.00 % 0.00 % 0 0.00 0 0.0285 % 2,518.1
    FixedFloater 0.00 % 0.00 % 0 0.00 0 0.0285 % 3,986.7
    Floater 2.99 % 3.10 % 63,408 19.41 4 0.0285 % 2,677.0
    OpRet 4.39 % -11.90 % 27,137 0.08 2 -0.0390 % 2,759.6
    SplitShare 4.27 % 3.63 % 41,879 3.75 5 0.0791 % 3,198.2
    Interest-Bearing 0.00 % 0.00 % 0 0.00 0 -0.0390 % 2,523.3
    Perpetual-Premium 5.41 % -2.69 % 73,001 0.09 20 0.0605 % 2,487.4
    Perpetual-Discount 5.14 % 5.03 % 115,315 15.40 15 -0.0652 % 2,666.9
    FixedReset 4.20 % 3.58 % 196,880 8.57 74 -0.6162 % 2,561.5
    Deemed-Retractible 4.97 % -0.69 % 94,662 0.15 40 0.0446 % 2,614.7
    FloatingReset 2.54 % 1.88 % 60,146 3.48 5 -0.1569 % 2,544.6
    Performance Highlights
    Issue Index Change Notes
    HSE.PR.A FixedReset -4.34 % YTW SCENARIO
    Maturity Type : Limit Maturity
    Maturity Date : 2044-12-04
    Maturity Price : 19.61
    Evaluated at bid price : 19.61
    Bid-YTW : 4.06 %
    TRP.PR.C FixedReset -3.92 % YTW SCENARIO
    Maturity Type : Limit Maturity
    Maturity Date : 2044-12-04
    Maturity Price : 20.82
    Evaluated at bid price : 20.82
    Bid-YTW : 3.63 %
    PWF.PR.P FixedReset -3.41 % YTW SCENARIO
    Maturity Type : Limit Maturity
    Maturity Date : 2044-12-04
    Maturity Price : 21.50
    Evaluated at bid price : 21.50
    Bid-YTW : 3.58 %
    GWO.PR.N FixedReset -3.20 % YTW SCENARIO
    Maturity Type : Hard Maturity
    Maturity Date : 2025-01-31
    Maturity Price : 25.00
    Evaluated at bid price : 20.30
    Bid-YTW : 5.16 %
    ENB.PR.Y FixedReset -2.49 % YTW SCENARIO
    Maturity Type : Limit Maturity
    Maturity Date : 2044-12-04
    Maturity Price : 22.14
    Evaluated at bid price : 22.75
    Bid-YTW : 4.17 %
    ENB.PR.H FixedReset -2.45 % YTW SCENARIO
    Maturity Type : Limit Maturity
    Maturity Date : 2044-12-04
    Maturity Price : 21.63
    Evaluated at bid price : 21.91
    Bid-YTW : 4.09 %
    FTS.PR.H FixedReset -1.87 % YTW SCENARIO
    Maturity Type : Limit Maturity
    Maturity Date : 2044-12-04
    Maturity Price : 19.97
    Evaluated at bid price : 19.97
    Bid-YTW : 3.57 %
    SLF.PR.G FixedReset -1.70 % YTW SCENARIO
    Maturity Type : Hard Maturity
    Maturity Date : 2025-01-31
    Maturity Price : 25.00
    Evaluated at bid price : 20.20
    Bid-YTW : 5.30 %
    ENB.PR.B FixedReset -1.67 % YTW SCENARIO
    Maturity Type : Limit Maturity
    Maturity Date : 2044-12-04
    Maturity Price : 23.10
    Evaluated at bid price : 24.10
    Bid-YTW : 3.89 %
    ENB.PR.D FixedReset -1.62 % YTW SCENARIO
    Maturity Type : Limit Maturity
    Maturity Date : 2044-12-04
    Maturity Price : 22.78
    Evaluated at bid price : 23.66
    Bid-YTW : 3.95 %
    BAM.PR.X FixedReset -1.61 % YTW SCENARIO
    Maturity Type : Limit Maturity
    Maturity Date : 2044-12-04
    Maturity Price : 21.45
    Evaluated at bid price : 21.45
    Bid-YTW : 3.98 %
    ENB.PR.J FixedReset -1.60 % YTW SCENARIO
    Maturity Type : Limit Maturity
    Maturity Date : 2044-12-04
    Maturity Price : 23.08
    Evaluated at bid price : 24.60
    Bid-YTW : 4.02 %
    ENB.PF.E FixedReset -1.47 % YTW SCENARIO
    Maturity Type : Limit Maturity
    Maturity Date : 2044-12-04
    Maturity Price : 23.07
    Evaluated at bid price : 24.82
    Bid-YTW : 4.06 %
    ENB.PF.A FixedReset -1.39 % YTW SCENARIO
    Maturity Type : Limit Maturity
    Maturity Date : 2044-12-04
    Maturity Price : 23.11
    Evaluated at bid price : 24.86
    Bid-YTW : 4.05 %
    ENB.PR.N FixedReset -1.29 % YTW SCENARIO
    Maturity Type : Limit Maturity
    Maturity Date : 2044-12-04
    Maturity Price : 23.03
    Evaluated at bid price : 24.41
    Bid-YTW : 4.04 %
    ENB.PR.T FixedReset -1.28 % YTW SCENARIO
    Maturity Type : Limit Maturity
    Maturity Date : 2044-12-04
    Maturity Price : 22.78
    Evaluated at bid price : 23.92
    Bid-YTW : 4.01 %
    ENB.PR.P FixedReset -1.28 % YTW SCENARIO
    Maturity Type : Limit Maturity
    Maturity Date : 2044-12-04
    Maturity Price : 22.80
    Evaluated at bid price : 23.92
    Bid-YTW : 4.01 %
    BAM.PF.B FixedReset -1.19 % YTW SCENARIO
    Maturity Type : Limit Maturity
    Maturity Date : 2044-12-04
    Maturity Price : 23.20
    Evaluated at bid price : 24.96
    Bid-YTW : 3.99 %
    TRP.PR.B FixedReset -1.17 % YTW SCENARIO
    Maturity Type : Limit Maturity
    Maturity Date : 2044-12-04
    Maturity Price : 17.75
    Evaluated at bid price : 17.75
    Bid-YTW : 3.77 %
    BAM.PF.A FixedReset -1.16 % YTW SCENARIO
    Maturity Type : Call
    Maturity Date : 2018-09-30
    Maturity Price : 25.00
    Evaluated at bid price : 25.55
    Bid-YTW : 4.13 %
    ENB.PF.G FixedReset -1.15 % YTW SCENARIO
    Maturity Type : Limit Maturity
    Maturity Date : 2044-12-04
    Maturity Price : 23.09
    Evaluated at bid price : 24.92
    Bid-YTW : 4.06 %
    FTS.PR.J Perpetual-Discount 1.03 % YTW SCENARIO
    Maturity Type : Limit Maturity
    Maturity Date : 2044-12-04
    Maturity Price : 24.04
    Evaluated at bid price : 24.45
    Bid-YTW : 4.86 %
    IAG.PR.A Deemed-Retractible 1.24 % YTW SCENARIO
    Maturity Type : Hard Maturity
    Maturity Date : 2025-01-31
    Maturity Price : 25.00
    Evaluated at bid price : 23.75
    Bid-YTW : 5.23 %
    Volume Highlights
    Issue Index Shares
    Traded
    Notes
    ENB.PR.P FixedReset 521,700 Desjardins sold 18,500 to Scotia at 24.10, then blocks of 125,500 shares, 241,000 shares, 15,600 and 16,000 to anonymous, all at 24.00, and finally crossed 65,200 at 24.00. Nice tickets!
    YTW SCENARIO
    Maturity Type : Limit Maturity
    Maturity Date : 2044-12-04
    Maturity Price : 22.80
    Evaluated at bid price : 23.92
    Bid-YTW : 4.01 %
    ENB.PF.C FixedReset 199,713 Desjardins sold blocks of 111,200 and 55,200 to anonymous at 25.00.
    YTW SCENARIO
    Maturity Type : Limit Maturity
    Maturity Date : 2044-12-04
    Maturity Price : 23.13
    Evaluated at bid price : 24.96
    Bid-YTW : 4.01 %
    TRP.PR.A FixedReset 157,332 TD crossed 14,300 at 21.40 and 20,000 at 21.35. RBC crossed 37,300 at 21.40.
    YTW SCENARIO
    Maturity Type : Limit Maturity
    Maturity Date : 2044-12-04
    Maturity Price : 21.39
    Evaluated at bid price : 21.39
    Bid-YTW : 3.85 %
    MFC.PR.N FixedReset 120,750 Recent new issue.
    YTW SCENARIO
    Maturity Type : Hard Maturity
    Maturity Date : 2025-01-31
    Maturity Price : 25.00
    Evaluated at bid price : 25.06
    Bid-YTW : 3.73 %
    ENB.PF.E FixedReset 67,617 National crossed 26,000 at 25.10.
    YTW SCENARIO
    Maturity Type : Limit Maturity
    Maturity Date : 2044-12-04
    Maturity Price : 23.07
    Evaluated at bid price : 24.82
    Bid-YTW : 4.06 %
    ENB.PF.G FixedReset 37,700 RBC bought 11,500 from anonymous at 25.10.
    YTW SCENARIO
    Maturity Type : Limit Maturity
    Maturity Date : 2044-12-04
    Maturity Price : 23.09
    Evaluated at bid price : 24.92
    Bid-YTW : 4.06 %
    There were 29 other index-included issues trading in excess of 10,000 shares.
    Wide Spread Highlights
    Issue Index Quote Data and Yield Notes
    PVS.PR.C SplitShare Quote: 25.90 – 26.90
    Spot Rate : 1.0000
    Average : 0.5898

    YTW SCENARIO
    Maturity Type : Call
    Maturity Date : 2015-12-10
    Maturity Price : 25.50
    Evaluated at bid price : 25.90
    Bid-YTW : 3.16 %

    BAM.PF.E FixedReset Quote: 25.25 – 26.25
    Spot Rate : 1.0000
    Average : 0.5928

    YTW SCENARIO
    Maturity Type : Limit Maturity
    Maturity Date : 2044-12-04
    Maturity Price : 23.22
    Evaluated at bid price : 25.25
    Bid-YTW : 3.93 %

    HSE.PR.A FixedReset Quote: 19.61 – 20.36
    Spot Rate : 0.7500
    Average : 0.4868

    YTW SCENARIO
    Maturity Type : Limit Maturity
    Maturity Date : 2044-12-04
    Maturity Price : 19.61
    Evaluated at bid price : 19.61
    Bid-YTW : 4.06 %

    PWF.PR.P FixedReset Quote: 21.50 – 22.19
    Spot Rate : 0.6900
    Average : 0.4603

    YTW SCENARIO
    Maturity Type : Limit Maturity
    Maturity Date : 2044-12-04
    Maturity Price : 21.50
    Evaluated at bid price : 21.50
    Bid-YTW : 3.58 %

    ENB.PR.Y FixedReset Quote: 22.75 – 23.10
    Spot Rate : 0.3500
    Average : 0.2344

    YTW SCENARIO
    Maturity Type : Limit Maturity
    Maturity Date : 2044-12-04
    Maturity Price : 22.14
    Evaluated at bid price : 22.75
    Bid-YTW : 4.17 %

    BAM.PR.T FixedReset Quote: 25.02 – 25.49
    Spot Rate : 0.4700
    Average : 0.3566

    YTW SCENARIO
    Maturity Type : Limit Maturity
    Maturity Date : 2044-12-04
    Maturity Price : 23.52
    Evaluated at bid price : 25.02
    Bid-YTW : 3.73 %

    Market Action

    December 3, 2014

    The BoC announced its rate decision:

    The Bank of Canada today announced that it is maintaining its target for the overnight rate at 1 per cent. The Bank Rate is correspondingly 1 1/4 per cent and the deposit rate is 3/4 per cent.

    Inflation has risen by more than expected. The increase in inflation over the past year is largely due to the temporary effects of a lower Canadian dollar and some sector-specific factors, notably telecommunications and meat prices. Underlying inflation has edged up but remains below 2 per cent.

    The U.S. economy has clearly strengthened, particularly business investment, which has benefitted Canada’s exports. Growth in the rest of the world, in contrast, continues to disappoint, leading authorities in some regions to deploy further policy stimulus. Oil prices have continued to fall, due to both supply and demand developments. In this context, global financial conditions have eased further.

    Canada’s economy is showing signs of a broadening recovery. Stronger exports are beginning to be reflected in increased business investment and employment. This suggests that the hoped-for sequence of rebuilding that will lead to balanced and self-sustaining growth may finally have begun. However, the lower profile for oil and certain other commodity prices will weigh on the Canadian economy.

    The net effect of these recent developments, together with upward revisions to historical data, is that the output gap appears to be smaller than the Bank had projected in the October Monetary Policy Report (MPR). However, the labour market continues to indicate significant slack in the economy.

    While inflation is at a higher starting point relative to the October MPR, weaker oil prices pose an important downside risk to the inflation profile. This is tempered by a stronger U.S. economy, Canadian dollar depreciation, and recent federal fiscal measures. Household imbalances, meanwhile, present a significant risk to financial stability. Overall, the balance of risks remains within the zone for which the current stance of monetary policy is appropriate and therefore the target for the overnight rate remains at 1 per cent.

    One pundit thinks the bank is preparing for a rate hike in 2015:

    RBC Dominion Securities economist Mark Chandler said fading economic slack is “an important part of laying the groundwork for higher rates in 2015.”

    … and household debt is increasing:

    The central bank has oft cited this threat as household debt burdens rose to record levels. Its latest red flag went up on the same day as two reports underscored the swollen debts among Canadians just as the holiday shopping frenzy begins.

    In one report, Equifax Canada said that “Canadian consumers have yet again tipped the scales setting a new benchmark of over $1.513-trillion in debt.”

    That third-quarter figure marked an increase from $1.448-trillion in the second quarter and $1.409-trillion a year earlier, according to Equifax, whose numbers are based on more than 25 million unique consumer files.

    Excluding mortgages, average debt held by Canadians has increased 2.7 per cent to $20,891.

    There is a bright spot, however, in that delinquency rates declined.

    Co-operators General Insurance Company, proud issuer of CCS.PR.C was confirmed at Pfd-3(high) by DBRS:

    The Co-operators Group, by tradition, has strong presence in rural markets and obtains excellent brand recognition. The property and casualty operations rank in the top six by premiums in Canada. The Group is making efforts to achieve client growth in Québec and is utilizing direct response marketing in Ontario and Alberta. The Group maintains conservative regulatory capital ratios, which supports the rating given the capital raising constraints of a cooperative.

    The general insurance business has had difficulty keeping combined ratios at acceptable levels for the rating. The Company is looking at better segmentation to improve results and has been investing in technology and process improvement to achieve a better customer experience. Financial leverage is at reasonable level and supportive of the rating.

    Fairfax Financial Holdings Limited, proud issuer of FFH.PR.C, FFH.PR.E, FFH.PR.G, FFH.PR.I and FFH.PR.K, was confirmed at Pfd-3 by DBRS:

    Over the long term, Fairfax has generally achieved strong investment results on the investment portfolios it manages for its insurance subsidiaries. With willingness to take advantage of market disruptions and distressed valuations for particular securities and purchase hedges against general market downturns versus the actual portfolio investments, the active investment management generates volatile financial results.

    Financial leverage (preferred shares and debt-to-total capital), although declining from September 2013, remains at the upper range for the rating in the mid-thirties. Fixed charge coverage ratios have been very low for the last few years, with low profitability, but the year-to-date (September 2014) results have yielded a desirable ratio. The Company maintains a minimum balance of $1 billion in cash and marketable securities at the holding company for liquidity and contingent subsidiary capital needs, which is viewed as prudent given the earnings volatility.

    The Company’s management culture places a high reliance on local management to manage their businesses prudently. The decentralized structure has allowed Fairfax to grow by acquisition globally to take advantage of profitable niches held by existing businesses. DBRS realizes this decentralized management structure contrasts sharply with most Canadian financial institutions, but notes that, if done correctly and with the right businesses and people, it can be a successful strategy, which the Company has been able to demonstrate.

    HSBC Bank Canada, proud issuer of HSB.PR.C and HSB.PR.D, has been confirmed at Pfd-2 by DBRS (for NVCC non-compliant shares):

    With Canada being a priority market for the HSBC Group, HSBC Bank Canada benefits from the strength of the Parent and the international capabilities and relationships of one of the largest banking groups in the world. HSBC has good intrinsic strengths, including its low cost-to-income ratio and superior customer service model, somewhat offset by geographic and industry concentrations, its historically higher interest-rate risk tolerance and scale challenges in its retail banking and wealth management businesses.

    The Bank continues to execute on its strategy of growing its Commercial Banking and its Global Banking and Markets segments. At the same time, HSBC has made strides to increase presence with credit cards, mortgages and wealth products, particularly with its globally affluent customers. Earnings have continued to be good, with ROE in the mid-teens and risk metrics strong, although somewhat lumpy due to the proportions of commercial and wholesale lending.

    Notable business changes over the past couple of years are largely complete, allowing the Bank to concentrate on its strategy, although implementing HSBC Group-wide improvements in compliance and risk controls may continue to occupy management attention. The run-off of the consumer finance portfolio is proceeding as planned, as is the repositioning of business banking towards clients with multi-product opportunities and lower compliance risk.

    It was a poor day for the Canadian preferred share market, with PerpetualDiscounts losing 20bp, FixedResets off 8bp and DeemedRetractibles down 11bp. Volatility was minor, but exciting anyway. Volume was slightly below average.

    HIMIPref™ Preferred Indices
    These values reflect the December 2008 revision of the HIMIPref™ Indices

    Values are provisional and are finalized monthly
    Index Mean
    Current
    Yield
    (at bid)
    Median
    YTW
    Median
    Average
    Trading
    Value
    Median
    Mod Dur
    (YTW)
    Issues Day’s Perf. Index Value
    Ratchet 0.00 % 0.00 % 0 0.00 0 -0.2134 % 2,517.4
    FixedFloater 0.00 % 0.00 % 0 0.00 0 -0.2134 % 3,985.6
    Floater 2.99 % 3.11 % 63,840 19.39 4 -0.2134 % 2,676.2
    OpRet 4.39 % -12.05 % 27,216 0.08 2 0.0782 % 2,760.6
    SplitShare 4.27 % 3.63 % 43,605 3.75 5 0.1347 % 3,195.7
    Interest-Bearing 0.00 % 0.00 % 0 0.00 0 0.0782 % 2,524.3
    Perpetual-Premium 5.42 % -2.85 % 75,995 0.09 20 0.1387 % 2,485.9
    Perpetual-Discount 5.14 % 5.03 % 116,328 15.40 15 -0.2037 % 2,668.6
    FixedReset 4.17 % 3.57 % 193,501 8.63 74 -0.0849 % 2,577.4
    Deemed-Retractible 4.97 % -0.75 % 98,012 0.16 40 -0.1128 % 2,613.5
    FloatingReset 2.54 % 1.89 % 60,591 3.49 5 -0.1097 % 2,548.6
    Performance Highlights
    Issue Index Change Notes
    HSE.PR.A FixedReset -5.09 % This is a real drop, since several trades were executed below 20.50, but the volume around these levels (about 1,600 shares, late in the day) was low relative to the day’s trading of 19,629 shares. The VWAP was $20.99. The weakness is probably related to yesterday’s new issue announcement.
    YTW SCENARIO
    Maturity Type : Limit Maturity
    Maturity Date : 2044-12-03
    Maturity Price : 20.50
    Evaluated at bid price : 20.50
    Bid-YTW : 3.88 %
    BAM.PF.D Perpetual-Discount -1.46 % YTW SCENARIO
    Maturity Type : Limit Maturity
    Maturity Date : 2044-12-03
    Maturity Price : 21.90
    Evaluated at bid price : 22.23
    Bid-YTW : 5.60 %
    Volume Highlights
    Issue Index Shares
    Traded
    Notes
    MFC.PR.N FixedReset 707,152 New issue settled today.
    YTW SCENARIO
    Maturity Type : Hard Maturity
    Maturity Date : 2025-01-31
    Maturity Price : 25.00
    Evaluated at bid price : 25.07
    Bid-YTW : 3.72 %
    TRP.PR.A FixedReset 281,206 Scotia crossed 177,100 at 21.27. Will reset at 3.266% December 31.YTW SCENARIO
    Maturity Type : Limit Maturity
    Maturity Date : 2044-12-03
    Maturity Price : 21.33
    Evaluated at bid price : 21.33
    Bid-YTW : 3.86 %
    ENB.PR.P FixedReset 71,210 RBC crossed 50,000 at 24.30.
    YTW SCENARIO
    Maturity Type : Limit Maturity
    Maturity Date : 2044-12-03
    Maturity Price : 22.93
    Evaluated at bid price : 24.23
    Bid-YTW : 3.95 %
    ENB.PF.C FixedReset 62,053 RBC crossed 50,000 at 25.20.
    YTW SCENARIO
    Maturity Type : Limit Maturity
    Maturity Date : 2044-12-03
    Maturity Price : 23.21
    Evaluated at bid price : 25.20
    Bid-YTW : 3.96 %
    FTS.PR.M FixedReset 60,325 Nesbitt crossed 50,000 at 25.65.
    YTW SCENARIO
    Maturity Type : Call
    Maturity Date : 2019-12-01
    Maturity Price : 25.00
    Evaluated at bid price : 25.57
    Bid-YTW : 3.62 %
    FTS.PR.H FixedReset 57,062 Nesbitt crossed 50,000 at 20.40.
    YTW SCENARIO
    Maturity Type : Limit Maturity
    Maturity Date : 2044-12-03
    Maturity Price : 20.35
    Evaluated at bid price : 20.35
    Bid-YTW : 3.50 %
    There were 27 other index-included issues trading in excess of 10,000 shares.
    Wide Spread Highlights
    Issue Index Quote Data and Yield Notes
    SLF.PR.G FixedReset Quote: 20.55 – 20.90
    Spot Rate : 0.3500
    Average : 0.2382

    YTW SCENARIO
    Maturity Type : Hard Maturity
    Maturity Date : 2025-01-31
    Maturity Price : 25.00
    Evaluated at bid price : 20.55
    Bid-YTW : 5.10 %

    MFC.PR.H FixedReset Quote: 26.00 – 26.45
    Spot Rate : 0.4500
    Average : 0.3496

    YTW SCENARIO
    Maturity Type : Call
    Maturity Date : 2017-03-19
    Maturity Price : 25.00
    Evaluated at bid price : 26.00
    Bid-YTW : 2.71 %

    BAM.PR.T FixedReset Quote: 25.26 – 25.59
    Spot Rate : 0.3300
    Average : 0.2323

    YTW SCENARIO
    Maturity Type : Limit Maturity
    Maturity Date : 2044-12-03
    Maturity Price : 23.60
    Evaluated at bid price : 25.26
    Bid-YTW : 3.68 %

    FTS.PR.J Perpetual-Discount Quote: 24.20 – 24.55
    Spot Rate : 0.3500
    Average : 0.2582

    YTW SCENARIO
    Maturity Type : Limit Maturity
    Maturity Date : 2044-12-03
    Maturity Price : 23.81
    Evaluated at bid price : 24.20
    Bid-YTW : 4.92 %

    SLF.PR.D Deemed-Retractible Quote: 22.96 – 23.24
    Spot Rate : 0.2800
    Average : 0.1897

    YTW SCENARIO
    Maturity Type : Hard Maturity
    Maturity Date : 2025-01-31
    Maturity Price : 25.00
    Evaluated at bid price : 22.96
    Bid-YTW : 5.49 %

    IFC.PR.A FixedReset Quote: 24.34 – 24.65
    Spot Rate : 0.3100
    Average : 0.2234

    YTW SCENARIO
    Maturity Type : Hard Maturity
    Maturity Date : 2025-01-31
    Maturity Price : 25.00
    Evaluated at bid price : 24.34
    Bid-YTW : 3.90 %

    Market Action

    December 2, 2014

    They’re playing a sad song in Australia:

    Australia’s economy expanded slower than economists forecast in the third quarter, underscoring the central bank’s decision to keep interest rates at a record low. The currency fell to its lowest since July 2010.

    Gross domestic product advanced 0.3 percent from the previous three months, when it rose 0.5 percent, a Bureau of Statistics report released in Sydney today showed. The result compared with a median estimate of a 0.7 percent gain from a Bloomberg News survey of 29 economists.

    The Reserve Bank of Australia has kept its benchmark rate unchanged at a record low for 16 months as it seeks to encourage spending by consumers and companies to offset falling mining investment. Australian firms, outside of property, have opted to pay dividends or salt away cash rather than invest in new projects as they wait for higher household demand, which has been damped by an 11-year-high unemployment rate.

    and there are funding cuts all over:

    Funding cuts at Australia’s leading scientific institution CSIRO have led to world-leading researchers seeing their positions abolished. At least one of these, Dr. San Thang, is so committed to his work that he has continued his role unpaid. What makes the story even more poignant is that at the same time Thang was let go, there was speculation he might share a Nobel Prize in Chemistry.

    … and the same tune in Russia:

    Russia’s economic crisis deepened as the government acknowledged it’s heading for recession and a former central banker spoke of “some panic” in the financial system as oil prices plunged.

    Speaking a day after President Vladimir Putin said Russia is scrapping a proposed $45 billion pipeline to Europe, the government predicted the economy will contract next year and canceled a bond auction. It was also forced to pledge 39.95 billion rubles ($740 million) to support OAO Gazprombank, at least the third lender to secure a capital injection since U.S. and European Union sanctions curbed their ability to borrow.

    SBN.PR.A was confirmed at Pfd-3 by DBRS:

    Based on the most recent dividend paid on the BNS Shares, the dividend income net of management fees and other expenses is expected to cover approximately 47% of the Preferred Share distributions. Holders of the Class A Shares are expected to receive regular monthly cash distributions in an amount targeted to be 6% per annum on the net asset value of the Class A Shares.

    On September 5, 2014, DBRS confirmed the ratings of the Preferred Shares at Pfd-3. Since then, the performance of the Company has been volatile, with downside protection decreasing since the last rating action in September 2014 (50.3% as of November 20, 2014). Despite the drop, downside protection remain at levels typically seen at the Pfd-3 level.

    It was a mixed day for the Canadian preferred share market, with PerpetualDiscounts down 18bp, FixedResets off 12bp and DeemedRetractibles gaining 7bp. Volatility was average, dominated by FixedReset losers. Volume was above average.

    HIMIPref™ Preferred Indices
    These values reflect the December 2008 revision of the HIMIPref™ Indices

    Values are provisional and are finalized monthly
    Index Mean
    Current
    Yield
    (at bid)
    Median
    YTW
    Median
    Average
    Trading
    Value
    Median
    Mod Dur
    (YTW)
    Issues Day’s Perf. Index Value
    Ratchet 0.00 % 0.00 % 0 0.00 0 0.1710 % 2,522.8
    FixedFloater 0.00 % 0.00 % 0 0.00 0 0.1710 % 3,994.1
    Floater 2.99 % 3.10 % 62,509 19.41 4 0.1710 % 2,681.9
    OpRet 4.40 % -12.64 % 26,659 0.08 2 -0.0391 % 2,758.5
    SplitShare 4.28 % 3.85 % 45,402 3.75 5 0.0820 % 3,191.4
    Interest-Bearing 0.00 % 0.00 % 0 0.00 0 -0.0391 % 2,522.4
    Perpetual-Premium 5.42 % -7.85 % 76,863 0.09 20 -0.0391 % 2,482.4
    Perpetual-Discount 5.13 % 5.06 % 113,667 15.37 15 -0.1807 % 2,674.1
    FixedReset 4.17 % 3.55 % 177,070 8.51 73 -0.1158 % 2,579.6
    Deemed-Retractible 4.97 % -1.97 % 98,743 0.16 40 0.0703 % 2,616.5
    FloatingReset 2.53 % 1.20 % 60,844 0.16 5 -0.1252 % 2,551.4
    Performance Highlights
    Issue Index Change Notes
    TRP.PR.B FixedReset -1.79 % YTW SCENARIO
    Maturity Type : Limit Maturity
    Maturity Date : 2044-12-02
    Maturity Price : 18.07
    Evaluated at bid price : 18.07
    Bid-YTW : 3.70 %
    FTS.PR.K FixedReset -1.31 % YTW SCENARIO
    Maturity Type : Limit Maturity
    Maturity Date : 2044-12-02
    Maturity Price : 23.14
    Evaluated at bid price : 24.77
    Bid-YTW : 3.46 %
    SLF.PR.G FixedReset -1.15 % YTW SCENARIO
    Maturity Type : Hard Maturity
    Maturity Date : 2025-01-31
    Maturity Price : 25.00
    Evaluated at bid price : 20.70
    Bid-YTW : 5.01 %
    GWO.PR.Q Deemed-Retractible 1.19 % YTW SCENARIO
    Maturity Type : Hard Maturity
    Maturity Date : 2025-01-31
    Maturity Price : 25.00
    Evaluated at bid price : 25.41
    Bid-YTW : 4.92 %
    Volume Highlights
    Issue Index Shares
    Traded
    Notes
    W.PR.J Perpetual-Premium 120,100 Desjardins bought 115,800 from anonymous at 25.18.
    YTW SCENARIO
    Maturity Type : Call
    Maturity Date : 2015-01-01
    Maturity Price : 25.00
    Evaluated at bid price : 25.24
    Bid-YTW : 2.86 %
    CU.PR.E Perpetual-Discount 77,000 Nesbitt crossed 75,000 at 24.60.
    YTW SCENARIO
    Maturity Type : Limit Maturity
    Maturity Date : 2044-12-02
    Maturity Price : 24.09
    Evaluated at bid price : 24.51
    Bid-YTW : 5.01 %
    TRP.PR.A FixedReset 41,583 Will reset 2014-12-31 to 3.266%
    YTW SCENARIO
    Maturity Type : Limit Maturity
    Maturity Date : 2044-12-02
    Maturity Price : 21.15
    Evaluated at bid price : 21.15
    Bid-YTW : 3.90 %
    BMO.PR.S FixedReset 40,194 Nesbitt crossed 36,700 at 25.52.
    YTW SCENARIO
    Maturity Type : Call
    Maturity Date : 2019-05-25
    Maturity Price : 25.00
    Evaluated at bid price : 25.50
    Bid-YTW : 3.55 %
    TRP.PR.D FixedReset 36,067 YTW SCENARIO
    Maturity Type : Limit Maturity
    Maturity Date : 2044-12-02
    Maturity Price : 23.31
    Evaluated at bid price : 25.30
    Bid-YTW : 3.65 %
    BMO.PR.J Deemed-Retractible 30,335 Nesbitt crossed 25,600 at 25.79.
    YTW SCENARIO
    Maturity Type : Call
    Maturity Date : 2015-01-01
    Maturity Price : 25.50
    Evaluated at bid price : 25.75
    Bid-YTW : -6.35 %
    There were 36 other index-included issues trading in excess of 10,000 shares.
    Wide Spread Highlights
    Issue Index Quote Data and Yield Notes
    GWO.PR.I Deemed-Retractible Quote: 23.20 – 23.68
    Spot Rate : 0.4800
    Average : 0.3165

    YTW SCENARIO
    Maturity Type : Hard Maturity
    Maturity Date : 2025-01-31
    Maturity Price : 25.00
    Evaluated at bid price : 23.20
    Bid-YTW : 5.41 %

    NEW.PR.D SplitShare Quote: 32.69 – 33.45
    Spot Rate : 0.7600
    Average : 0.6146

    YTW SCENARIO
    Maturity Type : Call
    Maturity Date : 2015-06-26
    Maturity Price : 32.07
    Evaluated at bid price : 32.69
    Bid-YTW : 2.09 %

    MFC.PR.H FixedReset Quote: 26.07 – 26.45
    Spot Rate : 0.3800
    Average : 0.2395

    YTW SCENARIO
    Maturity Type : Call
    Maturity Date : 2017-03-19
    Maturity Price : 25.00
    Evaluated at bid price : 26.07
    Bid-YTW : 2.58 %

    MFC.PR.C Deemed-Retractible Quote: 23.21 – 23.50
    Spot Rate : 0.2900
    Average : 0.2095

    YTW SCENARIO
    Maturity Type : Hard Maturity
    Maturity Date : 2025-01-31
    Maturity Price : 25.00
    Evaluated at bid price : 23.21
    Bid-YTW : 5.43 %

    FTS.PR.K FixedReset Quote: 24.77 – 25.00
    Spot Rate : 0.2300
    Average : 0.1686

    YTW SCENARIO
    Maturity Type : Limit Maturity
    Maturity Date : 2044-12-02
    Maturity Price : 23.14
    Evaluated at bid price : 24.77
    Bid-YTW : 3.46 %

    PWF.PR.L Perpetual-Premium Quote: 25.24 – 25.45
    Spot Rate : 0.2100
    Average : 0.1510

    YTW SCENARIO
    Maturity Type : Call
    Maturity Date : 2015-10-31
    Maturity Price : 25.00
    Evaluated at bid price : 25.24
    Bid-YTW : 4.54 %