The SEC is gleefully trumpeting its contribution to market inefficiency:
An SEC investigation found that Athena Capital Research used an algorithm that was code-named Gravy to engage in a practice known as “marking the close” in which stocks are bought or sold near the close of trading to affect the closing price. The massive volumes of Athena’s last-second trades allowed Athena to overwhelm the market’s available liquidity and artificially push the market price – and therefore the closing price – in Athena’s favor. Athena was acutely aware of the price impact of its algorithmic trading, calling it “owning the game” in internal e-mails.
…
The SEC’s order finds that Athena’s manipulative scheme focused on trading in order imbalances in securities at the close of the trading day. Imbalances occur when there are more orders to buy shares than to sell shares (or vice versa) at the close for any given stock. Every day at the close of trading, NASDAQ runs a closing auction to fill all on-close orders at the best price, one that is not too distant from the price of the stock just before the close. Athena placed orders to fill imbalances in securities at the close of trading, and then traded or “accumulated” shares on the continuous market on the opposite side of its order.
According to the SEC’s order, Athena’s algorithmic strategies became increasingly focused on ensuring that the firm was the dominant firm – and sometimes the only one – trading desirable stock imbalances at the end of each trading day. The firm implemented additional algorithms known as “Collars” to ensure that Athena’s orders received priority over other orders when trading imbalances. These eventually resulted in Athena’s imbalance-on-close orders being at least partially filled more than 98 percent of the time. Athena’s ability to predict that it would get filled on almost every imbalance order allowed the firm to unleash its manipulative Gravy algorithm to trade tens of thousands of stocks right before the close of trading. As a result, these stocks traded at artificial prices that NASDAQ then used to set the closing prices for on-close orders as part of its closing auction. Athena’s high frequency trading scheme enabled its orders to be executed at more favorable prices.
Athena did not admit or deny the charges, so in the first place this is clearly just another example of regulatory extortion.
But in addition I fail to see anything wrong with the substance of the matter. In order for this to work, we need a situation at the end of the day where the total density of offers (bids) is small relative to the number of imbalanced buy-on-close (sell-on-close) orders; that is to say, if there is only 100 shares buy-on-close imbalance, then it makes no sense to buy 1,000 shares immediately prior to move the price by a dime. On the other hand, it makes all kinds of sense the other way ’round.
So think about it. There’s an issue that might have – for instance – ten blocks of 500 shares each offered at penny increments. And somebody puts in a buy-on-close order for 10,000 shares. There’s a technical term that may be used for a person like this: “moron”.
I cannot think of any legitimate reason for a portfolio manager – even if it’s granny, managing her $20,000 portfolio – to use ‘on close’ orders. The best illegitimate reason I can think of is the manager of an index fund wanting to make absolutely certain that his trade will not affect the tracking error of the portfolio; and what this does is cost his investors money, not because of tracking error, but because the index itself has lost money relative to what otherwise would have been the case. So the PM and his moronic investors (one party or the other has to be moronic!) are getting burned due to the pursuit of a trading strategy that pays no attention whatsoever to the fundamentals of what they are doing.
And, I claim, that is a Good Thing.
This happens all the time with the major indices due to pre-announcement of index changes. Say an issue gets added to the index. The price should go up, right? Supply and demand. But what happens is that it’s pre-announced, so the price goes up during the interim period and the index funds can buy in gradually, while the index itself buys at the higher price. So what we get is reduced, possibly even negative, tracking costs … but the index underperforms what its returns would have been had there been no pre-announcement.
But the index fund sponsor can then take out large advertisements touting their low tracking errors and investors can hide their heads in the sand regarding the performance of their index relative to an honestly calculated meta-inde, which is always a very popular investment strategy.
It’s too bad for Athena, which presumably was offered a choice between paying $1-million to the SEC or paying $2-million to their lawyers and getting randomly chosen for the next 17 completely randomized in-depth compliance examinations. But Assiduous Readers will note the similarities between this case and the various scandal-shock-horror stories about moronic portfolio managers entering stupid orders to be filled at the fixing price in the gold market (discussed February 27, 2014) and in the LIBOR market (discussed December 19, 2012) and in the FX market (discussed September 16, 2014); the regulators needed a villain and chose Athena. After all, stupid, lazy people must be protected. Isn’t that what capital markets are for?
Matt Levine of Bloomberg takes a harsher view:
At 3:50 p.m., Nasdaq tells everyone that, say, there’s a buy imbalance of 224,638 shares of EBay at its current trading price of $23.55. That means that, if trading stopped right there and the closing auction was held at 3:50, there would be more buyers than sellers at $23.55, and the closing price would be $23.60 or $23.65 or $24 or something, and the close would look very volatile.
But trading doesn’t stop right there. There’s still 10 minutes left. And what happens is, people step in to fix the imbalance. They say: OK, if the auction really has 224,638 more buyers than sellers, I will sell those 224,638 shares. (This is called an “Imbalance-Only-On-Close Order.”) And then they go out and buy those 224,638 shares in the continuous market over the next 10 minutes. They buy from people who want to sell now, in order to sell to people who want to buy later.
This is a classic market-making function. The people doing this — and they’re not really people, they’re algorithmic high-frequency trading firms — are intermediating across time. There are sellers now, there are buyers later, and the HFT market-makers buy from the sellers and sell to the buyers, giving everyone a smoother and fairer and more informative price.
…
Basically you’ll notice in what I described that the market maker buys at its average price, and then sells at its final price. It has incentives to make those prices as different as possible. One way to make those prices different is to try to buy really efficiently, so you buy at a low average price. Another way to make the prices different is to make the final price really sloppy and inefficient, so you sell at a high final price. That’s what Athena did: It bought about half of the shares it was going to buy smoothly over the last nine minutes and 58 seconds, getting a reasonable average price on half of the shares. That’s “Meat.” Then it would buy the other half sloppily in the last two seconds, pushing up the final price really high and leading to a high sale price. That’s “Gravy.” Gravy is how it made its money.
Speaking of idiotic regulation, there appears to be some consensus that price transparency for bonds is a good thing:
Arguably, the U.S. already has a big lead on Canada in that regard because of the TRACE system that FINRA runs. Dealers have to report corporate bond trades to TRACE. That data is then available to market users through financial information providers.
Why doesn’t Canada have an equivalent, challenged another panelist, markets entrepreneur Doug Steiner?
The answer, [executive director and chief operating officer of the Ontario Securities Commission] Ms. [Maureen] Jensen said, is twofold. There’s the fragmentation of the regulatory landscape in Canada, and the concentration of dealers.
That of course is a reference to the fact that the biggest bond dealers in Canada are a handful of bank-owned firms. They have every incentive not to share such data, because it will cut into profits.
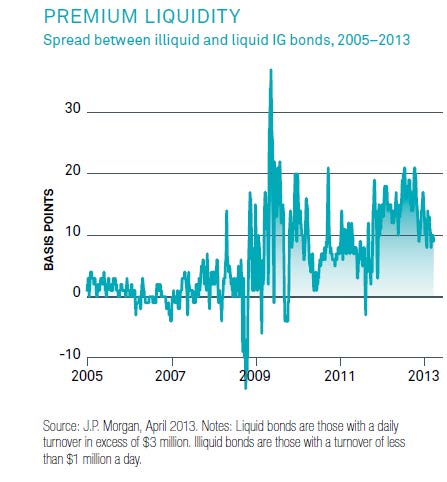
First, it might be really nice if the implications of transparency were investigated, or thought about, or, hell, I’d be happy with a simple “acknowledge” at this point. Price transparency invariably leads to smaller inventories and thinner, more brittle markets. In the corporate bond market as a whole, it has led to an increased proportion of exempt, non-public, issues and to the rise of Credit Default Swaps. But who cares? Teacher didn’t talk about that in kindergarten; teacher talked about being nice to each other.
I will take some solace in the idea that this is beginning to get noticed:
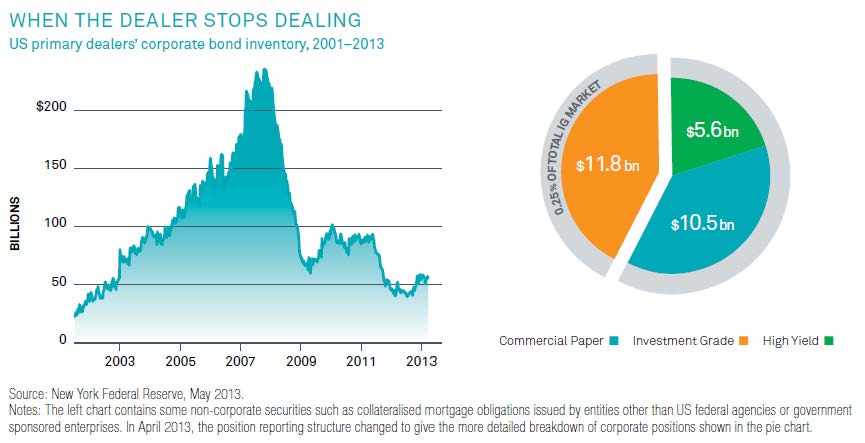
Corporate bond values are swinging the most in more than a year and here’s one reason why: Wall Street’s biggest banks are following the crowd and selling, too.
Take junk bonds, which have lost 2 percent in the past month. Dealers, which traditionally used their own money to take bonds off clients desperate to sell during sinking markets, sold a net $2 billion of the securities during the period, according to data compiled by Trace, the bond-price reporting system of the Financial Industry Regulatory Authority.
Banks have cut debt holdings in the face of higher capital requirements and curbs of proprietary trading under the U.S. Dodd-Frank Act’s Volcker Rule. Their lack of desire to take risks has had the unintended consequence of exacerbating price swings amid the rout now, said Jon Breuer, a credit trader at Peridiem Global Investors LLC in Los Angeles, California.
…
Prices will probably keep swinging until it looks like the global economy’s regaining its footing. Or until investors gain faith that central banks can save the day, once again.
Just don’t count on Wall Street dealers to prop up the market. Those days appear to be over.
Soon every day will look like the credit crunch, in which a ridiculously thin market in Asset Backed Securities went ridiculously low … leading to apparent capital problems … leading to a crisis … leading to increased hiring of regulators … oh.
Meanwhile, the economy is looking so dismal there are informed calls for more quantitative easing:
Federal Reserve Bank of St. Louis President James Bullard challenged his fellow central bankers to honor pledges to adjust bond purchases in response to incoming economic reports and to keep inflation stable.
Bullard said the Fed should consider delaying plans to end its bond-buying program at the end of this month to halt a decline in expected inflation. The Fed has tapered purchases to $15 billion a month from $85 billion in December 2012.
“We said the taper was data dependent,” he said in an interview today in Washington. The Fed’s message should be that “we are watching and we’re ready and we are willing to do things to defend our inflation target.”
Bullard’s comments reflect growing concern among Fed policy makers that global economic weakness threatens to push inflation in the U.S. to dangerously low levels. His worries may be reflected in the Fed’s next policy statement, even if his proposal to extend asset purchases isn’t adopted, said Jonathan Wright, a former central bank official.
Assiduous Reader Nestor asked in yesterday’s comments:
James, is is safe to say, all things being equal, that the preferred shares will react positively to the lower treasury and corporate yields?
Yes. No. Maybe. It depends. The correlation between treasury and corporate yields will depend largely on what is driving the changes in yield. If the concern is “interest rates”, then these yields should move together and correlations should increase. If the concern is “credit”, then yields will be unrelated – or even negatively related – and correlations will decrease.
For example, consider this chart originally published in the August, 2009, edition of PrefLetter:
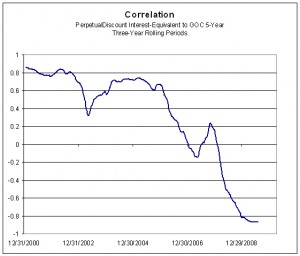 Click for Big
Some changes, eh? Correlation analysis can be useful, but it is all too often used as a substitute for analysis rather than as an aid, with results that are often grievous and always funny.
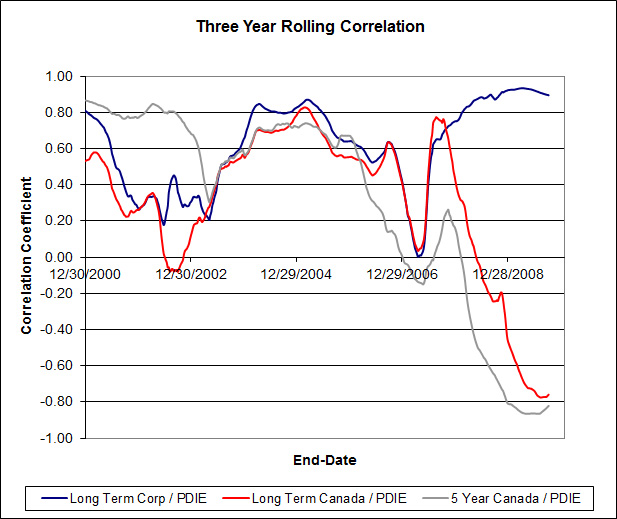
Another chart that offers hours of amusement is:
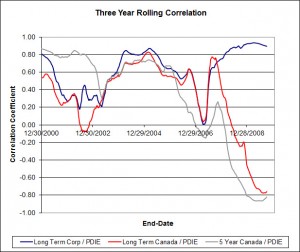 Click for Big
In the above chart, “PDIE” stands for “Perpetual Discount Interest Equivalent”. You can see that although the correlation with corporate bonds is generally pretty good, that is not always the case – and certainly not on a day-to-day basis. On the other hand, Assiduous Readers will note that by-and-large, the “Seniority Spread” (interest-equivalent yield of PerpetualDiscounts less yield of long corporate bonds) is generally pretty stable – which is not to say “always” pretty stable, nor is it to say “unchanging for decades”.
Another question resulting from yesterday’s post came from Assiduous Reader prefQC, who asked:
I’ve been following (with interest!) your blogs on a regular basis for over a year now. However, I am struck by the fact that you virtually always qualify the overall daily trading volume as “low”, “very awfully low”, “below average” etc. — it is very rarely “high”. So then, just what is your definition of “average” trading volume ?
I answered the question in a strict definitional sense, but I have two representative pictures I’d like to show you:
Average Daily Volume CIU.PR.C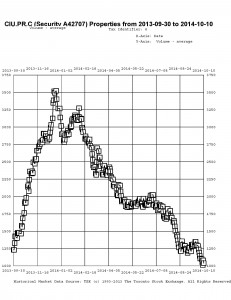 Click for Big
Average Daily Volume ELF.PR.G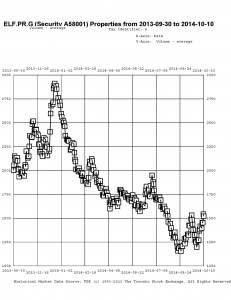
Click for Big
So you can see that the Average Daily Volume calculated by HIMIPref™ (an exponential moving average that is adjusted to reduce the impact of single day spikes in volume) for CIU.PR.C and ELF.PR.G has declined precipitously over the past six months odd. While I do not compute more general gauges of daily volume (why would I?) it is my anecdotal hypothesis that these two charts are representative of a large swath of the preferred share market, and thus there have been an increasing number of ‘low volume’ days in 2014. Maybe I’ll have to revise my definitions of ‘low volume’!
********************* Update ****************
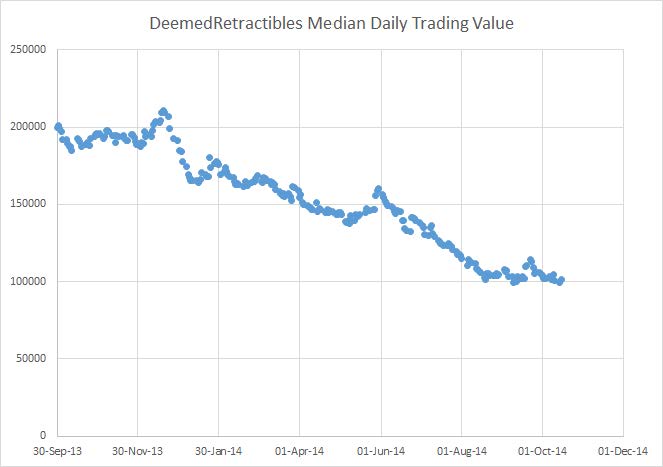
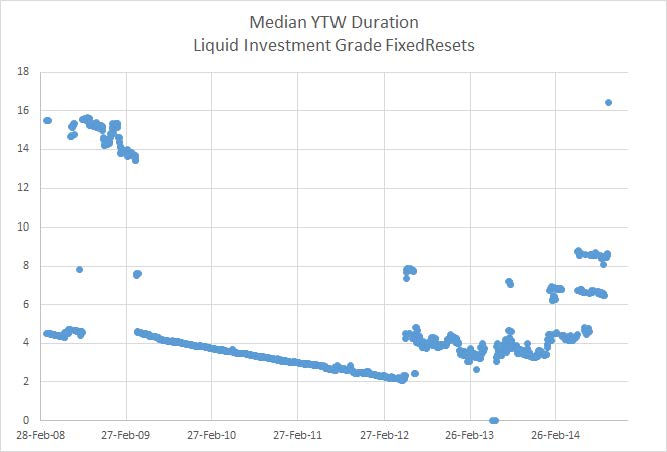
Sharp-eyed and cynical Assiduous Readers will have noted that I told a fib in the above paragraph, because I do, in fact, compute (and store!) more general gauges of daily volume, in the form of the “Median Daily Trading Value” that I report every single day on the market summary. Here’s the chart for the last year of DeemedRetractibles … chosen because it’s a reasonably large sample with minimal contamination from new issues and movements of individual issues between indices:
 Click for Big
*********************************************
It was a mixed day for the Canadian preferred share market, with PerpetualDiscounts flat, FixedResets gaining 6bp and DeemedRetractibles off 6bp. Volatility was muted. Volume … (drum-roll, please!) … was … wait for it … VERY LOW!
HIMIPref™ Preferred Indices
These values reflect the December 2008 revision of the HIMIPref™ Indices
Values are provisional and are finalized monthly |
| Index |
Mean
Current
Yield
(at bid) |
Median
YTW |
Median
Average
Trading
Value |
Median
Mod Dur
(YTW) |
Issues |
Day’s Perf. |
Index Value |
| Ratchet |
3.09 % |
3.08 % |
23,003 |
19.51 |
1 |
1.7176 % |
2,702.7 |
| FixedFloater |
0.00 % |
0.00 % |
0 |
0.00 |
0 |
0.0559 % |
4,061.0 |
| Floater |
2.93 % |
3.11 % |
62,625 |
19.46 |
4 |
0.0559 % |
2,726.8 |
| OpRet |
4.04 % |
2.90 % |
106,133 |
0.08 |
1 |
0.0000 % |
2,732.5 |
| SplitShare |
4.29 % |
4.05 % |
82,460 |
3.83 |
5 |
0.3196 % |
3,155.8 |
| Interest-Bearing |
0.00 % |
0.00 % |
0 |
0.00 |
0 |
0.0000 % |
2,498.6 |
| Perpetual-Premium |
5.50 % |
3.37 % |
73,366 |
0.08 |
18 |
-0.0461 % |
2,447.8 |
| Perpetual-Discount |
5.34 % |
5.17 % |
96,800 |
15.07 |
18 |
-0.0048 % |
2,585.4 |
| FixedReset |
4.24 % |
3.73 % |
171,179 |
16.47 |
75 |
0.0568 % |
2,542.3 |
| Deemed-Retractible |
5.03 % |
3.10 % |
100,964 |
0.45 |
42 |
-0.0583 % |
2,555.2 |
| FloatingReset |
2.56 % |
-1.43 % |
63,002 |
0.08 |
6 |
0.0458 % |
2,546.1 |
| Performance Highlights |
| Issue |
Index |
Change |
Notes |
| PVS.PR.D |
SplitShare |
1.46 % |
YTW SCENARIO
Maturity Type : Hard Maturity
Maturity Date : 2021-10-08
Maturity Price : 25.00
Evaluated at bid price : 24.25
Bid-YTW : 5.13 % |
| BAM.PR.E |
Ratchet |
1.72 % |
YTW SCENARIO
Maturity Type : Limit Maturity
Maturity Date : 2044-10-16
Maturity Price : 23.88
Evaluated at bid price : 24.28
Bid-YTW : 3.08 % |
| Volume Highlights |
| Issue |
Index |
Shares
Traded |
Notes |
| NA.PR.M |
Deemed-Retractible |
84,860 |
RBC bought two blocks of 10,000 each and one of 14,400 from anonymous at 26.35, and bought 17,900 from Nesbitt at 26.34 and crossed 10,000 at 26.36.
YTW SCENARIO
Maturity Type : Call
Maturity Date : 2014-11-15
Maturity Price : 25.75
Evaluated at bid price : 26.27
Bid-YTW : -22.92 % |
| POW.PR.G |
Perpetual-Premium |
77,839 |
Nesbitt crossed 75,000 at 26.00.
YTW SCENARIO
Maturity Type : Call
Maturity Date : 2021-04-15
Maturity Price : 25.00
Evaluated at bid price : 25.90
Bid-YTW : 4.98 % |
| ENB.PF.C |
FixedReset |
55,854 |
Desjardins crossed 49,200 at 25.00.
YTW SCENARIO
Maturity Type : Limit Maturity
Maturity Date : 2044-10-16
Maturity Price : 23.11
Evaluated at bid price : 24.92
Bid-YTW : 4.16 % |
| PWF.PR.T |
FixedReset |
54,500 |
RBC crossed 50,000 at 25.92.
YTW SCENARIO
Maturity Type : Call
Maturity Date : 2019-01-31
Maturity Price : 25.00
Evaluated at bid price : 25.87
Bid-YTW : 3.30 % |
| NA.PR.W |
FixedReset |
44,525 |
Recent new issue.
YTW SCENARIO
Maturity Type : Limit Maturity
Maturity Date : 2044-10-16
Maturity Price : 23.04
Evaluated at bid price : 24.70
Bid-YTW : 3.74 % |
| RY.PR.Z |
FixedReset |
22,420 |
RBC crossed 11,000 at 25.40.
YTW SCENARIO
Maturity Type : Limit Maturity
Maturity Date : 2044-10-16
Maturity Price : 23.32
Evaluated at bid price : 25.41
Bid-YTW : 3.61 % |
| There were 16 other index-included issues trading in excess of 10,000 shares. |
| Wide Spread Highlights |
| Issue |
Index |
Quote Data and Yield Notes |
| PVS.PR.C |
SplitShare |
Quote: 25.73 – 26.90
Spot Rate : 1.1700
Average : 1.0291
YTW SCENARIO
Maturity Type : Hard Maturity
Maturity Date : 2017-12-10
Maturity Price : 25.00
Evaluated at bid price : 25.73
Bid-YTW : 4.05 % |
| ENB.PR.Y |
FixedReset |
Quote: 23.45 – 23.79
Spot Rate : 0.3400
Average : 0.2077
YTW SCENARIO
Maturity Type : Limit Maturity
Maturity Date : 2044-10-16
Maturity Price : 22.52
Evaluated at bid price : 23.45
Bid-YTW : 4.16 % |
| PWF.PR.R |
Perpetual-Premium |
Quote: 25.57 – 25.95
Spot Rate : 0.3800
Average : 0.2525
YTW SCENARIO
Maturity Type : Call
Maturity Date : 2021-04-30
Maturity Price : 25.00
Evaluated at bid price : 25.57
Bid-YTW : 5.07 % |
| PWF.PR.A |
Floater |
Quote: 20.76 – 21.15
Spot Rate : 0.3900
Average : 0.2802
YTW SCENARIO
Maturity Type : Limit Maturity
Maturity Date : 2044-10-16
Maturity Price : 20.76
Evaluated at bid price : 20.76
Bid-YTW : 2.55 % |
| BAM.PF.F |
FixedReset |
Quote: 25.08 – 25.31
Spot Rate : 0.2300
Average : 0.1493
YTW SCENARIO
Maturity Type : Limit Maturity
Maturity Date : 2044-10-16
Maturity Price : 23.19
Evaluated at bid price : 25.08
Bid-YTW : 4.30 % |
| SLF.PR.E |
Deemed-Retractible |
Quote: 22.20 – 22.41
Spot Rate : 0.2100
Average : 0.1403
YTW SCENARIO
Maturity Type : Hard Maturity
Maturity Date : 2025-01-31
Maturity Price : 25.00
Evaluated at bid price : 22.20
Bid-YTW : 6.04 % |