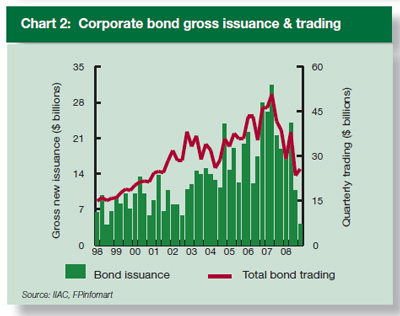
The Investment Industry Association of Canada has released its Debt Market Report for 4Q08.
Corporate issuance has fallen off a cliff:
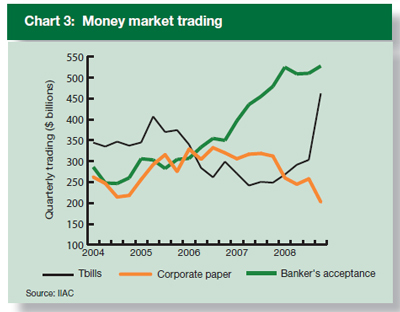
… and Money Market trading is showing some interesting trends:
The Investment Industry Association of Canada has released its Debt Market Report for 4Q08.
Corporate issuance has fallen off a cliff:
… and Money Market trading is showing some interesting trends:
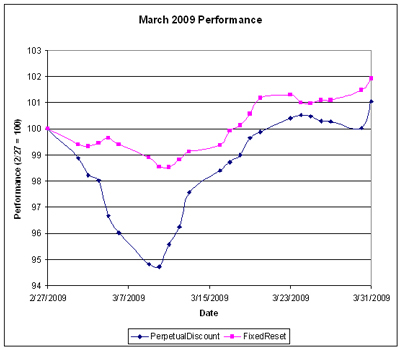
The fund performed well in a volatile month, in which a sharp early drop in values was overtaken by a slow and steady gain:
And … the end of this month marked the eighth full year of operation for Malachite Aggressive Preferred Fund. Since its inception in March, 2001, it has delivered a cumulative return of +100.38% (after expenses, before fees), doubling its money, while the benchmark index has returned a cumulative total of +4.92%.
The fund’s Net Asset Value per Unit as of the close March 31 was $8.8317 after giving effect to a distribution of $0.191322 per unit.
| Returns to March 31, 2009 | |||
| Period | MAPF | Index | CPD according to Claymore |
| One Month | +3.00% | +0.31% | N/A |
| Three Months | +12.14% | +2.72% | N/A |
| One Year | +7.65% | -13.88% | N/A |
| Two Years (annualized) | +2.93% | -10.54% | |
| Three Years (annualized) | +3.77% | -5.86% | |
| Four Years (annualized) | +4.76% | -3.20% | |
| Five Years (annualized) | +5.00% | -2.17% | |
| Six Years (annualized) | +10.18% | -0.10% | |
| Seven Years (annualized) | +8.11% | +0.51% | |
| Eight Years (annualized) | +9.08% | +0.60% | |
| The Index is the BMO-CM “50” | |||
| CPD Returns are for the NAV and are after all fees and expenses. | |||
| Figures for Omega Preferred Equity (which are after all fees and expenses) for 1-, 3- and 12-months are +0.5%, +2.4% and -13.9%, respectively, according to Morningstar after all fees & expenses | |||
| Figures for Jov Leon Frazer Preferred Equity Fund (which are after all fees and expenses) for 1-, 3- and 12-months are N/A, N/A & N/A, respectively, according to Morningstar | |||
Returns assume reinvestment of dividends, and are shown after expenses but before fees. Past performance is not a guarantee of future performance. You can lose money investing in Malachite Aggressive Preferred Fund or any other fund. For more information, see the fund’s main page.
The yields available on high quality preferred shares remain elevated, which is reflected in the current estimate of sustainable income.
| Calculation of MAPF Sustainable Income Per Unit | |||||
| Month | NAVPU | Portfolio Average YTW |
Leverage Divisor |
Securities Average YTW |
Sustainable Income |
| June, 2007 | 9.3114 | 5.16% | 1.03 | 5.01% | 0.4665 |
| September | 9.1489 | 5.35% | 0.98 | 5.46% | 0.4995 |
| December, 2007 | 9.0070 | 5.53% | 0.942 | 5.87% | 0.5288 |
| March, 2008 | 8.8512 | 6.17% | 1.047 | 5.89% | 0.5216 |
| June | 8.3419 | 6.034% | 0.952 | 6.338% | $0.5287 |
| September | 8.1886 | 7.108% | 0.969 | 7.335% | $0.6006 |
| December, 2008 | 8.0464 | 9.24% | 1.008 | 9.166% | $0.7375 |
| March 2009 | $8.8317 | 8.60% | 0.995 | 8.802% | $0.7633 |
| NAVPU is shown after quarterly distributions. “Portfolio YTW” includes cash (or margin borrowing), with an assumed interest rate of 0.00% “Securities YTW” divides “Portfolio YTW” by the “Leverage Divisor” to show the average YTW on the securities held; this assumes that the cash is invested in (or raised from) all securities held, in proportion to their holdings. “Sustainable Income” is the resultant estimate of the fund’s dividend income per unit, before fees and expenses. |
|||||
As discussed in the post MAPF Portfolio Composition: March 2009, the fund has positions in splitShares (almost all BNA.PR.C) and an operating retractible (YPG.PR.B), both of which skew the calculation. Since the yield on thes positions is higher than that of the perpetuals despite the fact that the term is limited, the sustainability of the calculated “sustainable yield” is suspect, as discussed in August.
Additionally, the calculated yield for the fixed-floater in the portfolio, BCE.PR.I, depends on the presumed value of Canada Prime (3.00%) and the percentage of Canada Prime paid on par value (100%); both of these figures may change. Prime is, in fact, now only 2.50% – while this change will affect the calculation of sustainable yield, this issue has a fixed yield until August 1, 2011.
And finally, the yield calculations with respect to FixedReset issues is dependent upon a constant yield of the 5-Year Canada bonds whence the reset rate is calculated. Calculations include the contemporary yield on 5-Year Canada’s; if this value were to be increased, the calculated yield-to-worst on the Fixed-Reset issues held would also increase.
However, if the entire portfolio except for the PerpetualDiscounts were to be sold and reinvested in these issues, the yield of the portfolio would be the 7.60% shown in the March 31 Portfolio Composition analysis (which is in excess of the 7.29% index yield on March 31). Given such reinvestment, the sustainable yield would be 8.8317 * 0.0760 = $0.6712., an slight decrease from the $0.6850 derived by a similar calculation last month; the decline may be attributed to the increase in credit quality over the month.
Different assumptions lead to different calculations, but the overall positive trend is apparent. I’m very pleased with the results! It will be noted that if there was no trading in the portfolio, one would expect the sustainable yield to be constant (before fees and expenses). The success of the fund’s trading is showing up in
As has been noted, the fund has maintained a credit quality equal to or better than the index; outperformance is due to constant exploitation of trading anomalies.
Again, there are no predictions for the future! The fund will continue to trade between issues in an attempt to exploit market gaps in liquidity, in an effort to outperform the index and keep the sustainable income per unit – however calculated! – growing.
| HIMI Index Values 2009-3-31 These values reflect the December 2008 Revision |
|||||||
| Index | Closing Value (Total Return) | Issues | Mean Credit Quality | Median YTW | Median DTW | Median Daily Trading | Mean Current Yield |
| Ratchet | 870.3 | 0 | N/A | N/A | N/A | N/A | N/A |
| FixedFloater | 1,407.4 | 0 | N/A | N/A | N/A | N/A | N/A |
| Floater | 1,087.2 | 2 | 2.00 | 5.49% | 14.7 | 76M | 5.61% |
| OpRet | 2,073.3 | 15 | 1.37 | 4.76% | 3.87 | 131M | 5.23% |
| SplitShare | 1,644.0 | 3 | 2.00 | 10.61% | 5.67 | 47M | 7.03% |
| Interest-Bearing | 1,927.6 | 1 | 2.00 | 9.96% | 0.7 | 33M | 6.19% |
| Perpetual-Premium | 1,516.3 | 0 | N/A | N/A | N/A | N/A | N/A |
| Perpetual-Discount | 1,396.5 | 71 | 1.24 | 7.29% | 12.2 | 154M | 7.16% |
| FixedReset | 1,825.0 | 32 | 1.06 | 5.86% | 13.7 | 569M | 6.10% |
For Index Revisions during February 2009, see the post HIMIPref™ Index Rebalancing: March 2009.
Publication of index details is embargoed for six months following index date.
Performance of the HIMIPref™ Indices for March, 2009, was:
| Total Return | ||
| Index | Performance March 2009 |
Three Months to March 31, 209 |
| Ratchet | -2.67% * | +5.00% * |
| FixFloat | +5.00% ** | +12.41% ** |
| Floater | +5.00% | +10.19% |
| OpRet | +1.27% | +5.36% |
| SplitShare | +0.00% | -6.53% |
| Interest | -0.11% | +4.98% |
| PerpetualPremium | +1.05%*** | +3.33%*** |
| PerpetualDiscount | +1.05% | +3.33%% |
| FixedReset | +1.93% | +1.77% |
| * The last member of the RatchetRate index was transferred to Scraps at the February, 2009, rebalancing; subsequent performance figures are set equal to the Floater index | ||
| ** The last member of the FixedReset index was transferred to Scraps at the February, 2009, rebalancing; subsequent performance figures are set equal to the PerpetualDiscount index | ||
| *** The last member of the PerpetualPremium index was transferred to PerpetualDiscount at the October, 2008, rebalancing; subsequent performance figures are set equal to the PerpetualDiscount index | ||
| Funds (see below for calculations) | ||
| CPD | +0.63% | +2.69% |
| DPS.UN | -0.23% | +3.58% |
| Index | ||
| BMO-CM 50 | +0.31% | +2.72% |
Claymore has published NAV and distribution data for its exchange traded fund (CPD) and I have derived the following table:
| CPD Return, 1- & 3-month, to March 31, 2009 | ||||
| Date | NAV | Distribution | Return for Sub-Period | Monthly Return |
| December 31, 2008 | 14.11 | 0.00 | ||
| January 30, 2009 | 14.57 | 0.00 | +3.26% | |
| February 27, 2009 | 14.40 | 0.00 | -1.17% | |
| March 26 | 14.19 | 0.2100 | 0.00% | +0.63% |
| March 31, 2009 | 14.28 | +0.63% | ||
| Quarterly Return | +2.69% | |||
The DPS.UN NAV for April 1 has been published so we may calculate the March returns (approximately!) for this closed end fund.
| DPS.UN NAV Return, March-ish 2009 | |||
| Date | NAV | Distribution | Return for period |
| Estimated February Ending Stub | +0.21% | ||
| February 25, 2009 | 16.27 | ||
| March 25, 2009 | 16.11 | -0.98% | |
| March 27, 2009 | 15.81* | 0.30 | 0.00%* |
| April 1, 2009 | 16.02 | 0.00 | +1.33% |
| Estimated April Beginning Stub | -0.77% | ||
| Estimated March Return | -0.23% | ||
| ** CPD had a NAV of $14.43 on February 25 and $14.40 on February 27. Return for this period for CPD was therefore -0.21%, which is subtracted from the DPS period return. | |||
| * CPD had a NAV of $14.40 on March 25 and $14.19 on March 26 after a $0.21 distribution. The NAV was 14.19 on March 27. Therefore, the total return on CPD for this full period was 0.00%. This has been used to estimate a post-distribution NAV for DPS.UN on March 27.. | |||
| ** CPD had a NAV of $14.39 on April 1 and a NAV of $14.28 on March 31. The return for the day was therefore 0.77%. This figure is subtracted from the DPS.UN period return to arrive at an estimate for the calendar month. | |||
| The April return for DPS.UN’s NAV is therefore the product of four period returns, +0.21, -0.98%, +1.33 and -0.77%, to arrive at an estimate for the calendar month of -0.23% | |||
Now, to see the DPS.UN quarterly NAV approximate return, we refer to the calculations for January and February
| DPS.UN NAV Returns, three-month-ish to end-March-ish, 2009 | |
| January-ish | +5.71% |
| February-ish | -1.79% |
| March-ish | -0.23% |
| Three-months-ish | +3.58% |
Trading eased off a little in March, with portfolio turnover of about 80%, in a market notable for its volatility – PerpetualDiscounts were down 5.28% at the nadir on March 10, but recovered to post a return of +1.05% for the month. There was continued huge issuance of Fixed-Resets during the month, with over $1.2-billion hitting the streets.
Trades were, as ever, triggered by a desire to exploit transient mispricing in the preferred share market (which may the thought of as “selling liquidity”), rather than any particular view being taken on market direction, sectoral performance or credit anticipation.
| MAPF Sectoral Analysis 2009-3-31 | |||
| HIMI Indices Sector | Weighting | YTW | ModDur |
| Ratchet | 0% | N/A | N/A |
| FixFloat | 0% | N/A | N/A |
| Floater | 0% | N/A | N/A |
| OpRet | 0% | N/A | N/A |
| SplitShare | 9.7% (-0.6) | 15.86% | 6.56 |
| Interest Rearing | 0% | N/A | N/A |
| PerpetualPremium | 0.0% | N/A | N/A |
| PerpetualDiscount | 73.8% (+1.0) | 7.60% | 12.03 |
| Fixed-Reset | 10.0% (+0.7) | 6.39% | 13.28 |
| Scraps (FixFloat) | 1.6% (-2.6) | 6.53% | 14.74 |
| Scraps (OpRet) | 3.7% (-0.4) | 17.67% | 5.69 |
| Scraps (SplitShare) | 0.5% (+0.2) | 6.40% | 4.35 |
| Cash | +0.5% (+1.5) | 0.00% | 0.00 |
| Total | 100% | 8.60% | 11.23 |
| Totals and changes will not add precisely due to rounding. Bracketted figures represent change from February month-end. Cash is included in totals with duration and yield both equal to zero. | |||
The “total” reflects the un-leveraged total portfolio (i.e., cash is included in the portfolio calculations and is deemed to have a duration and yield of 0.00.). MAPF will often have relatively large cash balances, both credit and debit, to facilitate trading. Figures presented in the table have been rounded to the indicated precision.
Credit distribution is:
| MAPF Credit Analysis 2009-3-31 | |
| DBRS Rating | Weighting |
| Pfd-1 | 49.9% (+17.2) |
| Pfd-1(low) | 16.5% (-14.8) |
| Pfd-2(high) | 8.9% (-0.4) |
| Pfd-2 | 0% (0) |
| Pfd-2(low) | 18.7% (-0.4) |
| Pfd-3(high) | 5.3% (-3.0) |
| Pfd-3(low) | 0.0% (-0.3) |
| Cash | +0.5% (+1.5) |
| Totals will not add precisely due to rounding. Bracketted figures represent change from February month-end. | |
The fund does not set any targets for overall credit quality; trades are executed one by one. Variances in overall credit will be constant as opportunistic trades are executed. The overall credit quality of the portfolio is now superior to the credit quality of CPD at August month-end (when adjusted for the downgrade of BCE).
Claymore provides the following ratings breakdown:
| Ratings Breakdown as of 12/31/08 |
|
| Pfd-1 | 61.15% |
| Pfd-2 | 23.26% |
| Pfd-3 | 15.60% |
Two events have occurred since the Dec. 31 calculation date of CPD’s credit quality:
As was the case with the February Composition Report, the changes in MAPF’s credit quality defy simple explanation; there were simply too many trades to allow for one or two trades to be highlighted as the source of the change. In sum however, the major changes were:
A plot of the Yields-to-Worst of SLF.PR.A (the most liquid SLF issue) and CU.PR.B is instructive. The peak in SunLife yields was enormous – and sadly, the fund got in too early to realize the full benefit of the return to more normal levels, having topped up its position in the week of February 13-17. However, the need to act quickly is well illustrated by CU.PR.B, for which it appears that a large sale order was executed in pieces over a two week period, driving the pre-tax bid-YTW to an elevated plateau. The fund was able to take advantage of the market impact of this trade, supplying liquidity to the seller at what appears – so far! – to have been a very nice price.
Trade details will be published with the semi-annual report to unitholders, due in July.
Liquidity Distribution is:
| MAPF Liquidity Analysis 2009-3-31 | |
| Average Daily Trading | Weighting |
| <$50,000 | 0.5% (0) |
| $50,000 – $100,000 | 37.6% (+18.2) |
| $100,000 – $200,000 | 14.8% (-1.9) |
| $200,000 – $300,000 | 23.8% (-7.4) |
| >$300,000 | 22.6% (-10.6) |
| Cash | +0.5% (+1.5) |
| Totals will not add precisely due to rounding. Bracketted figures represent change from February month-end. | |
MAPF is, of course, Malachite Aggressive Preferred Fund, a “unit trust” managed by Hymas Investment Management Inc. Further information and links to performance, audited financials and subscription information are available the fund’s web page. A “unit trust” is like a regular mutual fund, but is sold by offering memorandum rather than prospectus. This is cheaper, but means subscription is restricted to “accredited investors” (as defined by the Ontario Securities Commission) and those who subscribe for $150,000+. Fund past performances are not a guarantee of future performance. You can lose money investing in MAPF or any other fund.
A similar portfolio composition analysis has been performed on The Claymore Preferred Share ETF (symbol CPD) as of August 29. When comparing CPD and MAPF:
Bernanke gave a speech today on the Federal Reserve’s Balance Sheet (hat tip: Across the Curve). I have updated the post Fed to Open Spigots Further.
It looks like Short-Sellers will join the politically inspired list of Designated Villains for the financial crisis. The SEC is under pressure and voices of reason will – as usual, when political grandstanding becomes paramount – be ignored.
The OSC has published the first edition of OSC Investor News. Investors may obtain a subscription by eMailing the OSC.
Another day of good performance from the PerpetualDiscounts; Fixed-Resets were more mixed but were able to eke out a gain.
| HIMIPref™ Preferred Indices These values reflect the December 2008 revision of the HIMIPref™ Indices Values are provisional and are finalized monthly |
|||||||
| Index | Mean Current Yield (at bid) |
Median YTW |
Median Average Trading Value |
Median Mod Dur (YTW) |
Issues | Day’s Perf. | Index Value |
| Ratchet | 0.00 % | 0.00 % | 0 | 0.00 | 0 | 0.8323 % | 878.1 |
| FixedFloater | 0.00 % | 0.00 % | 0 | 0.00 | 0 | 0.8323 % | 1,420.0 |
| Floater | 5.56 % | 5.45 % | 72,197 | 14.79 | 2 | 0.8323 % | 1,097.0 |
| OpRet | 5.18 % | 4.72 % | 136,035 | 3.86 | 15 | 0.2836 % | 2,093.4 |
| SplitShare | 7.06 % | 12.90 % | 46,807 | 5.65 | 3 | 0.0909 % | 1,637.2 |
| Interest-Bearing | 6.15 % | 9.34 % | 29,981 | 0.72 | 1 | -0.5102 % | 1,937.5 |
| Perpetual-Premium | 0.00 % | 0.00 % | 0 | 0.00 | 0 | 0.3057 % | 1,557.8 |
| Perpetual-Discount | 6.98 % | 7.09 % | 152,151 | 12.43 | 71 | 0.3057 % | 1,434.7 |
| FixedReset | 6.05 % | 5.74 % | 713,144 | 13.71 | 34 | 0.0692 % | 1,845.5 |
| Performance Highlights | |||
| Issue | Index | Change | Notes |
| BMO.PR.M | FixedReset | -2.47 % | YTW SCENARIO Maturity Type : Limit Maturity Maturity Date : 2039-04-03 Maturity Price : 22.09 Evaluated at bid price : 22.15 Bid-YTW : 4.25 % |
| RY.PR.B | Perpetual-Discount | -1.90 % | YTW SCENARIO Maturity Type : Limit Maturity Maturity Date : 2039-04-03 Maturity Price : 18.06 Evaluated at bid price : 18.06 Bid-YTW : 6.62 % |
| POW.PR.D | Perpetual-Discount | -1.81 % | YTW SCENARIO Maturity Type : Limit Maturity Maturity Date : 2039-04-03 Maturity Price : 16.79 Evaluated at bid price : 16.79 Bid-YTW : 7.49 % |
| CIU.PR.B | FixedReset | -1.31 % | YTW SCENARIO Maturity Type : Call Maturity Date : 2014-07-01 Maturity Price : 25.00 Evaluated at bid price : 26.40 Bid-YTW : 5.52 % |
| GWO.PR.H | Perpetual-Discount | -1.27 % | YTW SCENARIO Maturity Type : Limit Maturity Maturity Date : 2039-04-03 Maturity Price : 16.32 Evaluated at bid price : 16.32 Bid-YTW : 7.50 % |
| GWO.PR.F | Perpetual-Discount | -1.22 % | YTW SCENARIO Maturity Type : Limit Maturity Maturity Date : 2039-04-03 Maturity Price : 20.25 Evaluated at bid price : 20.25 Bid-YTW : 7.35 % |
| SLF.PR.D | Perpetual-Discount | -1.11 % | YTW SCENARIO Maturity Type : Limit Maturity Maturity Date : 2039-04-03 Maturity Price : 15.11 Evaluated at bid price : 15.11 Bid-YTW : 7.43 % |
| BAM.PR.I | OpRet | 1.12 % | YTW SCENARIO Maturity Type : Soft Maturity Maturity Date : 2013-12-30 Maturity Price : 25.00 Evaluated at bid price : 22.60 Bid-YTW : 8.04 % |
| BAM.PR.B | Floater | 1.13 % | YTW SCENARIO Maturity Type : Limit Maturity Maturity Date : 2039-04-03 Maturity Price : 8.09 Evaluated at bid price : 8.09 Bid-YTW : 5.45 % |
| NA.PR.L | Perpetual-Discount | 1.14 % | YTW SCENARIO Maturity Type : Limit Maturity Maturity Date : 2039-04-03 Maturity Price : 17.81 Evaluated at bid price : 17.81 Bid-YTW : 6.94 % |
| BAM.PR.N | Perpetual-Discount | 1.28 % | YTW SCENARIO Maturity Type : Limit Maturity Maturity Date : 2039-04-03 Maturity Price : 13.44 Evaluated at bid price : 13.44 Bid-YTW : 8.94 % |
| BNA.PR.C | SplitShare | 1.29 % | Asset coverage of 1.7-:1 as of February 28 according to the company. YTW SCENARIO Maturity Type : Hard Maturity Maturity Date : 2019-01-10 Maturity Price : 25.00 Evaluated at bid price : 11.75 Bid-YTW : 15.00 % |
| RY.PR.F | Perpetual-Discount | 1.30 % | YTW SCENARIO Maturity Type : Limit Maturity Maturity Date : 2039-04-03 Maturity Price : 17.16 Evaluated at bid price : 17.16 Bid-YTW : 6.59 % |
| SLF.PR.B | Perpetual-Discount | 1.30 % | YTW SCENARIO Maturity Type : Limit Maturity Maturity Date : 2039-04-03 Maturity Price : 16.35 Evaluated at bid price : 16.35 Bid-YTW : 7.41 % |
| CM.PR.K | FixedReset | 1.35 % | YTW SCENARIO Maturity Type : Limit Maturity Maturity Date : 2039-04-03 Maturity Price : 22.51 Evaluated at bid price : 22.55 Bid-YTW : 4.78 % |
| PWF.PR.G | Perpetual-Discount | 1.38 % | YTW SCENARIO Maturity Type : Limit Maturity Maturity Date : 2039-04-03 Maturity Price : 20.50 Evaluated at bid price : 20.50 Bid-YTW : 7.37 % |
| HSB.PR.D | Perpetual-Discount | 1.43 % | YTW SCENARIO Maturity Type : Limit Maturity Maturity Date : 2039-04-03 Maturity Price : 17.05 Evaluated at bid price : 17.05 Bid-YTW : 7.40 % |
| BMO.PR.L | Perpetual-Discount | 1.53 % | YTW SCENARIO Maturity Type : Limit Maturity Maturity Date : 2039-04-03 Maturity Price : 21.20 Evaluated at bid price : 21.20 Bid-YTW : 6.96 % |
| ELF.PR.G | Perpetual-Discount | 1.63 % | YTW SCENARIO Maturity Type : Limit Maturity Maturity Date : 2039-04-03 Maturity Price : 13.75 Evaluated at bid price : 13.75 Bid-YTW : 8.70 % |
| TD.PR.O | Perpetual-Discount | 1.67 % | YTW SCENARIO Maturity Type : Limit Maturity Maturity Date : 2039-04-03 Maturity Price : 18.84 Evaluated at bid price : 18.84 Bid-YTW : 6.57 % |
| CIU.PR.A | Perpetual-Discount | 1.69 % | YTW SCENARIO Maturity Type : Limit Maturity Maturity Date : 2039-04-03 Maturity Price : 17.50 Evaluated at bid price : 17.50 Bid-YTW : 6.67 % |
| PWF.PR.K | Perpetual-Discount | 2.17 % | YTW SCENARIO Maturity Type : Limit Maturity Maturity Date : 2039-04-03 Maturity Price : 17.46 Evaluated at bid price : 17.46 Bid-YTW : 7.25 % |
| BMO.PR.J | Perpetual-Discount | 2.44 % | YTW SCENARIO Maturity Type : Limit Maturity Maturity Date : 2039-04-03 Maturity Price : 17.23 Evaluated at bid price : 17.23 Bid-YTW : 6.64 % |
| CU.PR.A | Perpetual-Discount | 2.79 % | YTW SCENARIO Maturity Type : Limit Maturity Maturity Date : 2039-04-03 Maturity Price : 21.83 Evaluated at bid price : 22.10 Bid-YTW : 6.65 % |
| BAM.PR.J | OpRet | 3.78 % | YTW SCENARIO Maturity Type : Soft Maturity Maturity Date : 2018-03-30 Maturity Price : 25.00 Evaluated at bid price : 19.20 Bid-YTW : 9.34 % |
| Volume Highlights | |||
| Issue | Index | Shares Traded |
Notes |
| TD.PR.K | FixedReset | 832,732 | New issue settled today. YTW SCENARIO Maturity Type : Limit Maturity Maturity Date : 2039-04-03 Maturity Price : 25.12 Evaluated at bid price : 25.17 Bid-YTW : 6.10 % |
| RY.PR.X | FixedReset | 334,190 | Recent new issue. YTW SCENARIO Maturity Type : Limit Maturity Maturity Date : 2039-04-03 Maturity Price : 23.19 Evaluated at bid price : 25.17 Bid-YTW : 6.07 % |
| BAM.PR.K | Floater | 73,700 | TD crossed 37,400 at 7.60. YTW SCENARIO Maturity Type : Limit Maturity Maturity Date : 2039-04-03 Maturity Price : 7.66 Evaluated at bid price : 7.66 Bid-YTW : 5.75 % |
| BMO.PR.K | Perpetual-Discount | 53,400 | TD crossed 39,500 at 18.96. YTW SCENARIO Maturity Type : Limit Maturity Maturity Date : 2039-04-03 Maturity Price : 18.91 Evaluated at bid price : 18.91 Bid-YTW : 7.06 % |
| BMO.PR.L | Perpetual-Discount | 52,385 | RBC bought two blocks from Nesbitt, 10,000 at 21.00 and 13,400 at 21.20. YTW SCENARIO Maturity Type : Limit Maturity Maturity Date : 2039-04-03 Maturity Price : 21.20 Evaluated at bid price : 21.20 Bid-YTW : 6.96 % |
| TD.PR.I | FixedReset | 50,030 | Recent new issue. YTW SCENARIO Maturity Type : Limit Maturity Maturity Date : 2039-04-03 Maturity Price : 25.35 Evaluated at bid price : 25.40 Bid-YTW : 5.96 % |
| There were 29 other index-included issues trading in excess of 10,000 shares. | |||
TD.PR.K, the 6.25%+433 FixedReset announced last week closed today – all $350-million of it – and traded 832,732 shares in a range of 24.98-20 before closing at 25.17-22, 12×2.
Its vital statistics are:
| TD.PR.K | FixedReset | YTW SCENARIO Maturity Type : Limit Maturity Maturity Date : 2039-04-03 Maturity Price : 25.12 Evaluated at bid price : 25.17 Bid-YTW : 6.10 % |
No commentary today! It must be quarter-end, or something!
Whoosh-a-rama! PerpetualDiscounts rocketted up today and Fixed-Resets put up a very good show. CIU.PR.B at 26.75 bid, with a 5.22% YTW? The PerpetualDiscount CIU.PR.A closed at 17.21-18.25 today, yielding 6.78%-6.33% and I can no longer say (as I said when CIU.PR.B closed) that the Fixed-Reset issue is still cheap! However, some may still be attracted by the now legitimate expectation of a five-year call.
| HIMIPref™ Preferred Indices These values reflect the December 2008 revision of the HIMIPref™ Indices Values are provisional and are finalized monthly |
|||||||
| Index | Mean Current Yield (at bid) |
Median YTW |
Median Average Trading Value |
Median Mod Dur (YTW) |
Issues | Day’s Perf. | Index Value |
| Ratchet | 0.00 % | 0.00 % | 0 | 0.00 | 0 | 1.1658 % | 870.8 |
| FixedFloater | 0.00 % | 0.00 % | 0 | 0.00 | 0 | 1.1658 % | 1,408.3 |
| Floater | 5.60 % | 5.51 % | 72,628 | 14.70 | 2 | 1.1658 % | 1,087.9 |
| OpRet | 5.19 % | 4.73 % | 135,395 | 3.87 | 15 | 0.3503 % | 2,087.5 |
| SplitShare | 7.07 % | 13.01 % | 47,274 | 5.66 | 3 | -0.8114 % | 1,635.7 |
| Interest-Bearing | 6.12 % | 8.58 % | 31,203 | 0.72 | 1 | 0.9269 % | 1,947.5 |
| Perpetual-Premium | 0.00 % | 0.00 % | 0 | 0.00 | 0 | 1.4848 % | 1,553.1 |
| Perpetual-Discount | 6.99 % | 7.13 % | 152,913 | 12.42 | 71 | 1.4848 % | 1,430.4 |
| FixedReset | 6.04 % | 5.79 % | 741,277 | 13.57 | 33 | 0.5187 % | 1,844.2 |
| Performance Highlights | |||
| Issue | Index | Change | Notes |
| BNA.PR.A | SplitShare | -2.51 % | Asset coverage of 1.7-:1 as of February 28 according to the company. YTW SCENARIO Maturity Type : Hard Maturity Maturity Date : 2010-09-30 Maturity Price : 25.00 Evaluated at bid price : 22.91 Bid-YTW : 13.01 % |
| ACO.PR.A | OpRet | -1.66 % | YTW SCENARIO Maturity Type : Call Maturity Date : 2009-12-31 Maturity Price : 25.50 Evaluated at bid price : 26.11 Bid-YTW : 3.05 % |
| W.PR.J | Perpetual-Discount | -1.39 % | YTW SCENARIO Maturity Type : Limit Maturity Maturity Date : 2039-04-02 Maturity Price : 19.86 Evaluated at bid price : 19.86 Bid-YTW : 7.09 % |
| TCA.PR.X | Perpetual-Discount | 1.02 % | YTW SCENARIO Maturity Type : Limit Maturity Maturity Date : 2039-04-02 Maturity Price : 45.01 Evaluated at bid price : 46.75 Bid-YTW : 5.95 % |
| IAG.PR.C | FixedReset | 1.04 % | YTW SCENARIO Maturity Type : Limit Maturity Maturity Date : 2039-04-02 Maturity Price : 22.21 Evaluated at bid price : 22.25 Bid-YTW : 6.11 % |
| BNS.PR.Q | FixedReset | 1.05 % | YTW SCENARIO Maturity Type : Limit Maturity Maturity Date : 2039-04-02 Maturity Price : 22.01 Evaluated at bid price : 22.06 Bid-YTW : 4.36 % |
| BAM.PR.K | Floater | 1.06 % | YTW SCENARIO Maturity Type : Limit Maturity Maturity Date : 2039-04-02 Maturity Price : 7.62 Evaluated at bid price : 7.62 Bid-YTW : 5.78 % |
| CM.PR.K | FixedReset | 1.14 % | YTW SCENARIO Maturity Type : Limit Maturity Maturity Date : 2039-04-02 Maturity Price : 22.21 Evaluated at bid price : 22.25 Bid-YTW : 4.85 % |
| BNS.PR.R | FixedReset | 1.17 % | YTW SCENARIO Maturity Type : Limit Maturity Maturity Date : 2039-04-02 Maturity Price : 22.37 Evaluated at bid price : 22.41 Bid-YTW : 4.47 % |
| TD.PR.A | FixedReset | 1.19 % | YTW SCENARIO Maturity Type : Limit Maturity Maturity Date : 2039-04-02 Maturity Price : 22.96 Evaluated at bid price : 23.00 Bid-YTW : 4.44 % |
| BNS.PR.K | Perpetual-Discount | 1.22 % | YTW SCENARIO Maturity Type : Limit Maturity Maturity Date : 2039-04-02 Maturity Price : 18.20 Evaluated at bid price : 18.20 Bid-YTW : 6.74 % |
| BMO.PR.K | Perpetual-Discount | 1.23 % | YTW SCENARIO Maturity Type : Limit Maturity Maturity Date : 2039-04-02 Maturity Price : 18.98 Evaluated at bid price : 18.98 Bid-YTW : 7.03 % |
| GWO.PR.G | Perpetual-Discount | 1.25 % | YTW SCENARIO Maturity Type : Limit Maturity Maturity Date : 2039-04-02 Maturity Price : 17.82 Evaluated at bid price : 17.82 Bid-YTW : 7.36 % |
| HSB.PR.D | Perpetual-Discount | 1.27 % | YTW SCENARIO Maturity Type : Limit Maturity Maturity Date : 2039-04-02 Maturity Price : 16.81 Evaluated at bid price : 16.81 Bid-YTW : 7.51 % |
| BAM.PR.B | Floater | 1.27 % | YTW SCENARIO Maturity Type : Limit Maturity Maturity Date : 2039-04-02 Maturity Price : 8.00 Evaluated at bid price : 8.00 Bid-YTW : 5.51 % |
| CM.PR.I | Perpetual-Discount | 1.30 % | YTW SCENARIO Maturity Type : Limit Maturity Maturity Date : 2039-04-02 Maturity Price : 16.31 Evaluated at bid price : 16.31 Bid-YTW : 7.22 % |
| GWO.PR.I | Perpetual-Discount | 1.33 % | YTW SCENARIO Maturity Type : Limit Maturity Maturity Date : 2039-04-02 Maturity Price : 15.27 Evaluated at bid price : 15.27 Bid-YTW : 7.44 % |
| IAG.PR.A | Perpetual-Discount | 1.36 % | YTW SCENARIO Maturity Type : Limit Maturity Maturity Date : 2039-04-02 Maturity Price : 14.96 Evaluated at bid price : 14.96 Bid-YTW : 7.76 % |
| HSB.PR.C | Perpetual-Discount | 1.36 % | YTW SCENARIO Maturity Type : Limit Maturity Maturity Date : 2039-04-02 Maturity Price : 17.95 Evaluated at bid price : 17.95 Bid-YTW : 7.17 % |
| BAM.PR.J | OpRet | 1.37 % | YTW SCENARIO Maturity Type : Soft Maturity Maturity Date : 2018-03-30 Maturity Price : 25.00 Evaluated at bid price : 18.50 Bid-YTW : 9.90 % |
| CM.PR.P | Perpetual-Discount | 1.38 % | YTW SCENARIO Maturity Type : Limit Maturity Maturity Date : 2039-04-02 Maturity Price : 19.09 Evaluated at bid price : 19.09 Bid-YTW : 7.22 % |
| MFC.PR.D | FixedReset | 1.43 % | YTW SCENARIO Maturity Type : Limit Maturity Maturity Date : 2039-04-02 Maturity Price : 24.85 Evaluated at bid price : 24.90 Bid-YTW : 6.48 % |
| NA.PR.L | Perpetual-Discount | 1.44 % | YTW SCENARIO Maturity Type : Limit Maturity Maturity Date : 2039-04-02 Maturity Price : 17.61 Evaluated at bid price : 17.61 Bid-YTW : 7.02 % |
| CM.PR.H | Perpetual-Discount | 1.45 % | YTW SCENARIO Maturity Type : Limit Maturity Maturity Date : 2039-04-02 Maturity Price : 16.78 Evaluated at bid price : 16.78 Bid-YTW : 7.17 % |
| RY.PR.G | Perpetual-Discount | 1.48 % | YTW SCENARIO Maturity Type : Limit Maturity Maturity Date : 2039-04-02 Maturity Price : 17.13 Evaluated at bid price : 17.13 Bid-YTW : 6.68 % |
| CM.PR.G | Perpetual-Discount | 1.57 % | YTW SCENARIO Maturity Type : Limit Maturity Maturity Date : 2039-04-02 Maturity Price : 18.82 Evaluated at bid price : 18.82 Bid-YTW : 7.19 % |
| BNS.PR.O | Perpetual-Discount | 1.57 % | YTW SCENARIO Maturity Type : Limit Maturity Maturity Date : 2039-04-02 Maturity Price : 21.31 Evaluated at bid price : 21.31 Bid-YTW : 6.71 % |
| MFC.PR.B | Perpetual-Discount | 1.58 % | YTW SCENARIO Maturity Type : Limit Maturity Maturity Date : 2039-04-02 Maturity Price : 16.07 Evaluated at bid price : 16.07 Bid-YTW : 7.32 % |
| BAM.PR.O | OpRet | 1.58 % | YTW SCENARIO Maturity Type : Option Certainty Maturity Date : 2013-06-30 Maturity Price : 25.00 Evaluated at bid price : 21.85 Bid-YTW : 8.67 % |
| BNS.PR.L | Perpetual-Discount | 1.59 % | YTW SCENARIO Maturity Type : Limit Maturity Maturity Date : 2039-04-02 Maturity Price : 17.20 Evaluated at bid price : 17.20 Bid-YTW : 6.68 % |
| RY.PR.D | Perpetual-Discount | 1.60 % | YTW SCENARIO Maturity Type : Limit Maturity Maturity Date : 2039-04-02 Maturity Price : 17.13 Evaluated at bid price : 17.13 Bid-YTW : 6.68 % |
| BMO.PR.L | Perpetual-Discount | 1.61 % | YTW SCENARIO Maturity Type : Limit Maturity Maturity Date : 2039-04-02 Maturity Price : 20.88 Evaluated at bid price : 20.88 Bid-YTW : 7.06 % |
| TD.PR.P | Perpetual-Discount | 1.62 % | YTW SCENARIO Maturity Type : Limit Maturity Maturity Date : 2039-04-02 Maturity Price : 20.05 Evaluated at bid price : 20.05 Bid-YTW : 6.69 % |
| BMO.PR.H | Perpetual-Discount | 1.63 % | YTW SCENARIO Maturity Type : Limit Maturity Maturity Date : 2039-04-02 Maturity Price : 19.90 Evaluated at bid price : 19.90 Bid-YTW : 6.77 % |
| PWF.PR.F | Perpetual-Discount | 1.66 % | YTW SCENARIO Maturity Type : Limit Maturity Maturity Date : 2039-04-02 Maturity Price : 18.41 Evaluated at bid price : 18.41 Bid-YTW : 7.30 % |
| ELF.PR.F | Perpetual-Discount | 1.68 % | YTW SCENARIO Maturity Type : Limit Maturity Maturity Date : 2039-04-02 Maturity Price : 15.10 Evaluated at bid price : 15.10 Bid-YTW : 8.84 % |
| SLF.PR.B | Perpetual-Discount | 1.70 % | YTW SCENARIO Maturity Type : Limit Maturity Maturity Date : 2039-04-02 Maturity Price : 16.14 Evaluated at bid price : 16.14 Bid-YTW : 7.51 % |
| GWO.PR.H | Perpetual-Discount | 1.72 % | YTW SCENARIO Maturity Type : Limit Maturity Maturity Date : 2039-04-02 Maturity Price : 16.53 Evaluated at bid price : 16.53 Bid-YTW : 7.40 % |
| CM.PR.E | Perpetual-Discount | 1.73 % | YTW SCENARIO Maturity Type : Limit Maturity Maturity Date : 2039-04-02 Maturity Price : 19.42 Evaluated at bid price : 19.42 Bid-YTW : 7.23 % |
| RY.PR.H | Perpetual-Discount | 1.84 % | YTW SCENARIO Maturity Type : Limit Maturity Maturity Date : 2039-04-02 Maturity Price : 22.02 Evaluated at bid price : 22.11 Bid-YTW : 6.49 % |
| POW.PR.C | Perpetual-Discount | 1.95 % | YTW SCENARIO Maturity Type : Limit Maturity Maturity Date : 2039-04-02 Maturity Price : 19.31 Evaluated at bid price : 19.31 Bid-YTW : 7.56 % |
| RY.PR.E | Perpetual-Discount | 2.08 % | YTW SCENARIO Maturity Type : Limit Maturity Maturity Date : 2039-04-02 Maturity Price : 17.20 Evaluated at bid price : 17.20 Bid-YTW : 6.65 % |
| BNA.PR.C | SplitShare | 2.11 % | Asset coverage of 1.7-:1 as of February 28 according to the company. YTW SCENARIO Maturity Type : Hard Maturity Maturity Date : 2019-01-10 Maturity Price : 25.00 Evaluated at bid price : 11.60 Bid-YTW : 15.19 % |
| BNS.PR.M | Perpetual-Discount | 2.20 % | YTW SCENARIO Maturity Type : Limit Maturity Maturity Date : 2039-04-02 Maturity Price : 17.19 Evaluated at bid price : 17.19 Bid-YTW : 6.69 % |
| CM.PR.J | Perpetual-Discount | 2.27 % | YTW SCENARIO Maturity Type : Limit Maturity Maturity Date : 2039-04-02 Maturity Price : 15.80 Evaluated at bid price : 15.80 Bid-YTW : 7.14 % |
| SLF.PR.E | Perpetual-Discount | 2.29 % | YTW SCENARIO Maturity Type : Limit Maturity Maturity Date : 2039-04-02 Maturity Price : 15.21 Evaluated at bid price : 15.21 Bid-YTW : 7.47 % |
| PWF.PR.L | Perpetual-Discount | 2.34 % | YTW SCENARIO Maturity Type : Limit Maturity Maturity Date : 2039-04-02 Maturity Price : 17.48 Evaluated at bid price : 17.48 Bid-YTW : 7.47 % |
| BAM.PR.M | Perpetual-Discount | 2.37 % | YTW SCENARIO Maturity Type : Limit Maturity Maturity Date : 2039-04-02 Maturity Price : 13.38 Evaluated at bid price : 13.38 Bid-YTW : 8.98 % |
| CIU.PR.B | FixedReset | 2.45 % | At these prices, holders are justified in assigning a high probability to a five-year call! YTW SCENARIO Maturity Type : Call Maturity Date : 2014-07-01 Maturity Price : 25.00 Evaluated at bid price : 26.75 Bid-YTW : 5.22 % |
| BAM.PR.I | OpRet | 2.52 % | YTW SCENARIO Maturity Type : Soft Maturity Maturity Date : 2013-12-30 Maturity Price : 25.00 Evaluated at bid price : 22.35 Bid-YTW : 8.31 % |
| PWF.PR.H | Perpetual-Discount | 2.60 % | YTW SCENARIO Maturity Type : Limit Maturity Maturity Date : 2039-04-02 Maturity Price : 19.75 Evaluated at bid price : 19.75 Bid-YTW : 7.45 % |
| RY.PR.C | Perpetual-Discount | 2.73 % | YTW SCENARIO Maturity Type : Limit Maturity Maturity Date : 2039-04-02 Maturity Price : 17.70 Evaluated at bid price : 17.70 Bid-YTW : 6.61 % |
| POW.PR.A | Perpetual-Discount | 2.81 % | YTW SCENARIO Maturity Type : Limit Maturity Maturity Date : 2039-04-02 Maturity Price : 19.02 Evaluated at bid price : 19.02 Bid-YTW : 7.41 % |
| SLF.PR.A | Perpetual-Discount | 2.85 % | YTW SCENARIO Maturity Type : Limit Maturity Maturity Date : 2039-04-02 Maturity Price : 16.25 Evaluated at bid price : 16.25 Bid-YTW : 7.38 % |
| RY.PR.B | Perpetual-Discount | 2.85 % | YTW SCENARIO Maturity Type : Limit Maturity Maturity Date : 2039-04-02 Maturity Price : 18.41 Evaluated at bid price : 18.41 Bid-YTW : 6.49 % |
| PWF.PR.E | Perpetual-Discount | 2.96 % | YTW SCENARIO Maturity Type : Limit Maturity Maturity Date : 2039-04-02 Maturity Price : 19.15 Evaluated at bid price : 19.15 Bid-YTW : 7.35 % |
| GWO.PR.F | Perpetual-Discount | 3.02 % | YTW SCENARIO Maturity Type : Limit Maturity Maturity Date : 2039-04-02 Maturity Price : 20.50 Evaluated at bid price : 20.50 Bid-YTW : 7.26 % |
| POW.PR.B | Perpetual-Discount | 3.43 % | YTW SCENARIO Maturity Type : Limit Maturity Maturity Date : 2039-04-02 Maturity Price : 18.11 Evaluated at bid price : 18.11 Bid-YTW : 7.43 % |
| SLF.PR.D | Perpetual-Discount | 3.52 % | YTW SCENARIO Maturity Type : Limit Maturity Maturity Date : 2039-04-02 Maturity Price : 15.28 Evaluated at bid price : 15.28 Bid-YTW : 7.35 % |
| SLF.PR.C | Perpetual-Discount | 3.53 % | YTW SCENARIO Maturity Type : Limit Maturity Maturity Date : 2039-04-02 Maturity Price : 15.25 Evaluated at bid price : 15.25 Bid-YTW : 7.36 % |
| POW.PR.D | Perpetual-Discount | 3.76 % | YTW SCENARIO Maturity Type : Limit Maturity Maturity Date : 2039-04-02 Maturity Price : 17.10 Evaluated at bid price : 17.10 Bid-YTW : 7.36 % |
| RY.PR.A | Perpetual-Discount | 4.22 % | YTW SCENARIO Maturity Type : Limit Maturity Maturity Date : 2039-04-02 Maturity Price : 18.01 Evaluated at bid price : 18.01 Bid-YTW : 6.28 % |
| MFC.PR.C | Perpetual-Discount | 7.30 % | Not a lot of volume, but those who bought were highly motivated! Traded 6,897 shares in a range of 15.35-20 before closing at 16.16-20, 1×8. YTW SCENARIO Maturity Type : Limit Maturity Maturity Date : 2039-04-02 Maturity Price : 16.16 Evaluated at bid price : 16.16 Bid-YTW : 7.04 % |
| Volume Highlights | |||
| Issue | Index | Shares Traded |
Notes |
| RY.PR.X | FixedReset | 301,086 | Recent new issue. YTW SCENARIO Maturity Type : Limit Maturity Maturity Date : 2039-04-02 Maturity Price : 23.16 Evaluated at bid price : 25.07 Bid-YTW : 6.10 % |
| TD.PR.I | FixedReset | 68,965 | Recent new issue. YTW SCENARIO Maturity Type : Limit Maturity Maturity Date : 2039-04-02 Maturity Price : 25.27 Evaluated at bid price : 25.32 Bid-YTW : 5.98 % |
| MFC.PR.D | FixedReset | 46,255 | Recent new issue. YTW SCENARIO Maturity Type : Limit Maturity Maturity Date : 2039-04-02 Maturity Price : 24.85 Evaluated at bid price : 24.90 Bid-YTW : 6.48 % |
| BNS.PR.O | Perpetual-Discount | 39,109 | TD crossed 25,100 at 21.25. YTW SCENARIO Maturity Type : Limit Maturity Maturity Date : 2039-04-02 Maturity Price : 21.31 Evaluated at bid price : 21.31 Bid-YTW : 6.71 % |
| CIU.PR.B | FixedReset | 35,502 | Recent new issue. YTW SCENARIO Maturity Type : Call Maturity Date : 2014-07-01 Maturity Price : 25.00 Evaluated at bid price : 26.75 Bid-YTW : 5.22 % |
| ELF.PR.F | Perpetual-Discount | 35,100 | Desjardins sold 10,000 to Bolder Investment Partners (who?) at 15.00, then crossed 20,200 at the same price. YTW SCENARIO Maturity Type : Limit Maturity Maturity Date : 2039-04-02 Maturity Price : 15.10 Evaluated at bid price : 15.10 Bid-YTW : 8.84 % |
| There were 30 other index-included issues trading in excess of 10,000 shares. | |||
HSBC Bank of Canada has announced:
HSBC Bank Canada (the “Bank”) intends to file an amended and restated prospectus supplement for the previously announced offering of Non-Cumulative 5-Year Rate Reset Class 1 Preferred Shares Series E (the “Preferred Shares Series E”). The amendment is a result of ratings action announced on 31 March 2009 by Standard and Poor’s (“S&P”) on the hybrid capital securities of over 60 European financial institutions, including the Bank’s parent company, HSBC Holdings plc. The S&P ratings of the Preferred Shares Series E of ‘P-1(Low)’ and ‘A’ under S&P’s Canadian and Global Preferred Share Rating scales, respectively, are among the highest of the major Canadian banks.
The Bank and a syndicate of investment dealers led by HSBC Securities (Canada) Inc. and Scotia Capital Inc. (the “Underwriters”) intend to enter into an agreement that will amend in certain respects the underwriting agreement they signed on 24 March 2009 (the “Underwriting Agreement” and together with the amending agreement, the “Amended Underwriting Agreement”). The size of the offering will be unchanged at 7 million shares at a price of $25.00 per share, for gross proceeds of C$175 million. The expected closing date for the offering, previously scheduled for 31 March 2009, will be amended to 8 April 2009.
Pursuant to the Amended Underwriting Agreement, HSBC Bank Canada will grant the Underwriters the option (the “Underwriters’ Option”), exercisable in whole or in part at any time up to two business days prior to closing, to purchase up to an additional 3 million Preferred Shares Series E at the issue price. Should the Underwriters’ Option be fully exercised, the total gross proceeds of the financing will be C$250 million.
The Preferred Shares Series E will entitle the holders to receive non-cumulative preferential fixed quarterly cash dividends if, as and when declared by the board of directors of the Bank, of C$0.4125 per share, to yield 6.60 per cent annually for the initial period ending 30 June 2014. Thereafter, the dividend rate will reset every five years at a rate equal to 4.85 per cent over the then five-year Government of Canada Bond Yield. Subject to regulatory approval, on 30 June 2014 and on 30 June every five years thereafter, the Bank may redeem the Preferred Shares Series E in whole or in part at par.
Based on the anticipated closing date of 8 April 2009, the first dividend on the Preferred Shares Series E will be payable on 30 June 2009 in the amount of C$0.3762 per share.
This resolves the confusion previously noted on PrefBlog. The issue was announced on March 23, with size bumped from $125-million to $175-million same-day.
The release on Newswire is timestamped 8:14 pm, for those who are interested.
Update, 2009-4-6: S&P has released a commentary on HSBC Canada:
Standard & Poor’s Ratings Services today commented on the March 31, 2009, downgrade of the rating on the preferred shares of HSBC Bank Canada (HSBC Canada; AA/Negative/A-1+). On that date, the global scale rating on HSBC Canada’s preferred shares was lowered to ‘A’ from ‘A+’, and the Canada scale rating on these instruments was lowered to ‘P-1(Low)’ from ‘P-1’.
This rating action was a direct consequence of a review of the ratings on the hybrid capital securities of various European banks (see “Hybrid Securities Of Over 60 European Financial Institutions Downgraded Following S&P Review”, published March 31, 2009, on RatingsDirect). One of the groups included in this review was HSBC Canada’s ultimate parent, HSBC Holdings PLC (HSBC Group; AA-/Negative/A-1+), which is U.K.-incorporated.
…
The hybrid capital-related ratings downgrades on HSBC Canada were not related to the previously planned closing date for HSBC Canada’s preferred share issuance on March 31, 2009.
I have communicated my displeasure to HSBC Canada regarding its delay in issuing a press release on this matter. While I am very well aware that it was a nightmarish occurance for them, I think that a March 31 press release to the effect that “Due to S&P’s rating action this morning the issue did not close as planned. HSBC Canada is in discussions with the underwriters to resolve this situation” should have been issued.
The February 26 Seminar on PerpetualDiscounts has been described before, and now, as promised, the video is on-line.
You may subscribe for a week via the PrefLetter Website; you will receive a password that remains valid for one week’s access to the seminar page.
This page contains Flash Video of the seminar (if you can watch YouTube, you can watch the video), or you may download the seminar to your own machine in QuickTime format.
In addition to the video, there are a host of links to articles I have written regarding various elements of the seminar; to the slides used in the seminar; and even to a handy spreadsheet or two.
This access is priced at $100 + tax, with a 50% discount to those with an active year-long subscription to PrefLetter.