Assiduous Readers will know that I am not averse to a little bit of stimulus in this lousy economy. Deficits are fine, provided they’re backed up with credible research showing a good healthy surplus through a business cycle – many of our current problems are the result of What-Debt? and Spend-Every-Penny goosing an already over-stimulated economy with not just tax cuts, but moronic tax cuts – like cutting the GST.
Infrastructure would be a marvellous place to start. It has a very high economic multiplier and is the type of thing that has a very logical end-point, making it possible to turn off the tap without too much controversy – once you’ve built your subway or repaired your bridge … it’s built! There is only so much you can do (take it too far, for instance, and we end up with 1000% over-capacity in the cement industry and a lot of really shoddy construction that has to be torn down), but in Canada and the Western world generally, there is a huge list of neglected infrastructure that would be a Very Good Thing to chip away at.
However, from Japan comes a cautionary tale about idiotic infrastructure spending:
Japan’s $268 million Ibaraki Airport is on schedule to open for business in March 2010. The hard part will be persuading an airline to fly there.
The government and Ibaraki prefecture, home to 3 million people, are paying for the airport north of Tokyo, which won’t have train services and is a half-hour drive from Ibaraki’s capital, Mito. Japan Airlines Corp. and All Nippon Airways Co., which operate 90 percent of flights in the country, don’t plan to use it.
We don’t have to worry about such boondoggles in Canada, though! What-Debt? has reacted forcefully and decisively to the global economic crisis by forcefully and decisively running away from Parliament for eight weeks. See ya!
The Amazing Takeover Bid That Will Never End continued its gyrations today, with Bloomberg reporting:
The private-equity firms that agreed to buy BCE Inc. for C$52 billion ($42 billion) may instead seek to acquire a minority stake in the Canadian phone company, according to two people with knowledge of the plan.
…
The alternative proposal involves the buyers investing C$8 billion to C$10 billion in preferred securities for about 20 percent of BCE. It also calls for a cash dividend of C$8 to C$10 a share to paid to BCE shareholders.
Citigroup Inc., based in New York, and Frankfurt-based Deutsche Bank AG are leading a group of lenders that also includes Toronto-Dominion Bank and Royal Bank of Scotland Group Plc. The banks would need to approve the new transaction. The debt required to finance the minority stake would be around C$7 billion or C$8 billion, compared with the C$34 billion the banks would fund if the buyout went ahead.
Bloomberg also has a piece on Municipal credit rating upgrades, implying skullduggery by S&P. All the data is cherry-picked, of course, so whether there’s an actual trend or not remains to be see. But I bring this up because of the most interesting quote:
Recent default studies suggesting municipalities’ enhanced creditworthiness don’t account for what happened to issuers during the Great Depression, according to Richard Ciccarone, chief research officer of McDonnell Investment Management LLC. The Oak Brook, Illinois-based firm has $12 billion under management, including municipal bonds.
In 1929, more than 98 percent of the largest U.S. cities were rated Aa or better, according to Ciccarone’s research, which cites a study of municipal bonds showing that 3,252 issues went into default at the peak of the economic contraction in 1935. Almost half the bonds in default were rated Aaa in 1929.
“We may be facing the same conditions today that we did in the 1930s, but they could be worse because of pension and other liabilities,” Ciccarone said. “We have some huge liabilities at the same time that real estate values are falling.”
Yo! Ciccarone! Get with the programme! There’s some political theatre that needs to be played out! What do you think you are, some kind of investment expert or something?
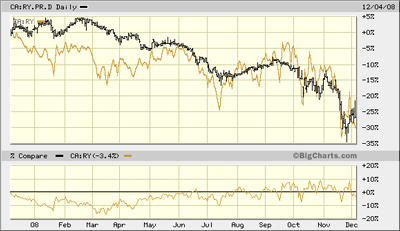
I got a little curious today about relative performances;
RY.PR.D vs. common:
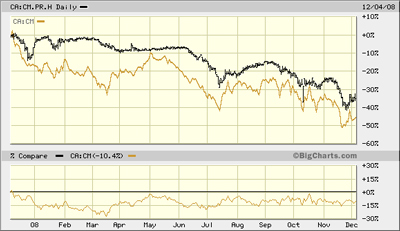
CM.PR.H vs common:
Make of it what you will.
Volume continued heavy today; volume and price advances in split shares were again particularly noteworthy.
Note that these indices are experimental; the absolute and relative daily values are expected to change in the final version. In this version, index values are based at 1,000.0 on 2006-6-30.
The Fixed-Reset index was added effective 2008-9-5 at that day’s closing value of 1,119.4 for the Fixed-Floater index. |
| Index |
Mean Current Yield (at bid) |
Mean YTW |
Mean Average Trading Value |
Mean Mod Dur (YTW) |
Issues |
Day’s Perf. |
Index Value |
| Ratchet |
N/A |
N/A |
N/A |
N/A |
0 |
N/A |
N/A |
| Fixed-Floater |
7.06% |
7.40% |
78,618 |
13.22 |
6 |
-0.3933% |
748.0 |
| Floater |
9.20% |
9.47% |
64,655 |
9.75 |
2 |
+5.5443% |
384.9 |
| Op. Retract |
5.50% |
6.97% |
142,959 |
4.19 |
15 |
+0.4110% |
981.0 |
| Split-Share |
7.25% |
14.45% |
67,284 |
3.93 |
14 |
+0.8939% |
845.9 |
| Interest Bearing |
9.64% |
21.26% |
58,029 |
2.86 |
3 |
-1.6837% |
759.4 |
| Perpetual-Premium |
N/A |
N/A |
N/A |
N/A |
N/A |
N/A |
N/A |
| Perpetual-Discount |
7.89% |
8.01% |
199,387 |
11.41 |
71 |
+0.3262% |
700.2 |
| Fixed-Reset |
6.13% |
5.59% |
1,046,273 |
14.20 |
15 |
-0.0511% |
974.2 |
| Major Price Changes |
| Issue |
Index |
Change |
Notes |
| BSD.PR.A |
InterestBearing |
-8.0717% |
Asset coverage of 0.9-:1 as of November 28, according to Brookfield Funds. Still rated Pfd-2(low) by Dumb Bunnies “R” Us. Now with a pre-tax bid-YTW of 25.34% based on a bid of 4.10 and a hardMaturity 2015-3-31 at 10.00. Closing quote of 4.10-38, 55×1. Day’s range of 4.11-46. |
| SLF.PR.C |
PerpetualDiscount |
-6.1224% |
Now with a pre-tax bid-YTW of 8.09% based on a bid of 13.80 and a limitMaturity. Closing quote 13.80-10, 3X3. Day’s range of 13.70-14.72. |
| BCE.PR.Z |
FixFloat |
-5.9377% |
|
| RY.PR.G |
PerpetualDiscount |
-4.7205% |
Now with a pre-tax bid-YTW of 7.42% based on a bid of 15.34 and a limitMaturity. Closing quote 15.34-64, 3×15. Day’s range of 15.30-99. |
| FBS.PR.B |
SplitShare |
-4.0541% |
Asset coverage of 1.1+:1 as of November 27, according to TD Securities. Now with a pre-tax bid-YTW of 17.55% based on a bid of 7.10 and a hardMaturity 2011-12-15 at 10.00. Closing quote of 7.10-39, 58×10. Day’s range of 7.10-50. |
| W.PR.H |
PerpetualDiscount |
-3.0109% |
Now with a pre-tax bid-YTW of 9.31% based on a bid of 15.14 and a limitMaturity. Closing quote 15.55-74, 3×2. Day’s range of 15.50-75. |
| W.PR.J |
PerpetualDiscount |
-2.9468% |
Now with a pre-tax bid-YTW of 9.47% based on a bid of 15.15 and a limitMaturity. Closing quote 15.14-49, 2×2. Day’s range of 15.02-60. |
| TCA.PR.Y |
PerpetualDiscount |
-2.6277% |
Now with a pre-tax bid-YTW of 7.11% based on a bid of 15.30 and a limitMaturity. Closing quote 40.02-00, 7X5. Day’s range of 40.50-48. |
| LBS.PR.A |
SplitShare |
-2.5714% |
Asset coverage of 1.4+:1 as of November 27, according to Brompton Group. Now with a pre-tax bid-YTW of 14.12% based on a bid of 6.82 and a hardMaturity 2013-11-29 at 10.00. Closing quote of 6.82-10, 10×5. Day’s range of 6.82-00. |
| BNS.PR.K |
PerpetualDiscount |
-2.3214% |
Now with a pre-tax bid-YTW of 7.44% based on a bid of 16.41 and a limitMaturity. Closing quote 16.41-60, 5X3. Day’s range of 16.40-25. |
| WFS.PR.A |
SplitShare |
-2.2360% |
Asset coverage of 1.3-:1 as of November 30 according to Mulvihill. Now with a pre-tax bid-YTW of 16.30% based on a bid of 7.87 and a hardMaturity 2011-6-30 at 10.00. Closing quote of 7.87-04, 10×35. Day’s range of 7.77-93. |
| BCE.PR.Y |
FixFloat |
-2.1407% |
|
| CM.PR.D |
PerpetualDiscount |
-2.0443% |
Now with a pre-tax bid-YTW of 8.50% based on a bid of 17.25 and a limitMaturity. Closing quote 17.25-39, 5×8. Day’s range of 17.00-98. |
| RY.PR.W |
PerpetualDiscount |
+2.0286% |
Now with a pre-tax bid-YTW of 7.24% based on a bid of 17.10 and a limitMaturity. Closing quote 17.10-15, 8×83. Day’s range of 16.75-64. |
| CM.PR.J |
PerpetualDiscount |
+2.1180% |
Now with a pre-tax bid-YTW of 8.50% based on a bid of 13.50 and a limitMaturity. Closing quote 13.50-55, 8×1. Day’s range of 13.38-73. |
| SBC.PR.A |
SplitShare |
+2.2727% |
Asset coverage of 1.5-:1 as of November 27 according to Brompton Group. Now with a pre-tax bid-YTW of 13.36% based on a bid of 7.65 and a hardMaturity 2012-11-30 at 10.00. Closing quote of 7.65-99, 36×9. Day’s range of 7.75-00. |
| BMO.PR.K |
PerpetualDiscount |
+2.4209% |
Now with a pre-tax bid-YTW of 8.05% based on a bid of 16.50 and a limitMaturity. Closing quote 16.50-68, 1×15. Day’s range of 16.00-69. |
| PWF.PR.G |
PerpetualDiscount |
+2.5641% |
Now with a pre-tax bid-YTW of 8.35% based on a bid of 18.00 and a limitMaturity. Closing quote 18.00-75, 3×2. Day’s range of 17.55-19.08. |
| BAM.PR.K |
Floater |
+2.8767% |
|
| BAM.PR.N |
PerpetualDiscount |
+3.3266% |
Now with a pre-tax bid-YTW of 12.01% based on a bid of 10.25 and a limitMaturity. Closing quote 10.25-34, 13×1. Day’s range of 10.00-44. |
| BMO.PR.H |
PerpetualDiscount |
+3.9251% |
Now with a pre-tax bid-YTW of 7.79% based on a bid of 17.21 and a limitMaturity. Closing quote 17.20-54, 4×11. Day’s range of 16.65-17.80. |
| DFN.PR.A |
SplitShare |
+4.1162% |
Asset coverage of 1.9-:1 as of November 14 according to the company. Now with a pre-tax bid-YTW of 8.34% based on a bid of 8.60 and a hardMaturity 2014-12-1 at 10.00. Closing quote of 8.60-77, 5×2. Day’s range of 8.37-97. |
| FTN.PR.A |
SplitShare |
+4.5089% |
Asset coverage of 1.6-:1 as of November 28, according to the company. Now with a pre-tax bid-YTW of 13.22% based on a bid of 6.49 and a hardMaturity 2015-12-1 at 10.00. Closing quote of 6.49-63, 2×10. Day’s range of 6.47-89. |
| CL.PR.B |
PerpetualDiscount |
+5.0000% |
Now with a pre-tax bid-YTW of 7.86% based on a bid of 19.95 and a limitMaturity. Closing quote 19.95-24, 6×4. Day’s range of 18.10-20.25 (!) |
| PWF.PR.I |
PerpetualDiscount |
+5.6338% |
Now with a pre-tax bid-YTW of 8.15% based on a bid of 18.75 and a limitMaturity. Closing quote 18.51-00, 5×3. Day’s range of 17.75-18.75. |
| BCE.PR.G |
FixFloat |
+6.8302% |
|
| FFN.PR.A |
SplitShare |
+6.8966% |
Asset coverage of 1.4+:1 as of November 14 according to the company. Now with a pre-tax bid-YTW of 15.31% based on a bid of 6.20 and a hardMaturity 2014-12-1 at 10.00. Closing quote of 6.20-83, 32×1. Day’s range of 6.01-20. |
| BNA.PR.B |
SplitShare |
+7.0664% |
Asset coverage of 1.6+:1 as of December 4 based on BAM.A at 16.72 and 2.4 BAM.A per unit. Now with a pre-tax bid-YTW of 13.93% based on a bid of 15.00 and a hardMaturity 2016-3-25 at 25.00. Closing quote of 15.00-58, 14×4. Day’s range of 14.11-15.34. |
| BAM.PR.J |
OpRet |
+7.5862% |
Now with a pre-tax bid-YTW of 12.65% based on a bid of 15.60 and a softMaturity 2018-3-30 at 25.00. Closing quote of 15.60-16.70, 3×1. Day’s range of 13.95-16.50. |
| BAM.PR.B |
Floater |
+8.1461% |
|
| Volume Highlights |
| Issue |
Index |
Volume |
Notes |
| PIC.PR.A |
Scraps (Would be SplitShare but there are credit concerns) |
222,957 |
RBC crossed 201,800 at 11.80. Asset coverage of 1.2-:1 as of November 30 according to Mulvihill. Now with a pre-tax bid-YTW of 21.27% based on a bid of 11.61 and a hardMaturity 2010-11-1 at 15.00. |
| WN.PR.E |
Scraps (would be PerpetualDiscount but there are credit concerns) |
114,677 |
Desjardins crossed 100,000 at 14.42. Now with a pre-tax bid-YTW of 8.59% based on a bid of 14.20 and a limitMaturity. |
| BNA.PR.B |
SplitShare |
105,365 |
Desjardins crossed 100,000 at 14.50. Asset coverage of 1.6+:1 as of December 4 based on BAM.A at 16.72 and 2.4 BAM.A per unit. Now with a pre-tax bid-YTW of 13.93% based on a bid of 15.00 and a hardMaturity 2016-3-25 at 25.00. Closing quote of 15.00-58, 14×4. Day’s range of 14.11-15.34. |
| WN.PR.D |
Scraps (would be PerpetualDiscount but there are credit concerns) |
103,819 |
Desjardins crossed 100,000 at 16.50. Now with a pre-tax bid-YTW of 8.13% based on a bid of 16.40 and a limitMaturity. |
| TD.PR.M |
OpRet |
101,850 |
CIBC crossed 100,000 at 25.35. Now with a pre-tax bid-YTW of 4.59% based on a bid of 25.26 and a softMaturity 2013-10-30 at 25.00. |
| BAM.PR.I |
OpRet |
91,965 |
TD crossed 85,000 at 17.75. Now with a pre-tax bid-YTW of 13.99% based on a bid of 17.80 and a softMaturity 2013-12-30 at 25.00. |
| CM.PR.H |
PerpetualDiscount |
68,349 |
Now with a pre-tax bid-YTW of 8.47% based on a bid of 14.44 and a limitMaturity. |
| BNS.PR.N |
PerpetualDiscount |
64,566 |
National crossed 40,000 at 17.82. Now with a pre-tax bid-YTW of 7.52% based on a bid of 17.74 and a limitMaturity. |
There were sixty-one index-included $25-pv-equivalent issues trading over 10,000 shares today