Month: January 2009

MAPF

MAPF Portfolio Composition: December 2008

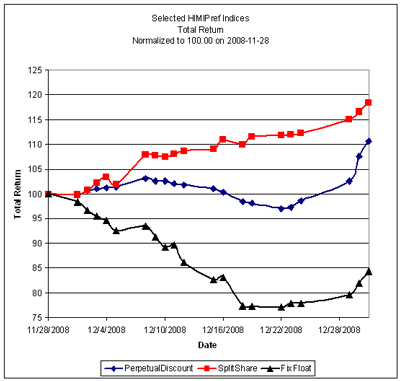
Trading was frenzied in December as a hesitant rally in PerpetualDiscounts was swamped by a wave of tax-loss selling and then skyrocketted after the selling pressure lifted. Meanwhile, SplitShares enjoyed a sharp recovery from their November trough and BCE issues (which comprised the whole of the FixFloat index until the month-end rebalancing) reacted very badly to news of the failure of the BCE / Teachers’ Deal:

Trades were, as ever, triggered by a desire to exploit transient mispricing in the preferred share market (which may the thought of as “selling liquidity”), rather than any particular view being taken on market direction, sectoral performance or credit anticipation.

MAPF Sectoral Analysis 2008-12-31
HIMI Indices Sector Weighting YTW ModDur
Ratchet 0% N/A N/A
FixFloat 9.2% (+9.2) 8.50% 12.22
Floater 0% N/A N/A
OpRet 0% N/A N/A
SplitShare
(normal)
12.3% (-21.1) 17.01% 5.55
SplitShare
(tendered)
20.7% (+20.7) 9.52% 3.79
Interest Rearing 0% N/A N/A
PerpetualPremium 0.0% (0) N/A N/A
PerpetualDiscount 58.6% (-7.9) 7.49% 12.00
Scraps 0% N/A N/A
Cash -0.8% (-0.9) 0.00% 0.00
Total 100% 9.24% 9.62
Totals and changes will not add precisely due to rounding. Bracketted figures represent change from October month-end. Cash is included in totals with duration and yield both equal to zero.

The “total” reflects the un-leveraged total portfolio (i.e., cash is included in the portfolio calculations and is deemed to have a duration and yield of 0.00.). MAPF will often have relatively large cash balances, both credit and debit, to facilitate trading. Figures presented in the table have been rounded to the indicated precision.

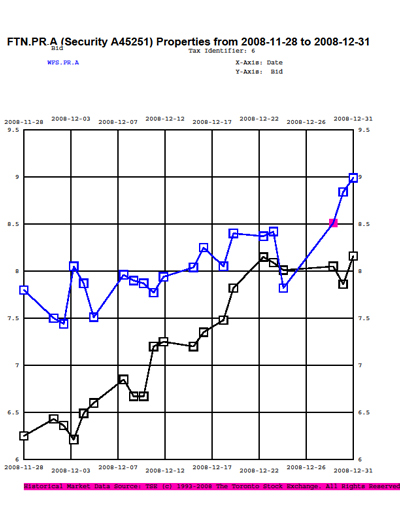
Positions held in WFS.PR.A and FTN.PR.A were tendered for their monthly retraction on their final dates (as per the fund’s sub-custodian): Dec 18 & Dec 11, respectively. I expect these retractions to be profitable, but not as profitable as they seemed at the time, since the market closed much of the gap between the trading price and the estimated retraction price between the tender date and the retraction dates of December 31:


Click Image for full-size PDF

Still, that’s the price you pay for caution! My very rough estimate of the retraction prices are $9.60 for WFS.PR.A and $8.32 for FTN.PR.A, but much depends on what price the issuer paid for the capital units required to make matched pairs.

Many readers will be more interested in the fixed-floater position: BCE.PR.I was purchased in two pieces on December 22 and December 23, following news that the normal course issuer bid would be restricted to 5% of outstanding common (which gives some comfort that the company will remain investment grade) and the DBRS pronouncement that Bell Canada (the operating subsidiary) is under credit review positive. These pieces of reassurance and the continued collapse of the share price (see chart above for fixed-floater total return) tipped the scales.

Post-Mortem on BCE.PR.I Purchase
Date BCE.PR.I SLF.PR.E BMO.PR.K NA.PR.L
Nov. 28 17.00 13.60 16.75 15.00
Dec. 22 Bought
13.00
Sold
12.50
   
Dec 23 Bought
13.03
  Sold
15.50
Sold
14.36
Closing Bid
Dec 31
13.50 15.18 18.51 15.58
Dividend
Effects
Earned
$0.29
None None None

I mourn the absence of the PerpetualDiscounts which were swapped into the BCE.PR.I, but that’s life! I will note that on January 2, BCE.PR.I closed with a bid of $14.71 having traded as high as $15.49 on the day … so I won’t throw away the valuation model just yet! I will note that these trades have decreased the mis-match between the fund and the index.

Credit distribution is:

MAPF Credit Analysis 2008-12-31
DBRS Rating Weighting
Pfd-1 56.1% (-0.6)
Pfd-1(low) 3.1% (-7.4)
Pfd-2(high) 0% (0)
Pfd-2
(held)
2.0% (+1.6)
Pfd-2
(tendered for retraction)
9.3% (+9.3)
Pfd-2(low)
(held)
19.0% (-13.3)
Pfd-2(low)
(tendered for retraction)
11.4% (+11.4)
Cash -0.8% (-0.9)
Totals will not add precisely due to rounding. Bracketted figures represent change from November month-end.

The fund does not set any targets for overall credit quality; trades are executed one by one. Variances in overall credit will be constant as opportunistic trades are executed. The overall credit quality of the portfolio is now roughly equal to the credit quality of CPD at August month-end.

The lowest rated issues in the portfolio are the previously discussed BCE.PR.I and BNA.PR.C. The latter issue is an entirely reasonable credit; a split share secured by shares of BAM.A with asset coverage of about 1.8:1. In fact, the fund topped up its holdings of BNA.PR.C in December … the price has continued weak, but the yield of approximately 19% is very hard to resist! I will note that given a price of $9.00 for BNA.PR.C the asset coverage of the market price is approximately 5:1 … so I consider the investment well secured!

Liquidity Distribution is:

MAPF Liquidity Analysis 2008-12-31
Average Daily Trading Weighting
<$50,000 0.6% (-10.5)
$50,000 – $100,000
(held)
1.2% (-31.0)
$50,000 – $100,000
(tendered for retraction)
9.3% (+9.3)
$100,000 – $200,000
(held)
31.2% (+30.2)
$100,000 – $200,000
(tendered for retraction)
11.4% (+11.4)
$200,000 – $300,000 30.3% (+10.0)
>$300,000 16.9% (-15.3)
Cash -0.8% (-0.9)
Totals will not add precisely due to rounding. Bracketted figures represent change from November month-end.

MAPF is, of course, Malachite Aggressive Preferred Fund, a “unit trust” managed by Hymas Investment Management Inc. Further information and links to performance, audited financials and subscription information are available the fund’s web page. A “unit trust” is like a regular mutual fund, but is sold by offering memorandum rather than prospectus. This is cheaper, but means subscription is restricted to “accredited investors” (as defined by the Ontario Securities Commission) and those who subscribe for $150,000+. Fund past performances are not a guarantee of future performance. You can lose money investing in MAPF or any other fund.

A similar portfolio composition analysis has been performed on The Claymore Preferred Share ETF (symbol CPD) as of August 29. When comparing CPD and MAPF:

  • MAPF credit quality is similar
  • MAPF liquidity is higher
  • MAPF Yield is higher
  • Weightings in
    • PerpetualDiscounts is similar
    • MAPF is less exposed to Fixed-Resets and Operating Retractibles
    • MAPF is more exposed to SplitShares
    • FixFloat / Floater / Ratchet is similar
Reader Initiated Comments

Shut Up and Clip Your Coupons!

Ellen Roseman of the Toronto Star has been kind enough to publish some remarks I made about a preferred share portfolio.

The situation is probably common enough to be republished here … although after the last week of phenomenal returns, the querant is probably feeling a little better:

Since June, the preferred shares in my portfolio are down in market value by $165,000$ on an original purchase price of about $300,000.

I am approaching retirement and whenever I talk to my financial adviser at RBC Dominion Securities, he reassures me that I will continue to receive all interest payments AND the full amount of my original purchases when the preferred shares mature or are called.

If preferreds are less volatile, why are the original values down by a whopping 50 per cent?!!!!!!!!!

I own a mix of Perpetuals and Retractables but I am no financial wizard. I have spoken to a new financial adviser at the the National Bank and he implies that I am indeed in trouble with the preferreds, especially the Perpetuals. He is implying that I will have to sell at least some at a loss.

Here is the descriptive list of my holdings in preferreds as supplied to me by my broker.

These assets are down -45.8% to date!!!! My broker insists that I will continue to collect full interest payments until the Preferreds are called or redeemed, AND, when they are called, it will be at the full purchase price, which is fixed at $25 per unit.

The only impediment to this process is, of course, if any company issuing said Preferreds would go bankrupt.

I would like to know from your expert in preferred shares the following:

1) Is my broker’s contention that I will receive full interest payments and full unit value a correct interpretation?

2) Is there any chance that these assets could return to full original value when and if the markets recover?

3) Do I have any options with these preferreds, other than selling at a loss? Am I helplessly locked into these positions?

4) Was this a misguided tactic (to save on taxes) by putting 40 per cent of a 64-year-old client’s assets into preferreds and call it “fixed income”?

5) And lastly, should any client pay fees, under these circumstances, to a broker just to sit and wait for bonds and preferreds to mature?

Ellen, thank you sincerely for helping me on this matter. An independent analysis will assist me immeasurably to finally take the right road to recovery. Naturally I will wish you a happy and healthy 2009!

BAM split corp. series c–pfd2L

Bank of Montreal non cum.class B series 13, 4.50% pfd1

Bank of N.S. non-cum series 14, 4.50% pfd 1
BNS non-cum series 15, 4.50% pfd 1
BNS non-cum series 16 , 5.25% pfd 1
BNS non-cum, series 22, 5.00% pfd 1

BCE fix/ float cum. Red series AC 4.6% BBP P2 Neg.

Brookfield Asset Mgmt. Class A series 18, 4.75% pfd 2L
Brookfield Properties 5.00% Class AAA series J bb+p3h
Brookfield Properties 5.20% Class AAA series K BB+P3H

CIBC 4.50% non-cum class A Pref. series 32 pfd1

Dundee Corp 5.00% cum, ser 1 P3

Epcor Power Equity 4.85% cum redeem pref. series 1 pfd 3H

George Weston Ltd. 5.20% cum- pref, series 4 pfd3

Great West Lifeco NON-CUM SERIES H 4.85% pfd1L
Great West Lifeco Inc. 4.5% non cum 1st pref. series 1 pfd 1L

HSBC Bank Canada 5.10% non-cum Red. c1 1 prefd. series c

Laurentien Bank non cum class A series 10 5.25% pfd3

National Bank series non cum 16 4.85% pfd1

Power Financial non cum series L 1st pref 5.10% pfd 1

Royal Bank non cum 1st Pref 4.70 series AB pfd1

Sun Life Financial 4.45% class A non cum. series 3 pfd 1

TD Bank non cum. class A Series P 5.25% pfd1

I trust these are the details that you need. My meeting with a new prospective broker is slated for Jan. 14.

… and my response was …

Well, I can tell you that this has been the worst year for preferreds since at least 1993 (when my records start).

In fact, of the 12 worst months since Dec. 31, 1993, six have been this year.

PerpetualDiscount issues (the most common type of preferred) are down 26.24% in the year to Dec. 24, 2008, and that’s total return (which includes dividends).

Since the beginning of the current bear market on Mar. 31, 2007, total return has been -35.83%.

The index tracking ETF (stock symbol CPD) ended 2007 with a Net Asset Value of $17.95. It has paid distributions in 2008 of about 84 cents and now has a Net Asset Value (at the close on 12/24) of $12.92.

CPD has its problems (see http://www.prefblog.com/?p=3478) but is the best publicly available snapshot of the investment-grade preferred share universe as a whole.

I’ve been receiving queries like this for the past year – interestingly, most of these have been from brokers asking me what to tell their clients.

In the case of, for instance, bank perpetuals, I tell them to tell their clients: “Hey – you bought the things for a (say) $1.15 p.a. dividend; they continue to pay a $1.15 p.a. dividend, there is no current indication they will ever fail to pay a $1.15 p.a. dividend … shut up and clip your coupons.”

Weights of the issues in the portfolio are not given. All subsequent analysis assumes equal-weighting.

The portfolio contains the following types of preferreds (see http://www.prefletter.com/whatPrefLetter.php):

Fixed-Reset: 1

FixedFloater: 1

Operating-Retractible: 3

Perpetual Discount: 17

SplitShare: 1

This is heavy on the PerpetualDiscounts (which represent about half the issues tracked by my analytics), which have underperformed this year. It’s light on Operating Retractibles & SplitShares, which have done better.

Preferred Share dividends may be halted at any time at the discretion of the company. A dividend halt is generally a last-ditch effort to save the company and there is no immediate danger of a halt in any of the issues held.

The credit ratings (which were supplied by the broker) are an attempt to estimate the chance of a future halt in dividends, or other inability to meet the terms of the prospectus. The breakdown is:

Pfd-1/Pfd-1 (low): 14

Pfd-2 (low): 3

Pfd-3 (high)/ Pfd-3/Pfd-3 (low): 6

This isn’t bad. There are more Pfd-3 issues than I like (I recommend no more than 10% of the portfolio in these lower-grade credits, with no more than 5% in a single name).

But there are also more Pfd-1/Pfd-1(low) names than I would normally expect. See http://www.prefblog.com/?p=211 for more about credit ratings.

With four names in the Brookfield group, the exposure there is a little high. I would recommend an exposure of no more than 10% of portfolio value in this name.

There is no information given about performance, other than the vague “-45.8% to date!!!!”

My dad’s house is up around 3,000% from his purchase price, while mine is up only about 50%, but that means nothing – we purchased at different times, that’s all.

To address the specific questions:

1) As mentioned above, there is no immediate fear of a dividend halt on any of these issues – although lightning can strike anywhere at any time. If the shares are redeemed, consent of the shareholders would be required to do this at any price other than par.

2) The OperatingRetractible & SplitShare issues have retraction dates, at which time you may force the company to return the principal, or to give you common stock with a value (probably) in excess of the principal. It depends on the terms of the prospectus, but for these issues you may reasonably expect to receive par value on the retraction date.

As far as the PerpetualDiscounts are concerned, it depends on what you mean by “recover”. They each pay $X of dividends per annum. If the issuers can issue replacement shares paying less than $X, it will be in their interest to call the shares at par and issue new ones that are cheaper for them. We might arrive at this situation tomorrow. It might happen next year. It might never happen. I certainly can’t predict the future levels of interest rates with any confidence!

3) None of the shares have an immediate retraction option.

4) Complex! It is not clear what is meant by “put” – is the portfolio advisory or discretionary? What instructions were given to the broker? What are the client objectives and risk tolerance, and what does the Know Your Client form show? What performance benchmarks were specified?

As far as the 40% of assets are concerned, what form does the other 60% take? My rule of thumb is that no more than 50% of the total fixed income portion of a portfolio should be in preferred shares.

As far as calling them “fixed income” is concerned, I’m not sure what else one might call them.

5) It depends on how much the fees are and what services are offered. I suspect that the broker is simply buying the occasional new issue and taking his 3% (issuer-paid) commission, in which case the continuing fees are nil.

My own fund (see http://www.himivest.com/malachite/MAPFMain.php) charges a fee of 1% p.a. on the first half-million, and has expenses on top of that of 0.50%.

It is down substantially both this year and last – but has handsomely outperformed its benchmark since inception due to active management. I suspect my performance – after fees and expenses – exceeds that of the reader’s portfolio, but the portfolio return is not specified here.

Besides the fund, I offer two services which may be considered helpful: a monthly newsletter (http://www.prefletter.com) and portfolio review. I’ll review this portfolio, with specific buy/sell/hold recommendations taylored to client investment objectives, for $1,000.

Sincerely,

HYMAS INVESTMENT MANAGEMENT INC.

James Hymas

President

There was one interesting snippet in the query that hadn’t been in the extract I saw: I have spoken to a new financial adviser at the the National Bank and he implies that I am indeed in trouble with the preferreds, especially the Perpetuals. He is implying that I will have to sell at least some at a loss.

Well, of course that’s what the new guy said. It’s plain from the tone of the query that that’s what the client wanted to hear and by some kind of amazing coincidence, that’s what he was told.

But my question is: on what grounds does the client believe the new guy is better than the old one? Does either advisor publish an audited track record?

Market Action

January 2, 2009

Great news! I’ve made the switchover to the “December Revision” of the HIMIPref™ Preferred Indices for daily reporting purposes. While this may not mean a lot to you, it is very important to me, since the tables are prepared programmatically.

There’s some problems: inclusion of dividend effects is haphazard at best and for some reason the tables on daily performance and volume are getting the index assignments wrong, but I’ll figure out how to address these quirks shortly. The main thing is: I can now push a button and get my damn reports output by HIMIPref™ as nice clean HTML code … or at least, it will be clean once I get some other quirks ironed out.

This will save me considerable time!

And – oh, yeah – the market was up again today. But then, the market always goes up, doesn’t it?

These values reflect the December 2008 Revision of the HIMIPref™ Indices
Effects of dividends are not incorporated into the daily updates at this time.
Index Mean
Current
Yield
(at bid)
Median
YTW
Median
Average
Trading
Value
Median
Mod Dur
(YTW)
Issues Day’s Perf. Index Value
Ratchet 7.16 % 7.65 % 31,187 13.36 2 8.3712 % 862.3
FixedFloater 7.81% 7.68 % 153,247 13.13 8 4.5619% 1,309.2
Floater 5.94 % 5.61 % 34,403 14.53 4 4.1898% 1,028.0
OpRet 5.42 % 4.80 % 127,701 4.05 15 0.3454% 1,974.7
SplitShare 6.31 % 10.23 % 75,880 4.18 15 0.2140 % 1,762.7
Interest-Bearing 7.55 % 15.94 % 48,596 0.94 2 2.0126 % 1,873.1
Perpetual-Premium 0.00 % 0.00 % 0 0.00 0 2.5183 % 1,504.4
Perpetual-Discount 7.09 % 7.20 % 245,625 12.35 71 2.5183 % 1,385.5
FixedReset 5.90 % 4.79 % 789,307 15.32 18 0.4754% 1,801.9
Issue Index Change Notes
IAG.PR.A PerpetualPremium -3.24 % Now with a pre-tax bid-YTW of 7.62% based on a bid of 15.25 and a limitMaturity. Closing quote of 15.25-17.49 (!) 2×2. No trades.
WFS.PR.A SplitShare -2.00 % Asset coverage of 1.2-:1 as of Dec. 22 according to Mulvihill. Now with a pre-tax bid-YTW of 10.93% based on a bid of 8.81 and a hardMaturity 2011-6-30 at 10.00. Closing quote of 8.81-17, 3×1. No Trades.
CM.PR.R OpRet -1.52 % Now with a pre-tax bid-YTW of 4.80% based on a bid of 25.21 and a softMaturity 2013-4-29 at 25.00. Closing quote of 25.21-99, 8×5. No trades.
IAG.PR.C FixedReset -1.50 %  
SBN.PR.A SplitShare -1.08 % Asset coverage of 1.6-:1 as of December 22 according to Mulvihill. Now with a pre-tax bid-YTW of 7.11% based on a bid of 9.15 and a hardMaturity 2014-12-1 at 10.00. Closing quote of 9.15-48, 18×3. No trades.
CM.PR.H PerpetualDiscount 1.09 % Now with a pre-tax bid-YTW of 7.23% based on a bid of 16.66 and a limitMaturity. Closing quote of 16.66-81, 1×1. Day’s range of 16.50-96.
BNS.PR.R FixedReset 1.14 %  
CM.PR.K FixedReset 1.16 %  
BNA.PR.B SplitShare 1.20 % Asset coverage of 1.8+:1 based on BAM.A at 18.81 and 2.4 BAM.A per preferred. Now with a pre-tax bid-YTW of 8.67% based on a bid of 20.25 and a hardMaturity 2016-3-25 at 25.00. Closing quote of 20.25-74, 5×1. No trades.
LBS.PR.A SplitShare 1.26 % Asset coverage of 1.4-:1 as of December 31 according to Brompton Group. Now with a pre-tax bid-YTW of 10.46% based on a bid of 8.05 and a hardMaturity 2013-11-29 at 10.00. Closing quote of 8.05-46, 199×1. No trades.
RY.PR.D PerpetualDiscount 1.27 % Now with a pre-tax bid-YTW of 6.53% based on a bid of 17.52 and a limitMaturity. Closing quote of 17.52-01, 1×2. Day’s range of 17.55-75.
ALB.PR.A SplitShare 1.32 % Asset coverage of 1.1+:1 as of December 23 according to Scotia. Now with a pre-tax bid-YTW of 16.09% based on a bid of 19.91 and a hardMaturity 2011-2-28 at 25.00. Closing quote of 19.91-89, 40×1. No trades.
CU.PR.A PerpetualDiscount 1.33 % Now with a pre-tax bid-YTW of 6.91% based on a bid of 21.30 and a limitMaturity. Closing quote of 21.30-75, 5×2. Day’s range of 21.25-72.
CM.PR.D PerpetualDiscount 1.40 % Now with a pre-tax bid-YTW of 7.39% based on a bid of 19.53 and a limitMaturity. Closing quote of 19.53-75, 2×3. Day’s range of 19.10-75.
BNS.PR.M PerpetualDiscount 1.47% Now with a pre-tax bid-YTW of 6.63% based on a bid of 17.02 and a limitMaturity. Closing quote of 17.02-42, 3×3. Day’s range of 16.57-42.
RY.PR.C PerpetualDiscount 1.54 % Now with a pre-tax bid-YTW of 6.58% based on a bid of 17.78 and a limitMaturity. Closing quote of 17.02-42, 3×3. Day’s range of 16.57-42.
W.PR.J PerpetualDiscount 1.57 % Now with a pre-tax bid-YTW of 8.38% based on a bid of 16.83 and a limitMaturity. Closing quote of 16.83-55, 4×1. No trades.
RY.PR.B PerpetualDiscount 1.90% Now with a pre-tax bid-YTW of 6.54% based on a bid of 18.26 and a limitMaturity. Closing quote of 18.26-45, 9×8. Day’s range of 18.00-45.
BNS.PR.J PerpetualDiscount 1.93% Now with a pre-tax bid-YTW of 6.70% based on a bid of 19.65 and a limitMaturity. Closing quote of 19.65-80, 20×3. Day’s range of 19.43-80.
RY.PR.W PerpetualDiscount 2.01 % Now with a pre-tax bid-YTW of 6.45% based on a bid of 19.30 and a limitMaturity. Closing quote of 19.30-49, 10×9. Day’s range of 19.25-35.
TCA.PR.Y PerpetualDiscount 2.01% Now with a pre-tax bid-YTW of 6.67% based on a bid of 42.10 and a limitMaturity. Closing quote of 42.10-62, 7×6. Day’s range of 41.42-42.63.
NA.PR.N FixedReset 2.08 %  
CM.PR.E PerpetualDiscount 2.11 % Now with a pre-tax bid-YTW of 7.26% based on a bid of 19.35 and a limitMaturity. Closing quote of 19.35-39, 1×2. Day’s range of 19.35-49.
HSB.PR.D PerpetualDiscount 2.23% Now with a pre-tax bid-YTW of 7.46% based on a bid of 16.93 and a limitMaturity. Closing quote of 16.93-25, 13×1. Day’s range of 16.85-39
CM.PR.G PerpetualDiscount 2.23 % Now with a pre-tax bid-YTW of 7.22% based on a bid of 18.76 and a limitMaturity. Closing quote of 18.76-80, 1×5. Day’s range of 18.39-00.
ELF.PR.G PerpetualDiscount 2.34 % Now with a pre-tax bid-YTW of 8.54% based on a bid of 14.00 and a limitMaturity. Closing quote of 14.00-71, 6×8. Day’s range of 14.00-75.
CL.PR.B PerpetualDiscount 2.41 % Now with a pre-tax bid-YTW of 7.43% based on a bid of 21.25 and a limitMaturity. Closing quote of 21.25-49, 2×2. Day’s range of 21.24-48.
BNS.PR.N PerpetualDiscount 2.43% Now with a pre-tax bid-YTW of 6.65% based on a bid of 19.80 and a limitMaturity. Closing quote of 19.80-00, 5×8. Day’s range of 19.80-00.
BAM.PR.K Floater 2.54 %  
BNS.PR.Q FixedReset 2.62%  
BMO.PR.H PerpetualDiscount 2.65 % Now with a pre-tax bid-YT
W of 7.09% based on
a bid of 19.01 and a limitMaturity. Closing quote of 19.01-40, 7×3. Day’s range of 18.65-40.
BMO.PR.K PerpetualDiscount 2.65 % Now with a pre-tax bid-YTW of 7.02% based on a bid of 19.00 and a limitMaturity. Closing quote of 19.00-35, 1×5. Day’s range of 18.75-00.
ELF.PR.F PerpetualDiscount 2.65 % Now with a pre-tax bid-YTW of 8.61% based on a bid of 15.50 and a limitMaturity. Closing quote of 15.50-00, 1×10. Day’s range of 15.50-86.
RY.PR.I FixedReset 2.67 %  
RY.PR.F PerpetualDiscount 2.69 % Now with a pre-tax bid-YTW of 6.58% based on a bid of 17.20 and a limitMaturity. Closing quote of 17.20-42, 3×5. Day’s range of 17.00-40.
TD.PR.R PerpetualDiscount 2.69 % Now with a pre-tax bid-YTW of 6.83% based on a bid of 20.96 and a limitMaturity. Closing quote of 20.96-34, 2×2. Day’s range of 20.60-21.64.
GWO.PR.F PerpetualDiscount 2.72% Now with a pre-tax bid-YTW of 7.43% based on a bid of 20.05 and a limitMaturity. Closing quote of 20.05-50, 2×10. Day’s range of 20.00-20.00.
POW.PR.A PerpetualDiscount 2.79% Now with a pre-tax bid-YTW of 7.49% based on a bid of 18.81 and a limitMaturity. Closing quote of 18.80-19.90 (!), 5×1. Day’s range of 18.72-19.85.
POW.PR.C PerpetualDiscount 2.85% Now with a pre-tax bid-YTW of 7.22% based on a bid of 20.21 and a limitMaturity. Closing quote of 20.21-74, 3×2. Day’s range of 20.14-70.
CM.PR.P PerpetualDiscount 2.93 % Now with a pre-tax bid-YTW of 7.28% based on a bid of 18.95 and a limitMaturity. Closing quote of 18.95-00, 21×25. Day’s range of 18.50-24.
TD.PR.A FixedReset 2.94 %  
PWF.PR.I PerpetualDiscount 2.96 % Now with a pre-tax bid-YTW of 7.75% based on a bid of 19.82 and a limitMaturity. Closing quote of 19.82-21.40 (!), 3×2. Day’s range of 19.24-21.40 (!).
PWF.PR.F PerpetualDiscount 2.97 % Now with a pre-tax bid-YTW of 7.59% based on a bid of 17.71 and a limitMaturity. Closing quote of 17.71-19.99 (!!) 1×3. Day’s range of 17.70-20.00 (!).
BNA.PR.C SplitShare 2.97 % Asset coverage of 1.8+:1 based on BAM.A at 18.81 and 2.4 BAM.A per preferred. Now with a pre-tax bid-YTW of 19.06% based on a bid of 9.01 and a hardMaturity 2019-1-10. Closing quote of 9.01-94, 18×8. Day’s range of 9.00-20.
PWF.PR.A Floater 3.12 %  
RY.PR.A PerpetualDiscount 3.26 % Now with a pre-tax bid-YTW of 6.36% based on a bid of 17.76 and a limitMaturity. Closing quote of 17.76-00, 2×7. Day’s range of 17.39-00.
TRI.PR.B Floater 3.29 %  
BMO.PR.J PerpetualDiscount 3.30 % Now with a pre-tax bid-YTW of 6.89% based on a bid of 16.60 and a limitMaturity. Closing quote of 16.60-63, 2×5. Day’s range of 16.25-60.
TD.PR.Q PerpetualDiscount 3.40 % Now with a pre-tax bid-YTW of 6.71% based on a bid of 21.30 and a limitMaturity. Closing quote of 21.30-92, 2×9. Day’s range of 21.50-70.
RY.PR.E PerpetualDiscount 3.46 % Now with a pre-tax bid-YTW of 6.59% based on a bid of 17.36 and a limitMaturity. Closing quote of 17.36-54, 10.8. Day’s range of 16.99-46.
CIU.PR.A PerpetualDiscount 3.52% Now with a pre-tax bid-YTW of 7.81% based on a bid of 14.99 and a limitMaturity. Closing quote of 14.99-25, 3×1. Day’s range of 14.98-99.
BAM.PR.N PerpetualDiscount 3.65% Now with a pre-tax bid-YTW of 11.17% based on a bid of 10.79 and a limitMaturity. Closing quote of 10.79-15, 5×2. Day’s range of 10.49-15.
GWO.PR.G PerpetualDiscount 3.70% Now with a pre-tax bid-YTW of 6.98% based on a bid of 18.79 and a limitMaturity. Closing quote of 18.79-90, 1×6. Day’s range of 18.55-29.
POW.PR.D PerpetualDiscount 3.70% Now with a pre-tax bid-YTW of 7.36% based on a bid of 17.09 and a limitMaturity. Closing quote of 17.09-49, 4×18. Day’s range of 16.50-18.01.
BCE.PR.A FixedFloater 3.87 %  
BNS.PR.L PerpetualDiscount 4.04% Now with a pre-tax bid-YTW of 6.54% based on a bid of 17.26 and a limitMaturity. Closing quote of 17.26-64, 5×13. Day’s range of 17.24-25.
PWF.PR.L PerpetualDiscount 4.05% Now with a pre-tax bid-YTW of 7.59% based on a bid of 17.21 and a limitMaturity. Closing quote of 17.21-00, 5×10. Day’s range of 17.10-25.
RY.PR.G PerpetualDiscount 4.15 % Now with a pre-tax bid-YTW of 6.51% based on a bid of 17.56 and a limitMaturity. Closing quote of 17.56-70, 1×5. Day’s range of 16.90-70.
BNS.PR.K PerpetualDiscount 4.24% Now with a pre-tax bid-YTW of 6.63% based on a bid of 18.15 and a limitMaturity. Closing quote of 18.15-24, 5×9. Day’s range of 17.53-15.
FBS.PR.B SplitShare 4.25 % Asset coverage of 1.1+:1 as of December 31, according to TD Securities. Now with a pre-tax bid-YTW of 12.87% based on a bid of 8.10 and a hardMaturity 2011-12-15 at 10.00. Closing quote of 8.10-49, 50×20. Day’s range of 7.61-10.
NA.PR.K PerpetualDiscount 4.29 % Now with a pre-tax bid-YTW of 7.59% based on a bid of 19.67 and a limitMaturity. Closing quote of 19.67-39, 2×2. Day’s range of 19.95-39.
PWF.PR.K PerpetualDiscount 4.36% Now with a pre-tax bid-YTW of 7.45% based on a bid of 17.01 and a limitMaturity. Closing quote of 17.01-25, 5×9. Day’s range of 16.83-50.
BAM.PR.M PerpetualDiscount 4.41% Now with a pre-tax bid-YTW of 11.32% based on a bid of 10.65 and a limitMaturity. Closing quote of 10.65-98, 1×3. Day’s range of 10.40-98.
BCE.PR.Z FixedFloater 4.45 %  
TD.PR.O PerpetualDiscount 4.45% Now with a pre-tax bid-YTW of 6.60% based on a bid of 18.76 and a limitMaturity. Closing quote of 18.76-10, 3×7. Day’s range of 17.85-19.14.
BMO.PR.L PerpetualDiscount 4.49% Now with a pre-tax bid-YTW of 7.20% based on a bid of 20.50 and a limitMaturity. Closing quote of 20.50-00, 5×20. Day’s range of 20.75-19.
PWF.PR.G PerpetualDiscount 4.79% Now with a pre-tax bid-YTW of 7.58% based on a bid of 19.91 and a limitMaturity. Closing quote of 19.91-21.99 (!!) 1×5. Day’s range of 19.40-00.
SLF.PR.B PerpetualDiscount 4.87 % Now with a pre-tax bid-YTW of 7.21% based on a bid of 16.81 and a limitMaturity. Closing quote of 16.81-19, 3×10. Day’s range of 16.45-20.
SLF.PR.E PerpetualDiscount 4.87 % Now with a pre-tax bid-YTW of 7.13% based on a bid of 15.92 and a limitMaturity. Closing quote of 15.92-15, 12×17. Day’s range of 16.15-38.
PWF.PR.E PerpetualDiscount 5.11% Now with a pre-tax bid-YTW of 7.61% based on a bid of 18.50 and a limitMaturity. Closing quote of 18.50-00, 5×10. Day’s range of 17.99-50.
NA.PR.L PerpetualDiscount 5.20 % Now with a pre-tax bid-YTW of 7.55% based on a bid of 16.39 and a limitMaturity. Closing quote of 16.39-83, 3×23. Day’s range of 16.21-80.
BCE.PR.G FixedFloater 5.36 %  
MFC.PR.B PerpetualDisco

unt

5.57% Now with a pre-tax bid-YTW of 6.32% based on a bid of 18.59 and a limitMaturity. Closing quote of 18.59-89, 2×1. Day’s range of 17.84-18.89.
BCE.PR.R FixedFloater 5.76 %  
FIG.PR.A InterestBearing 6.12% Asset coverage of 1.1+:1 as of December 31, based on Capital Unit Value of 1.75 and 0.71 Capital Units per preferred. Now with a pre-tax bid-YTW of 13.56% based on a bid of 7.11 and a hardMaturity 2014-12-31 at 10.00. Closing quote of 7.11-49, 3×3. Day’s range of 7.34-35.
BCE.PR.Y Ratchet 6.13 %  
TD.PR.P PerpetualDiscount 6.33% Now with a pre-tax bid-YTW of 6.38% based on a bid of 21.00 and a limitMaturity. Closing quote of 21.00-20, 8×40. Day’s range of 20.35-21.49.
GWO.PR.H PerpetualDiscount 6.34% Now with a pre-tax bid-YTW of 7.38% based on a bid of 16.60 and a limitMaturity. Closing quote of 16.60-93, 5×10. Day’s range of 16.30-95.
PWF.PR.H PerpetualDiscount 6.50 % Now with a pre-tax bid-YTW of 7.55% based on a bid of 19.50 and a limitMaturity. Closing quote of 19.50-20, 1×15. Day’s range of 18.99-50.
NA.PR.M PerpetualDiscount 6.78 % Now with a pre-tax bid-YTW of 7.20% based on a bid of 21.25 and a limitMaturity. Closing quote of 21.25-40, 40×7. Day’s range of 20.45-21.75.
BCE.PR.C FixedFloater 7.25 %  
BAM.PR.B Floater 8.21 %  
BAM.PR.J OpRet 8.52 % Now with a pre-tax bid-YTW of 11.76% based on a bid of 16.30 and a softMaturity 2018-3-30 at 25.00. Closing quote of 16.30-88, 5×18. Day’s range of 15.80-16.88.
POW.PR.B PerpetualDiscount 8.81% Now with a pre-tax bid-YTW of 7.27% based on a bid of 18.52 and a limitMaturity. Closing quote of 18.52-15, 2×3. Day’s range of 17.49-18.96.
BCE.PR.I FixedFloater 8.96 %  
BCE.PR.S Ratchet 10.56 %  
Issue Index Shares
Traded
Notes
CM.PR.P PerpetualDiscount 24,520 Now with a pre-tax bid-YTW of 7.28% based on a bid of 18.95 and a limitMaturity.
POW.PR.D PerpetualDiscount 22,200 Now with a pre-tax bid-YTW of 7.36% based on a bid of 17.09 and a limitMaturity.
CM.PR.H PerpetualDiscount 20,100 Now with a pre-tax bid-YTW of 7.23% based on a bid of 16.66 and a limitMaturity.
BMO.PR.J PerpetualDiscount 18,575 Now with a pre-tax bid-YTW of 6.89% based on a bid of 16.60 and a limitMaturity.
RY.PR.G PerpetualDiscount 17,940 Now with a pre-tax bid-YTW of 6.51% based on a bid of 17.56 and a limitMaturity.

There were twelve other index-included $25-p.v.-equivalent issues trading over 10,000 shares today.

HIMI Preferred Indices

HIMIPref™ Preferred Indices: December 2008

HIMI Index Values 2008-12-31
These values reflect the December 2008 Revision
Index Closing Value (Total Return) Issues Mean Credit Quality Median YTW Median DTW Median Daily Trading Mean Current Yield
Ratchet 795.7 2 2.00 8.48% 12.5 32M 7.79%
FixedFloater 1,252.0 8 2.00 8.11% 12.5 83M 8.17%
Floater 986.6 4 1.72 5.78% 14.2 34M 6.18%
OpRet 1,967.9 15 1.35 4.69% 3.9 129M 5.44%
SplitShare 1,758.9 15 2.00 10.00% 4.18 79M 6.32%
Interest-Bearing 1,836.1 2 2.00 14.76% 0.9 51M 7.70%
Perpetual-Premium 1,467.5 0 N/A N/A N/A N/A N/A
Perpetual-Discount 1,351.5 71 1.23 7.29% 12.2 243M 7.27%
FixedReset 1,793.3 18 1.06 4.81% 15.1 801M 5.92%

For Index Revisions during December 2008, see the post HIMIPref™ Index Rebalancing: December 2008.

Publication of index details is embargoed for six months following index date.

Reader Initiated Comments

Can Perpetuals Trade Perpetually?

I have recently been asked:

At what point will a company redeem its preferred shares, if the yield is high enough at some point the amount of interest they have paid out will be greater than the amount of capital generated from the sale of the preferred share. Is there a point where a preferred share just ceases to be traded, or does a company have to redeem them? My question is basically a pref can’t trade forever so how do you know when it will stop trading? I am assuming it may go on past the redemption date since the information you have provided says usually after 5-10 years.

… to which I respond:

It is true that at some point the amount the total amount of interest/dividend exceeds the original capital invested, but this is true of long term bonds as well. At five percent, money doubles in 15 years … so for a 5% 30-year bond, only one-quarter of the original value is represented by return of capital – three quarters of the value is the income stream. UK Perpetuals issued during the Great War are still trading.

As long as the company can invest the capital to achieve a rate of return higher than their payments, it’s a good deal for them.

There is no reason why a perpetual can’t trade forever. It will be called only when it makes sense for the company – which could be due to cheaper refinancing, simplification of the capital structure, take-over, bankruptcy, any number of things. Most perpetuals issued in the 90’s have been called, but only because refinancing was cheap.

Index Construction / Reporting

HIMIPref™ Index Rebalancing: December 2008

HIMI Index Changes, December 31, 2008
Issue From To Because
BSD.PR.A InterestBearing Scraps Credit
PWF.PR.A Scraps Floater Volume
ACO.PR.A Scraps OpRet Volume
BCE.PR.S Scraps Ratchet Volume
BAM.PR.G Scraps FixFloat Volume
TRI.PR.B Scraps Floater Volume

There were the following intra-month changes:

HIMI Index Changes during December 2008
Issue Action Index Because
RY.PR.N Add FixedReset New Issue
BMO.PR.N Add FixedReset New Issue
BNS.PR.S Add FixedReset New Issue
Issue Comments

Best & Worst Performers: December 2008

These are total returns, with dividends presumed to have been reinvested at the bid price on the ex-date. The list has been restricted to issues in the HIMIPref™ indices.

December, 2008
Issue Index DBRS Rating Monthly Performance Notes (“Now” means “December 31”)
BCE.PR.Z FixFloat Pfd-2(low) -23.35%  
BCE.PR.Y Ratchet Pfd-2(low) -22.73%  
BCE.PR.S FixFloat Pfd-2(low) -20.97%  
BCE.PR.R FixFloat Pfd-2(low) -19.35%  
BCE.PR.I FixFloat Pfd-2(low) -18.83%  
BNA.PR.B SplitShare Pfd-2(low) +31.21% Asset coverage of 1.8-:1 as of December 31 based on BAM.A at 18.55 and 2.4 BAM.A per preferred. Now with a pre-tax bid-YTW of 8.87% based on a bid of 20.01 and a hardMaturity 2016-3-25 at 25.00. Presumably helped out a lot by very favourable monthly retraction terms – estimated retraction price is now $21.77 based on an NAV of 44.52.
FTN.PR.A SplitShare Pfd-2(low)
Review Negative
+31.27% Asset coverage of 1.4-:1 as of December 15 according to the company, with an estimated NAV of 13.75 based on the change in XFN since then. Now with a pre-tax bid-YTW of 8.94% based on a bid of 8.16 and a hardMaturity 2015-12-1. Estimated retraction price of $8.70 with capital units offered at $4.50.
BAM.PR.K Floater Pfd-2(low) +34.66% Was the worst performer in November, with a return of -35.06%.
FFN.PR.A SplitShare Pfd-2(low)
Review Negative
+35.09% Was the fifth-worst performer in November, with a return of -25.48%. Asset coverage of 1.1+:1 as of December 15 according to the company; NAV now estimated as 11.63 based on change in XFN since then. Now with a pre-tax bid-YTW of 11.07% based on a bid of 7.56 and a hardMaturity 2014-12-1 at 10.00. Estimated retraction price of $8.19 with capital units offered at $2.97.
BAM.PR.B Floater Pfd-2(low) +37.05% Was the second-worst performer in November, with a return of -30.81%.

The December rankings are not as mysterious as the November rankings … three of the best performers are merely bouncing back from horrible performance last month, while the five worst performers are all BCE issues … reacting as one might expect to the death of the Teachers’ deal.

It is interesting to note that the BPP floaters – issued by BPO Properties, which never fails to irritate me – had a horrible month. Two of the three would have made the list had they been included in the indices (they are excluded on credit concerns) … and they are now trading roughly kinda call it even yield with the BAM floaters, ending (for now) the long-standing credit inversion. To continue the graphs given in that post:

Was somebody saying something about efficient markets?