Sometimes you just can’t win:
Vladimir Putin is facing a problem few could have anticipated: The ruble is becoming too strong.
Last year’s worst-performing major currency is this year’s best and while that’s buoying the nation’s bonds, driving yields to the lowest in four months, it’s also crimping Russia’s export revenue. Even though oil is little changed in dollars this year, the price when converted to rubles has plunged to the lowest since 2011.
The currency rout in 2014 helped Russia to keep its budget deficit within 1 percent of gross domestic product as the ruble weakened in lockstep with a 50 percent slump in oil. Now, with the cease-fire in Ukraine and the allure of higher-yielding assets attracting investors to ruble debt, the government is seeing the opposite effect.
“The current ruble level is already uncomfortable for the budget considering the oil price in rubles is already low,” Vladimir Bragin, head of research at Alfa Capital in Moscow, said by phone on Thursday. “In order to reach macroeconomic stability, Russia needs to limit its budget deficit and a weaker ruble is an easy way to do that.”
It looks like there will be another triumph for regulatory extortion:
Deutsche Bank AG is close to resolving a multi-year probe by U.S. and U.K. authorities into interest-rate manipulation, with a U.K. subsidiary expected to plead guilty, according to two people familiar with the matter.
Germany’s biggest bank will probably finalize a settlement this month, these people said. The unit expected to plead is Deutsche Bank Group Services, one of the people said.
The bank is also expected to pay penalties of more than $1.5 billion to wrap up probes by the U.S. Justice Department, the Commodity Futures Trading Commission, New York’s Department of Financial Services and the U.K.’s Financial Conduct Authority, according to one of the people. The penalty could be larger than those levied against other global banks for interest-rate rigging claims.
…
In October, the bank said it was in discussions with some authorities about a resolution. The German lender previously was fined 725 million euros ($773 million) by the European Union for manipulating yen Libor and the euro interbank offered rate.
…
Deutsche Bank set aside 3.6 billion euros in legal and operational risk provisions at the end of December. The bank doesn’t provide details on the reserves. Over the last three years, the bank’s litigation expenses totaled about 7.1 billion euros.
As an aside, I confess to being fascinated and horrified by the Valentina Lisitsa / Toronto Symphony Orchestra scandal. In the first place, I agree with Vinay Menon of the Toronto Star:
The TSO sacrificed its own artistic integrity. It was remarkably tone deaf. It set a dangerous precedent and, in doing so, made a mockery of the arts in this city. Canceling these concerts was about as absurd and unwarranted as that time mayor June Rowlands banned the Barenaked Ladies because the band’s name objectified women.
More to the point though is the TSO’s Jeff Melanson’s delusions of grandeur. If – as many fervently believe – she has crossed the line into hate speech … we have laws for that. Publicly available laws, with case law constructed from the precedents. We have a judicial system that will – publicly – make a finding based on the (publicly disclosed) facts of the case; we can attend the trial if we wish to, to verify that the decision is on the up-and-up. We have a police force that will perform any necessary investigation and many crown attorneys who will make a decision as to whether to proceed with charges on the basis of that investigation. We have a judicial system that will – publicly – make a finding based on the (publicly disclosed) facts of the case; we can attend the trial if we wish to, to verify that the decision is on the up-and-up. We do not need Jeff Melanson of the TSO to pin on his Junior Secret Policeman badge and indulge in a little career-wrecking in the apparent belief that artists are supposed to be nice people.
These vitriolic moral crusades harm the body politic more than anything Ms. Lisitsa has said and the promotion of two-bit bureaucrats to Official Moral Arbiters is even worse, as discussed on January 6, 2015 with respect to the Dalhousie dentists.
Update: This is delicious in light of the Valentina Lisitsa scandal with the TSO … at the height of the furor regarding the presence of Queers Against Israeli Apartheid in Toronto’s Gay Pride parade, a few institutions made a joint statement in support of the group:
As public institutions dedicated to artistic expression, we consider freedom of expression to be an essential element of our mandate.
… (signed) Andrew Shaw, Toronto Symphony Orchestra
Delicious.
Inspired by Easter, investors in Canadian preferred shares have participated in other religious ceremonies in the past week:

Click for Big
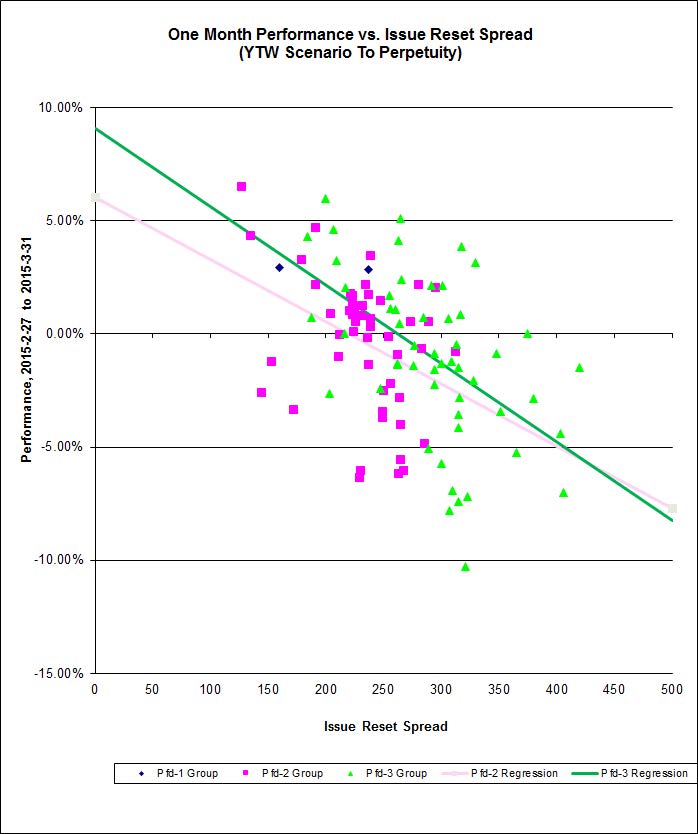
It was a mixed day for the Canadian preferred share market, with PerpetualDiscounts up 5bp, FixedResets off 51bp and DeemedRetractibles gaining 3bp. The Performance Highlights table is predictably enormous, dominated by low-spread FixedReset losers. Volume was extremely high.
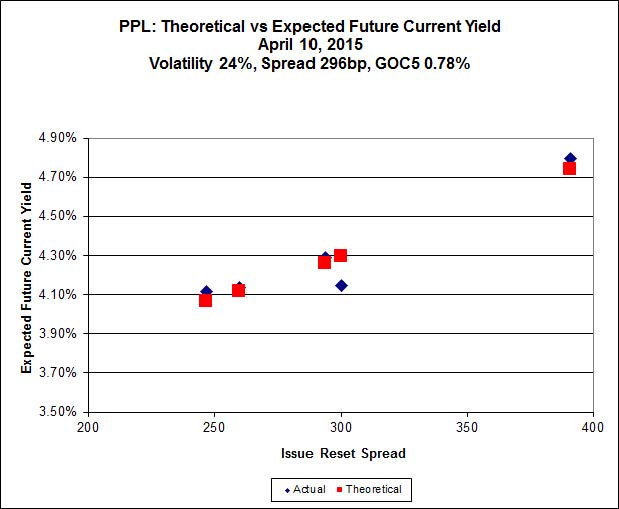
For as long as the FixedReset market is so violently unsettled, I’ll keep publishing updates of the more interesting and meaningful series of FixedResets’ Implied Volatilities. This doesn’t include Enbridge because although Enbridge has a large number of issues outstanding, all of which are quite liquid, the range of Issue Reset Spreads is too small for decent conclusions. The low is 212bp (ENB.PR.H; second-lowest is ENB.PR.D at 237bp) and the high is a mere 268 for ENB.PF.G.
Remember that all rich /cheap assessments are:
» based on Implied Volatility Theory only
» are relative only to other FixedResets from the same issuer
» assume constant GOC-5 yield
» assume constant Implied Volatility
» assume constant spread
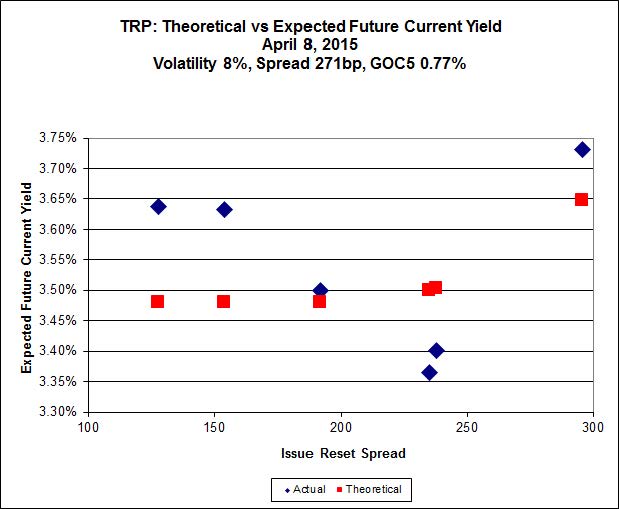
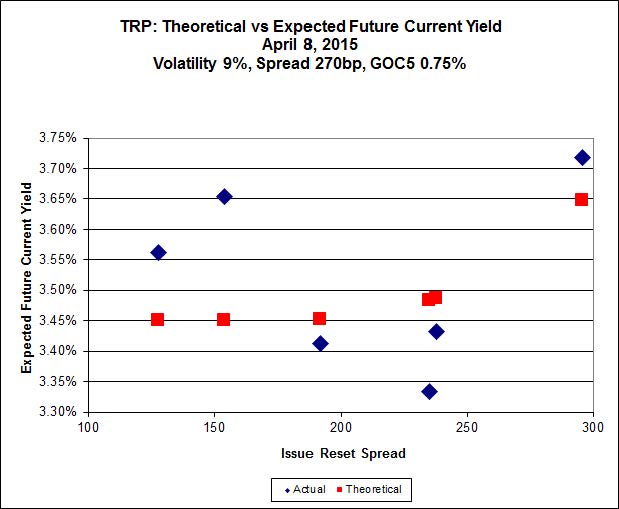
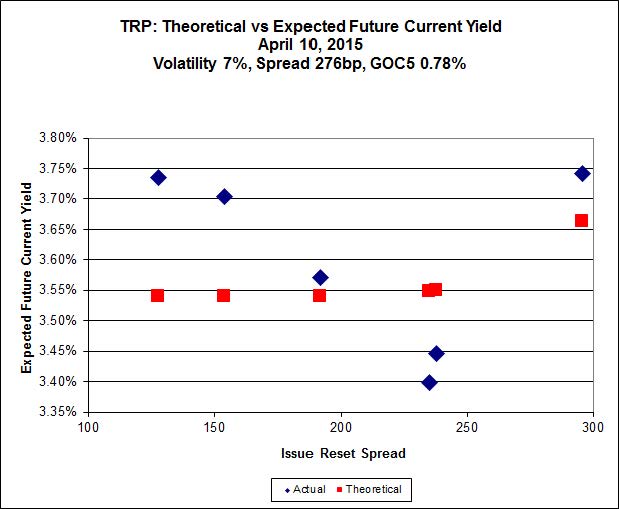
Here’s TRP:
Click for Big
TRP.PR.E, which resets 2019-10-30 at +235, is bid at 23.02 to be $0.96 rich, while TRP.PR.B, resetting 2015-6-30 at +128, is $0.76 cheap at its bid price of 13.79.

Click for Big
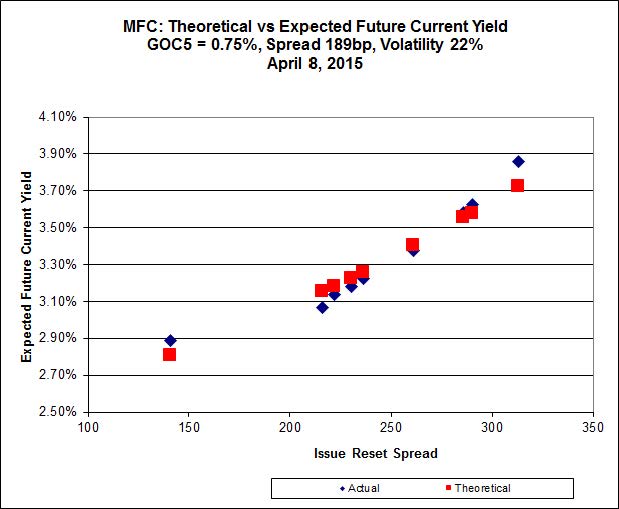
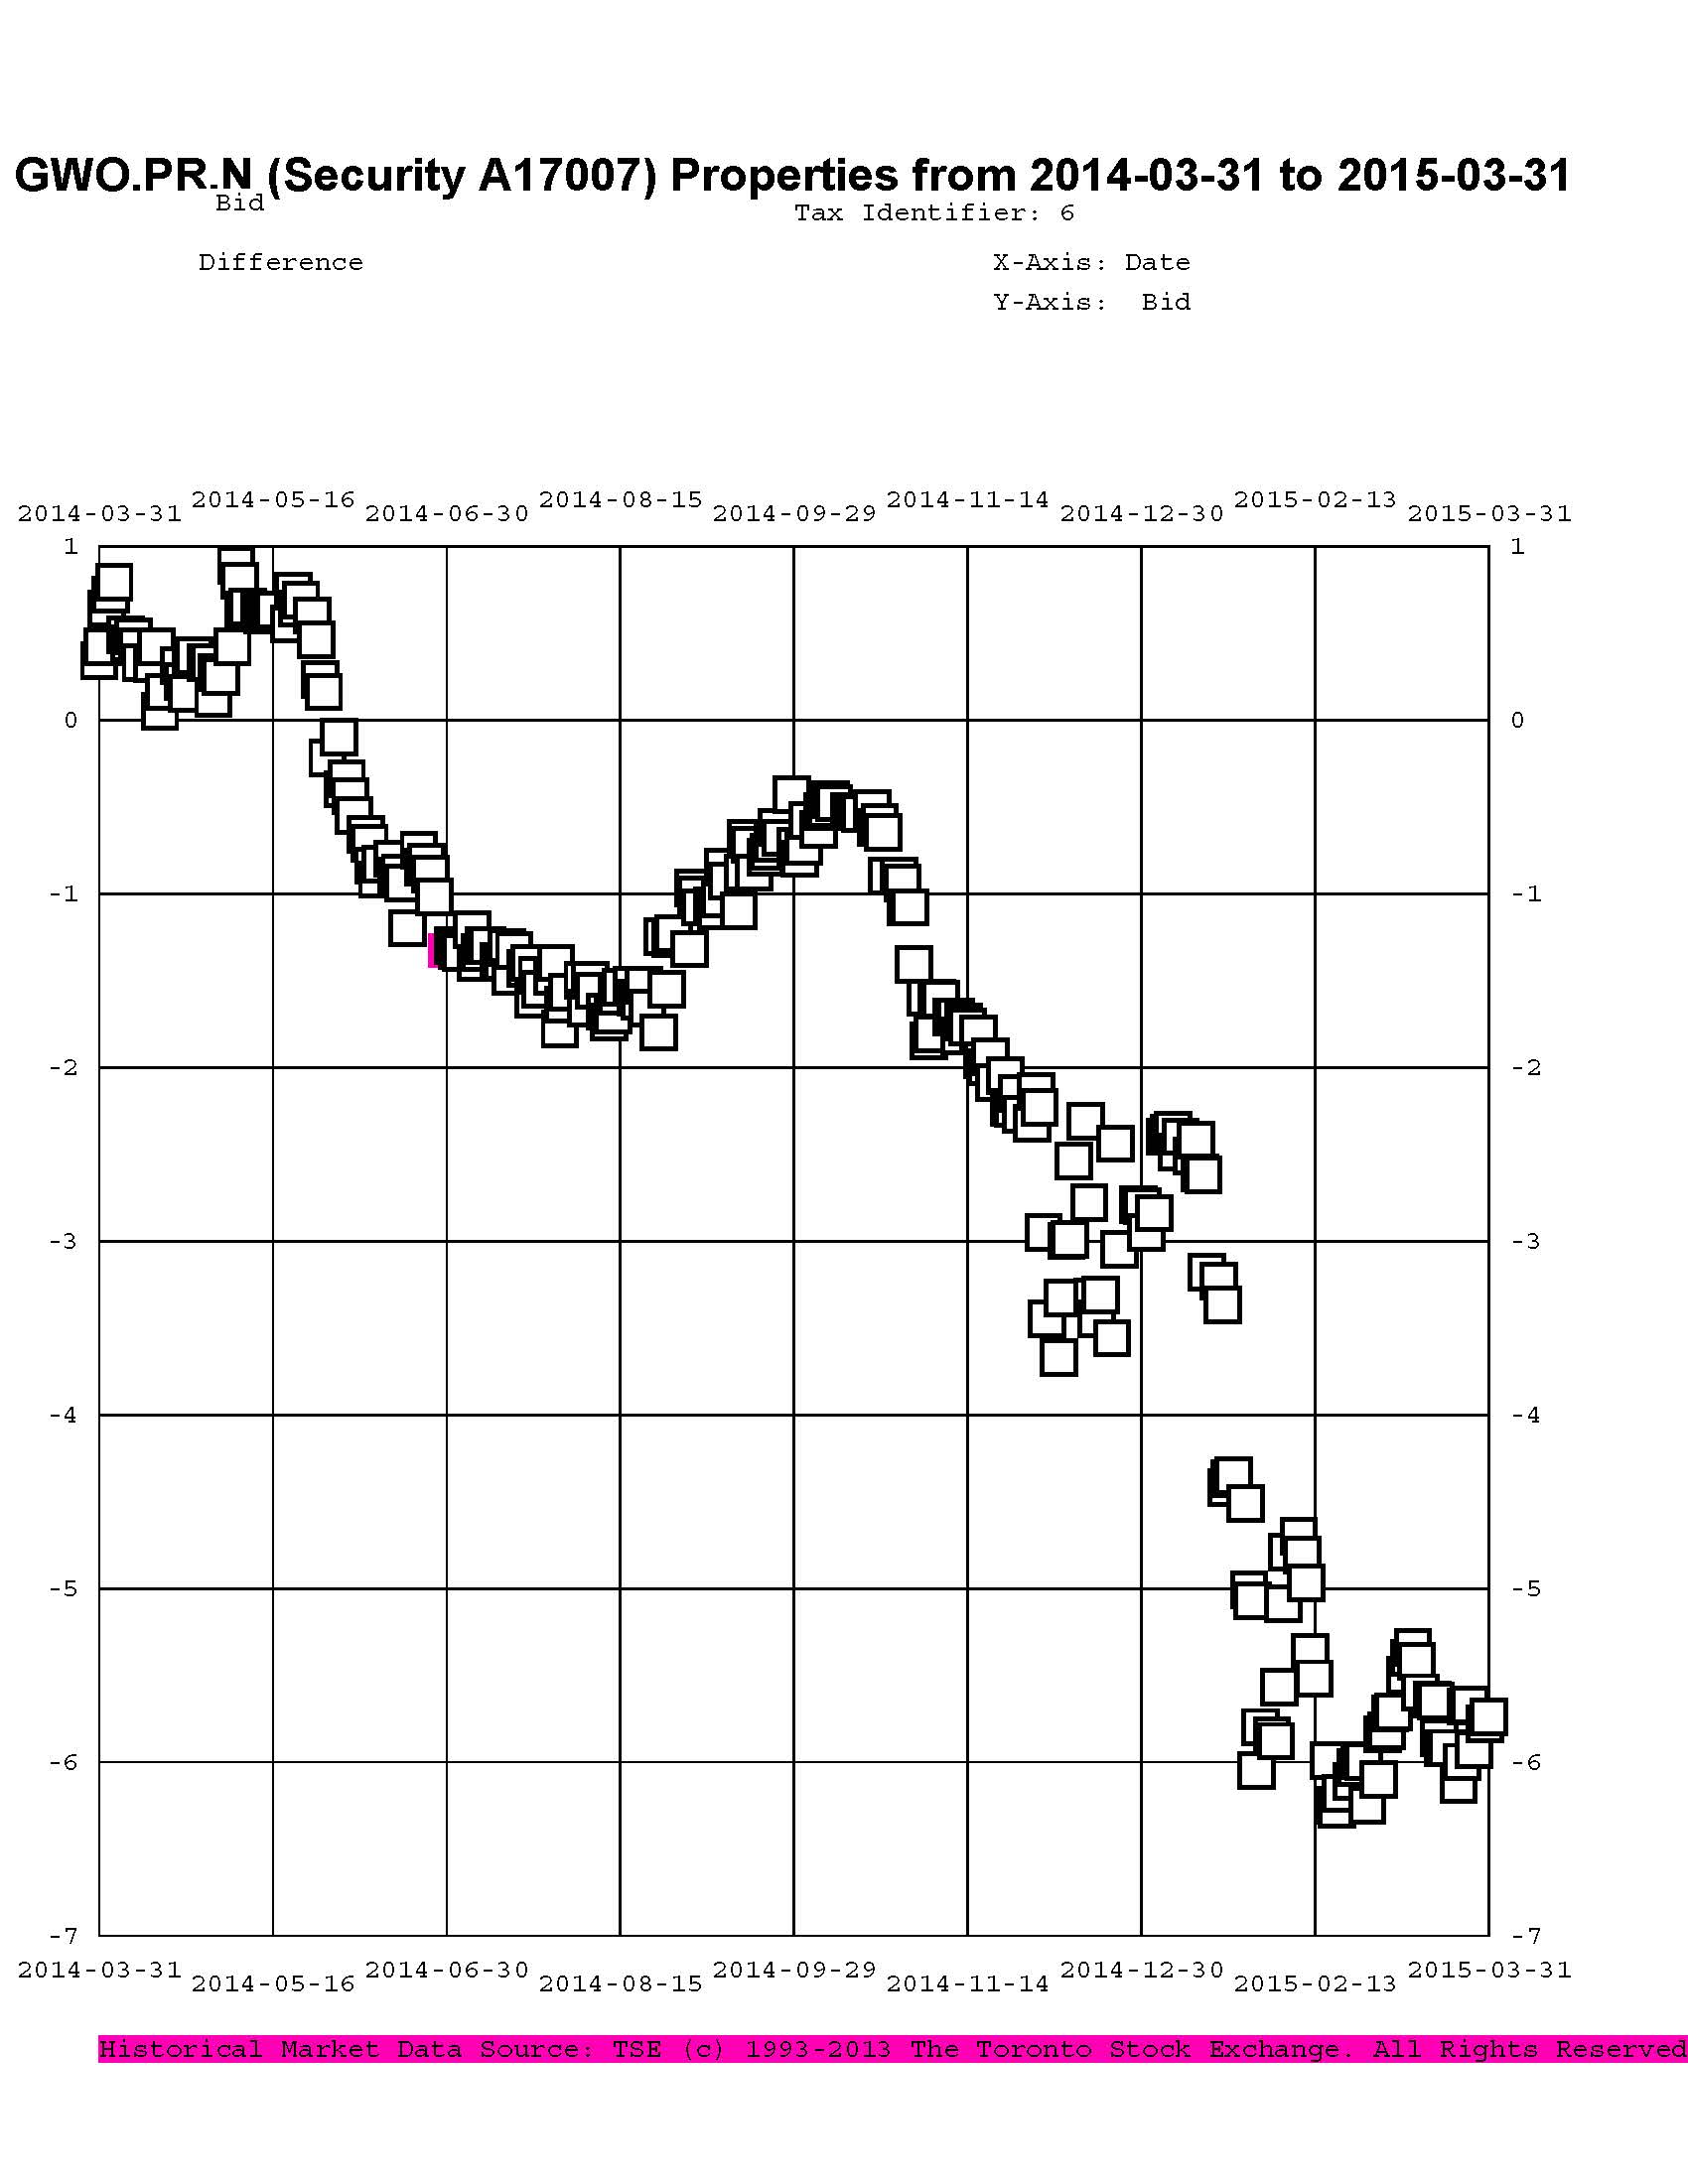
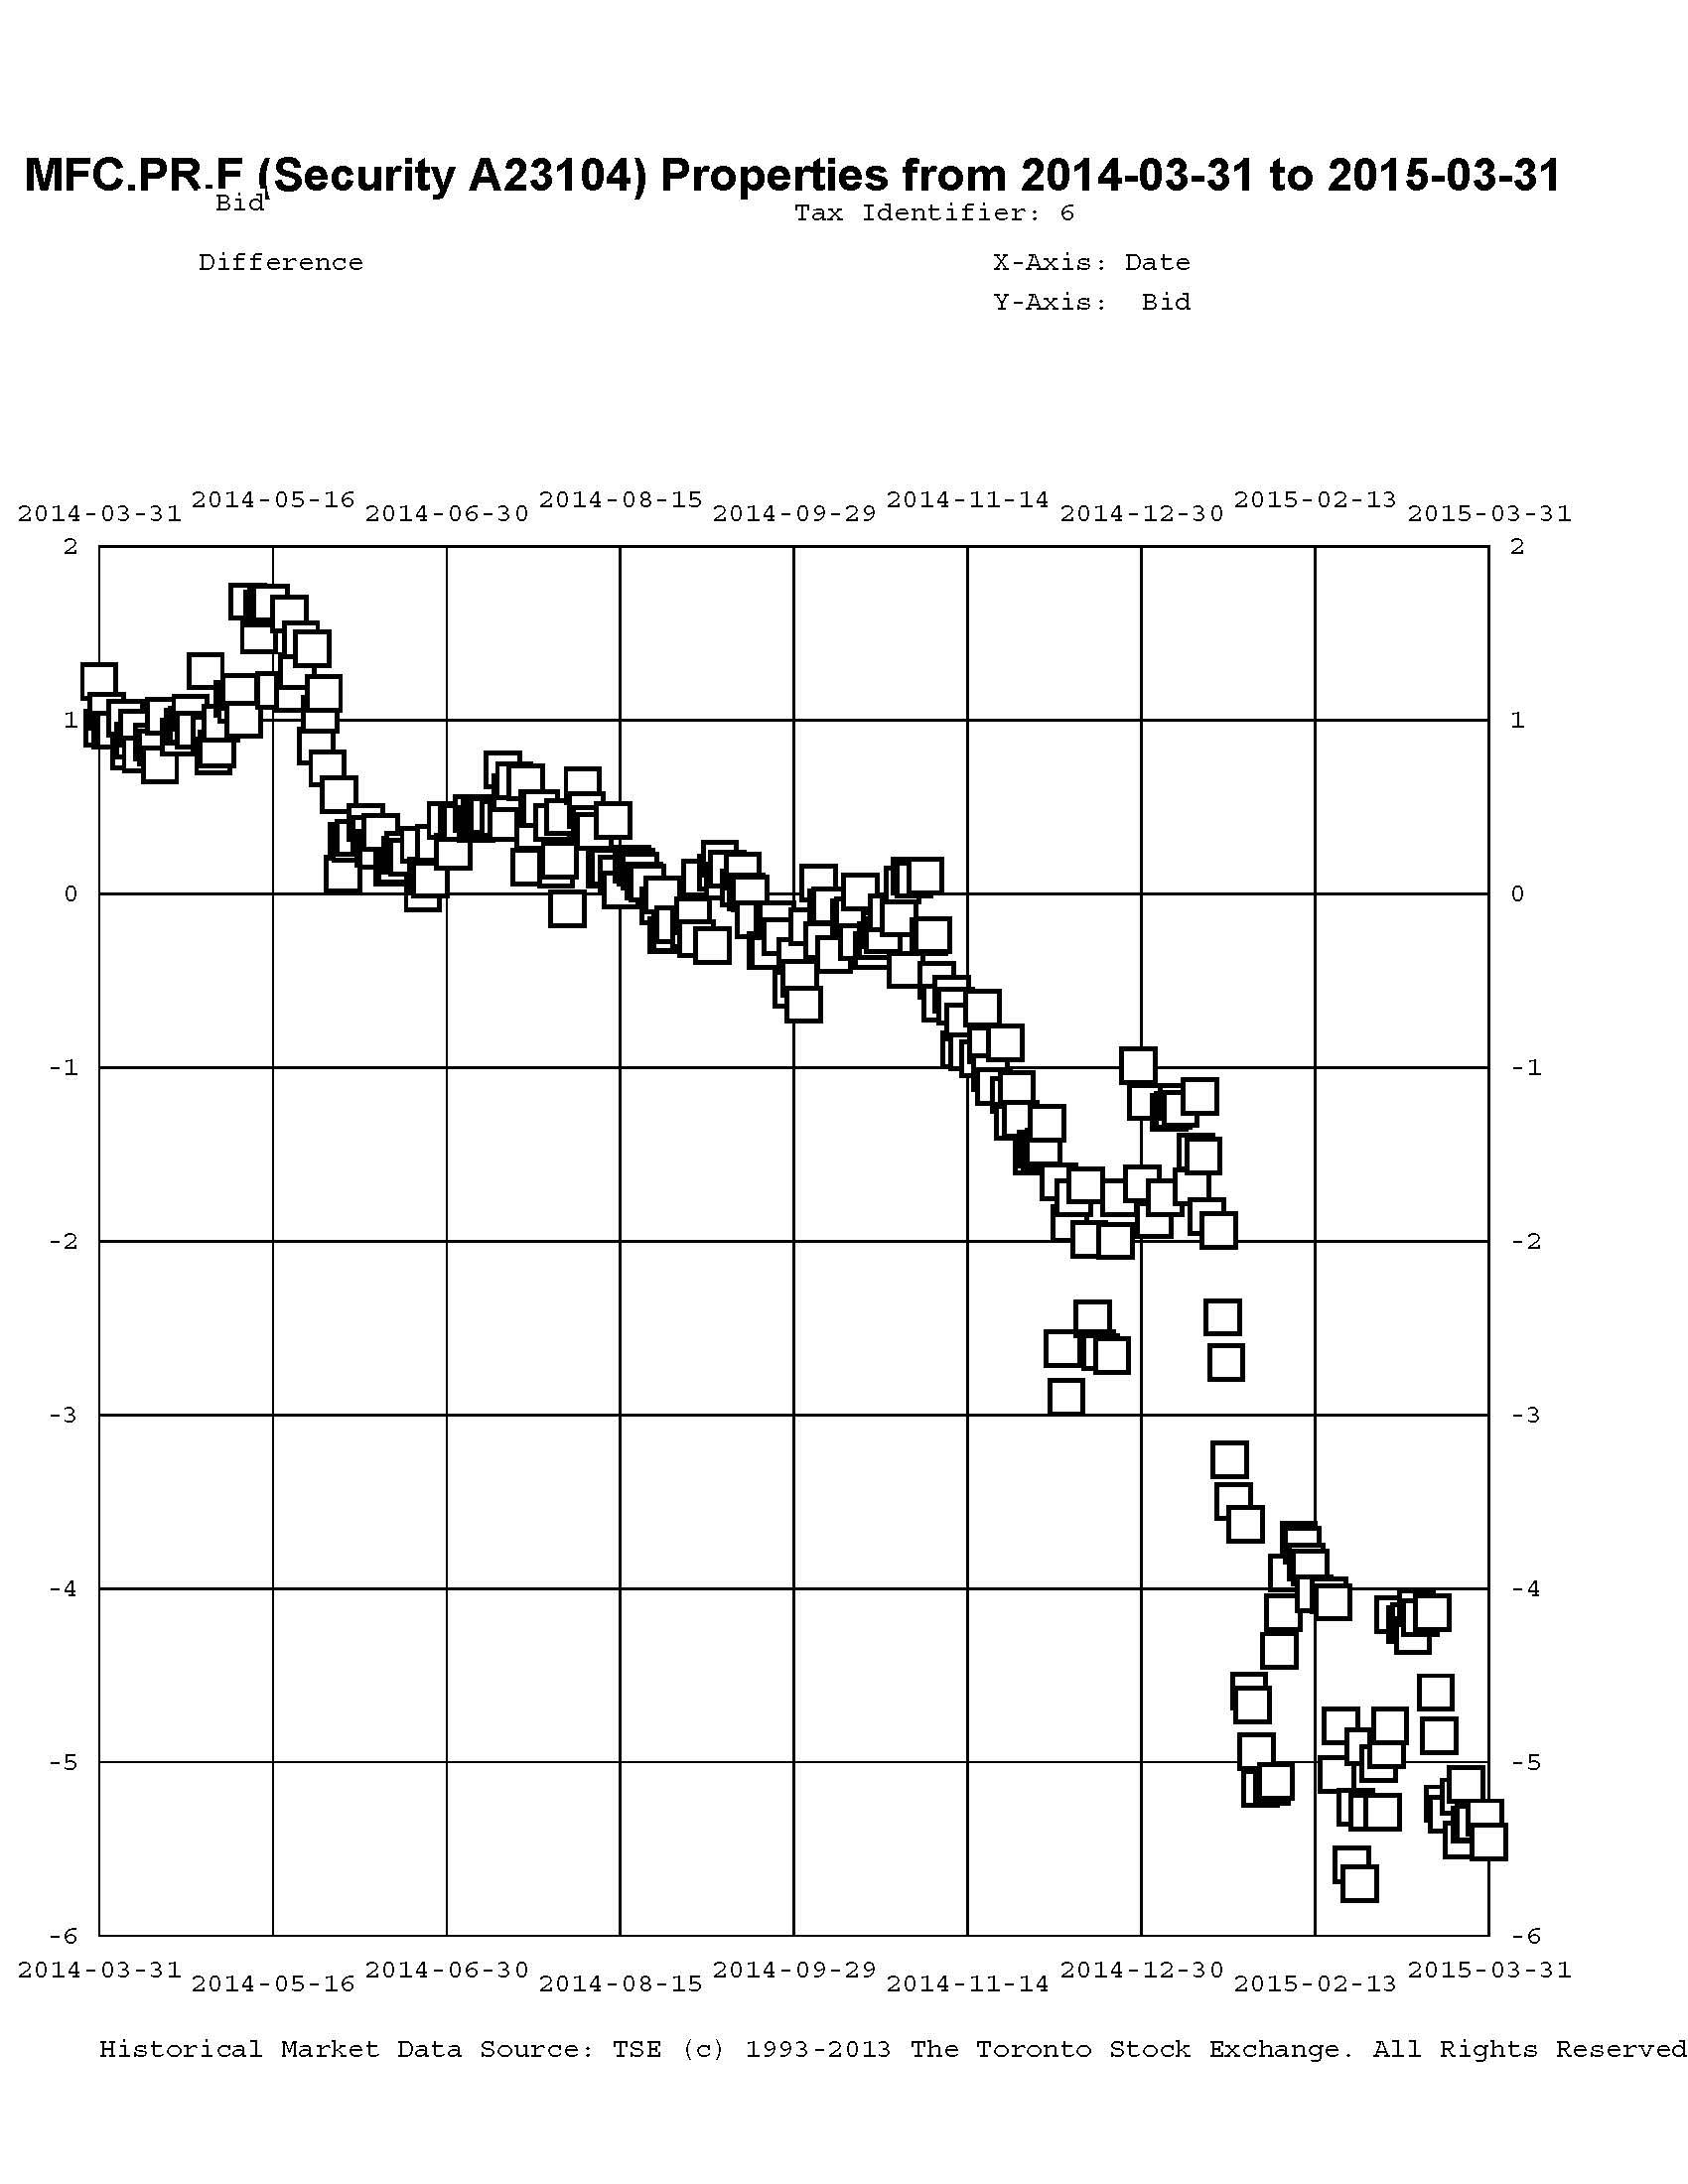
Another excellent fit, but the numbers are perplexing. Implied Volatility for MFC continues to be a conundrum, although it declined substantially today. It is still too high if we consider that NVCC rules will never apply to these issues; it is still too low if we consider them to be NVCC non-compliant issues (and therefore with Deemed Maturities in the call schedule).
Most expensive is MFC.PR.L, resetting at +216 on 2019-6-19, bid at 23.45 to be $0.60 rich, while MFC.PR.H, resetting at +313bp on 2017-3-19, is bid at 25.16 to be $0.91 cheap. The lowest spread issue, MFC.PR.F, is noticeably off the curve defined by its peers.
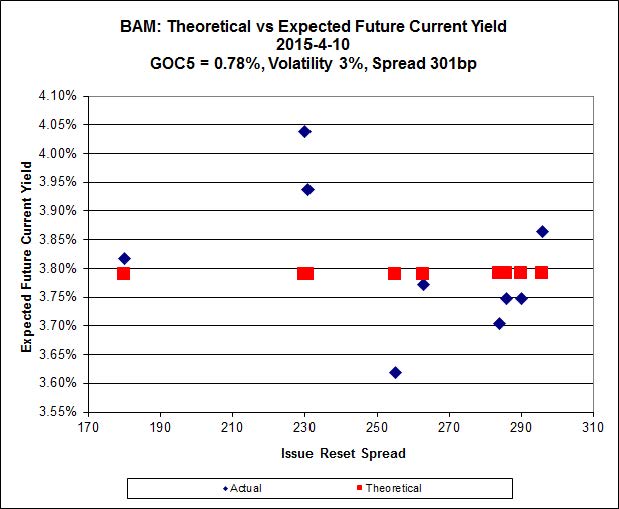
Click for Big
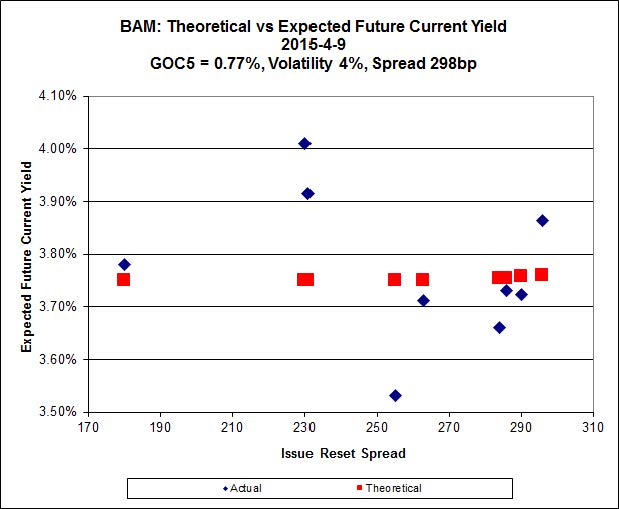
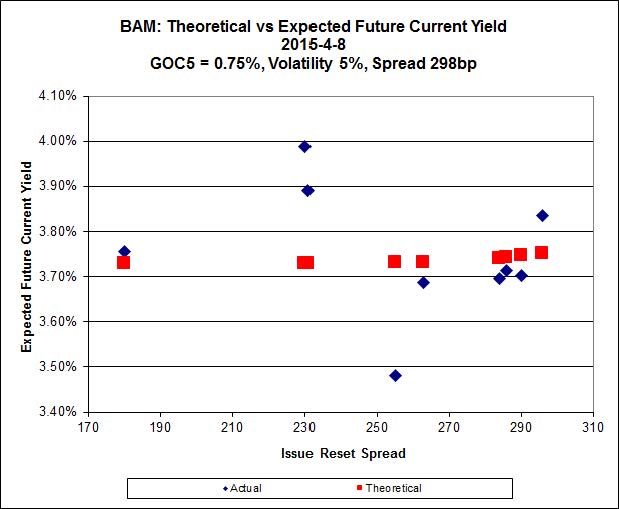
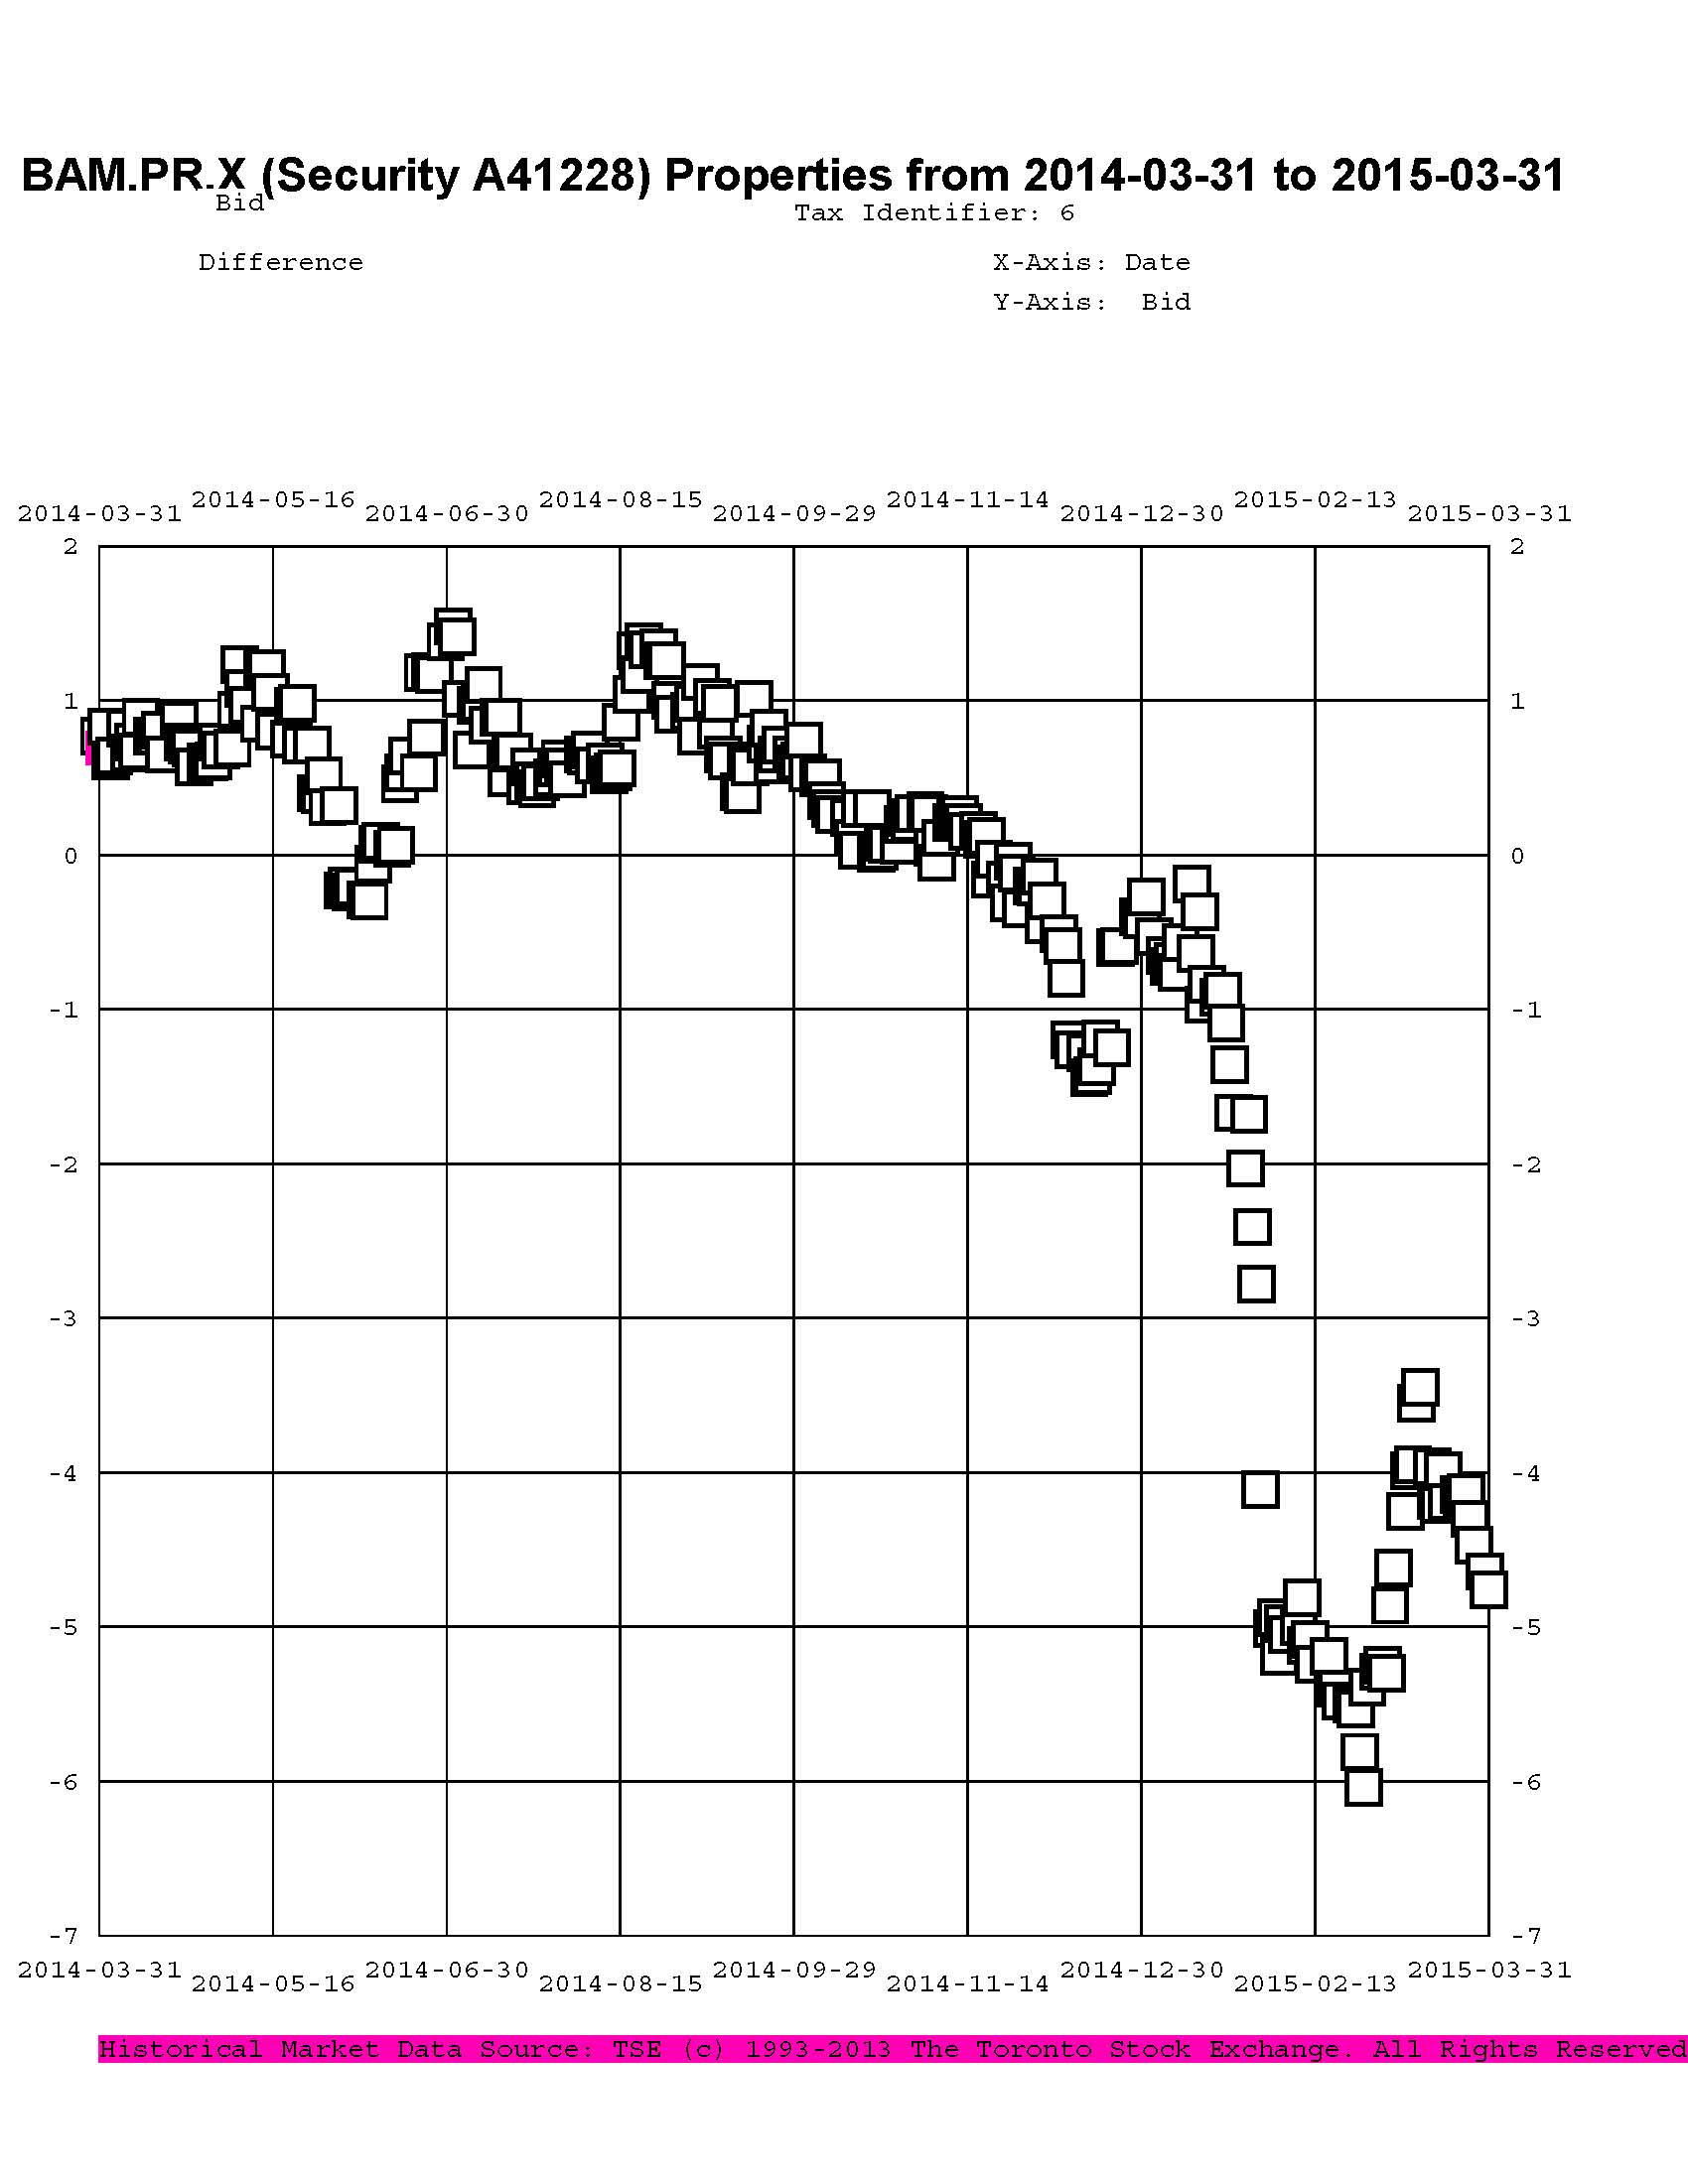
The cheapest issue relative to its peers is BAM.PR.R, resetting at +230bp on 2016-6-30, bid at 19.07 to be $1.26 cheap. BAM.PF.E, resetting at +255bp 2020-3-31 is bid at 23.30 and appears to be $1.03 rich.
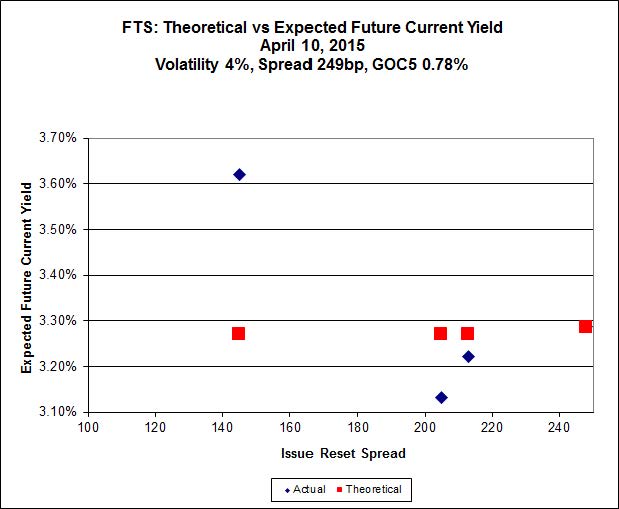
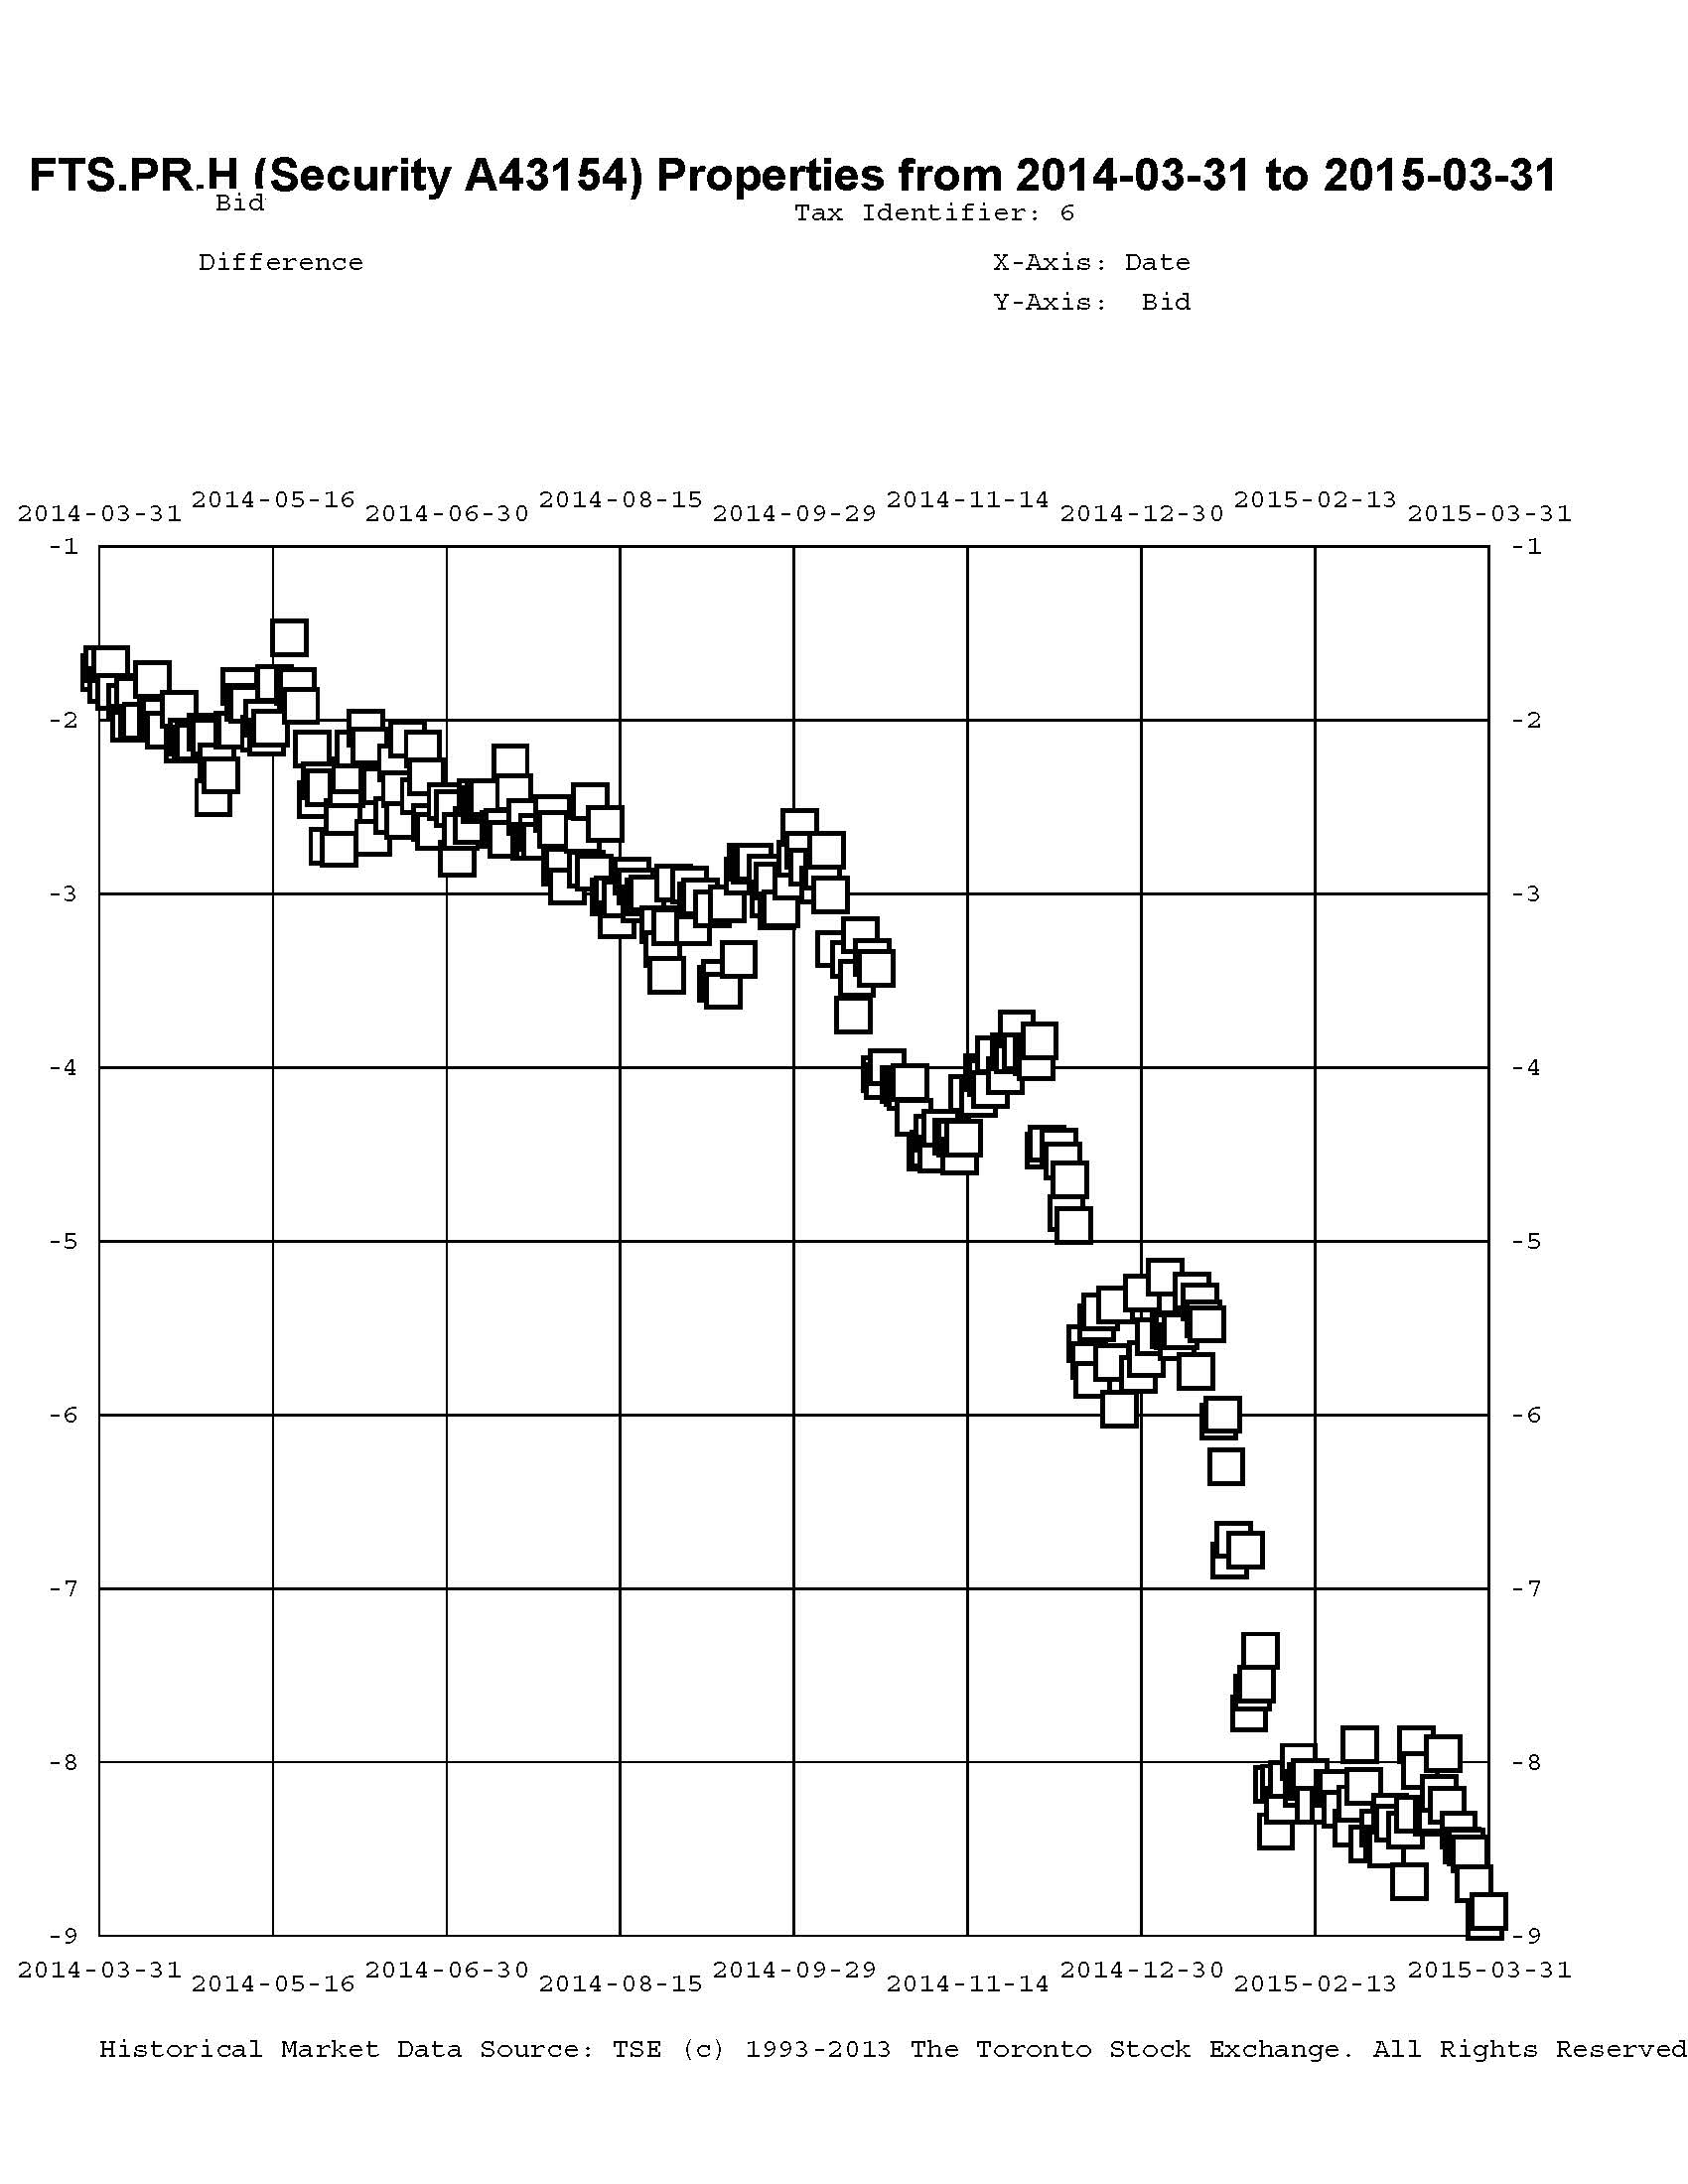
Click for Big
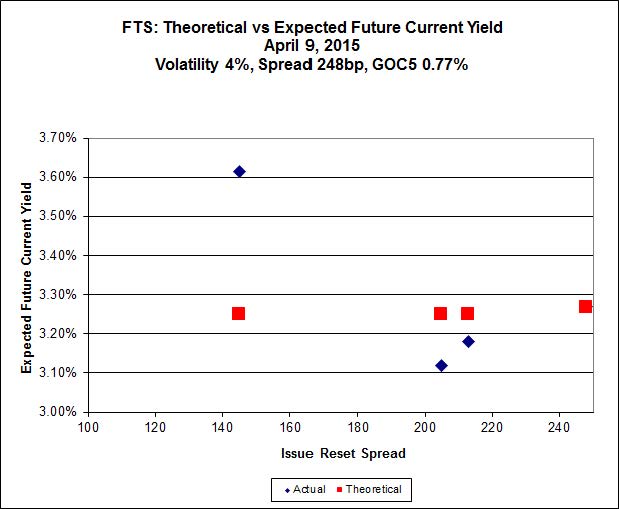
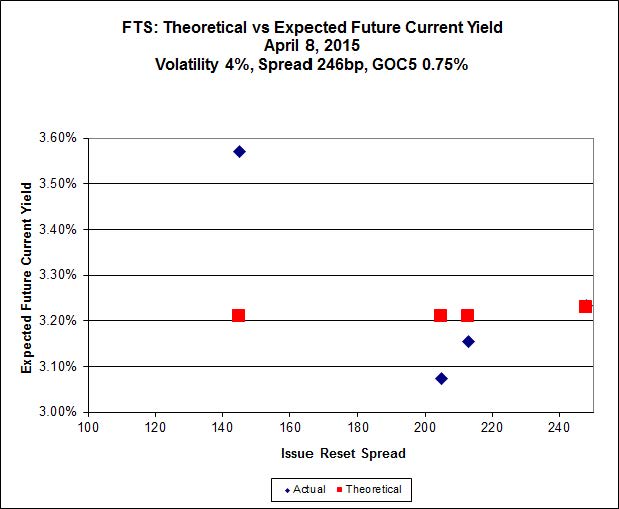
This is just weird because the middle is expensive and the ends are cheap but anyway … FTS.PR.H, with a spread of +145bp, and bid at 15.40, looks $1.65 cheap and resets 2015-6-1. FTS.PR.K, with a spread of +205bp and resetting 2019-3-1, is bid at 22.59 and is $0.95 rich.

Click for Big
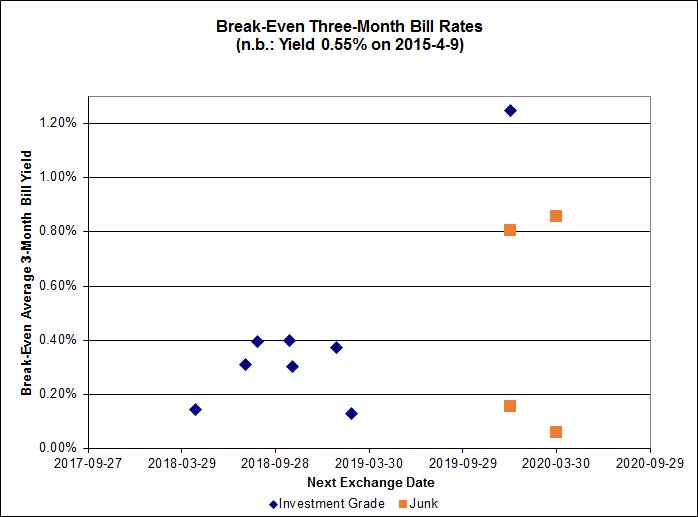
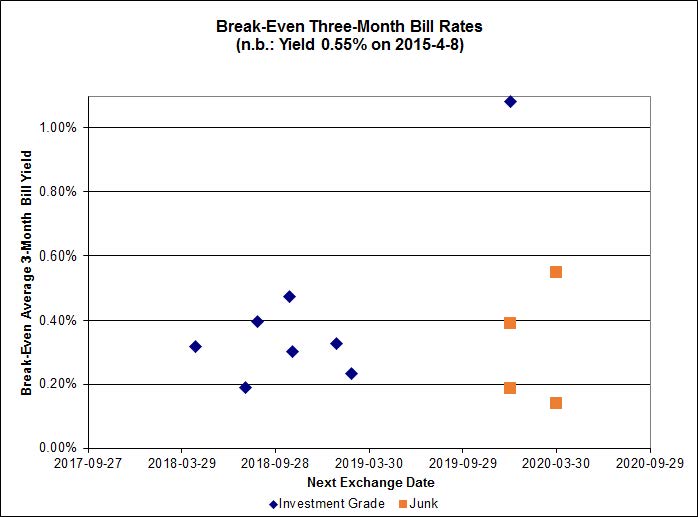
Investment-grade pairs other than TRP.PR.A / TRP.PR.F now predict an average over the next five years of about 0.25%, a slight decrease from yesterday’s value of 0.30%. TRP.PR.A / TRP.PR.F remains an outlier, predicting 1.46%. The DC.PR.B / DC.PR.D pair is still off the charts and now predicts an average bill rate over the next 4 3/4 years of -2.05%.
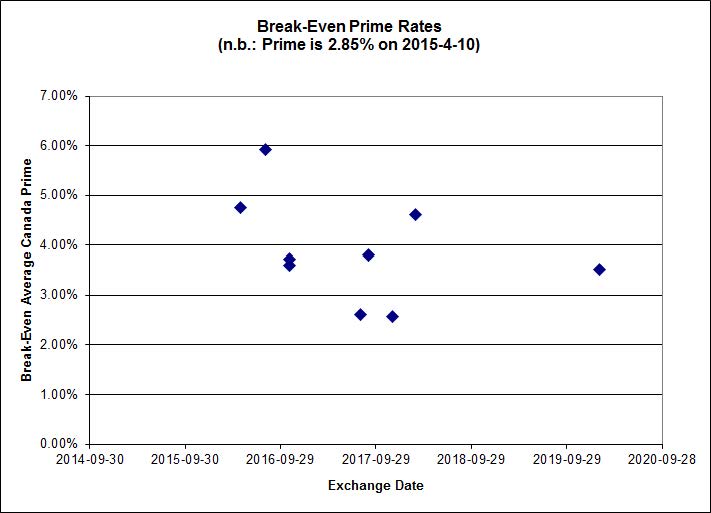
Click for Big
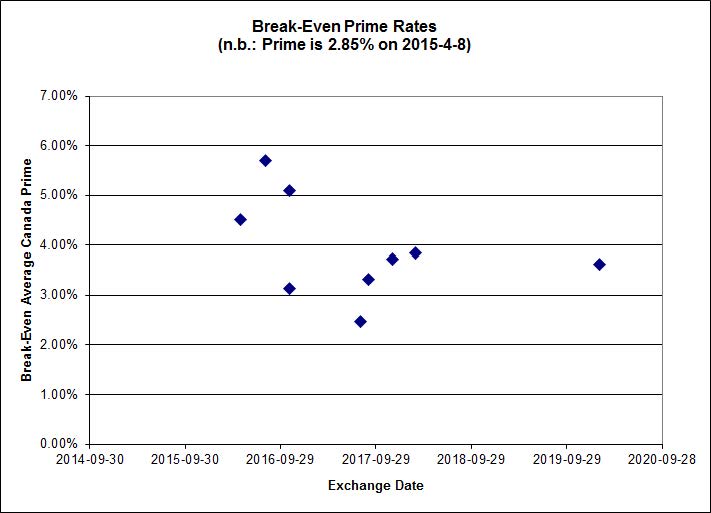
Shall we just say that this exhibits a high level of confidence in the continued rapacity of Canadian banks?
| HIMIPref™ Preferred Indices These values reflect the December 2008 revision of the HIMIPref™ Indices Values are provisional and are finalized monthly |
|||||||
| Index | Mean Current Yield (at bid) |
Median YTW |
Median Average Trading Value |
Median Mod Dur (YTW) |
Issues | Day’s Perf. | Index Value |
| Ratchet | 0.00 % | 0.00 % | 0 | 0.00 | 0 | -2.5428 % | 2,171.1 |
| FixedFloater | 0.00 % | 0.00 % | 0 | 0.00 | 0 | -2.5428 % | 3,796.1 |
| Floater | 3.34 % | 3.46 % | 58,792 | 18.64 | 4 | -2.5428 % | 2,308.1 |
| OpRet | 4.43 % | -1.13 % | 35,753 | 0.14 | 2 | 0.0394 % | 2,761.0 |
| SplitShare | 4.57 % | 4.66 % | 62,346 | 3.43 | 3 | -0.0801 % | 3,223.3 |
| Interest-Bearing | 0.00 % | 0.00 % | 0 | 0.00 | 0 | 0.0394 % | 2,524.6 |
| Perpetual-Premium | 5.32 % | 0.45 % | 65,660 | 0.09 | 25 | -0.1058 % | 2,523.0 |
| Perpetual-Discount | 5.08 % | 5.04 % | 148,157 | 15.09 | 9 | 0.0469 % | 2,806.4 |
| FixedReset | 4.53 % | 3.77 % | 269,807 | 16.43 | 85 | -0.5093 % | 2,355.7 |
| Deemed-Retractible | 4.91 % | 2.83 % | 106,746 | 0.29 | 37 | 0.0331 % | 2,659.0 |
| FloatingReset | 2.53 % | 2.97 % | 75,919 | 6.27 | 8 | -0.0746 % | 2,352.1 |
| Performance Highlights | |||
| Issue | Index | Change | Notes |
| PWF.PR.A | Floater | -5.71 % | YTW SCENARIO Maturity Type : Limit Maturity Maturity Date : 2045-04-10 Maturity Price : 16.50 Evaluated at bid price : 16.50 Bid-YTW : 3.05 % |
| ENB.PF.G | FixedReset | -3.56 % | YTW SCENARIO Maturity Type : Limit Maturity Maturity Date : 2045-04-10 Maturity Price : 20.02 Evaluated at bid price : 20.02 Bid-YTW : 4.72 % |
| CIU.PR.C | FixedReset | -3.30 % | YTW SCENARIO Maturity Type : Limit Maturity Maturity Date : 2045-04-10 Maturity Price : 16.10 Evaluated at bid price : 16.10 Bid-YTW : 3.50 % |
| ENB.PF.E | FixedReset | -2.62 % | YTW SCENARIO Maturity Type : Limit Maturity Maturity Date : 2045-04-10 Maturity Price : 20.08 Evaluated at bid price : 20.08 Bid-YTW : 4.67 % |
| ENB.PF.A | FixedReset | -2.29 % | YTW SCENARIO Maturity Type : Limit Maturity Maturity Date : 2045-04-10 Maturity Price : 20.03 Evaluated at bid price : 20.03 Bid-YTW : 4.65 % |
| GWO.PR.N | FixedReset | -2.28 % | YTW SCENARIO Maturity Type : Hard Maturity Maturity Date : 2025-01-31 Maturity Price : 25.00 Evaluated at bid price : 17.15 Bid-YTW : 6.62 % |
| BAM.PF.E | FixedReset | -2.17 % | YTW SCENARIO Maturity Type : Limit Maturity Maturity Date : 2045-04-10 Maturity Price : 22.28 Evaluated at bid price : 23.00 Bid-YTW : 3.87 % |
| TRP.PR.B | FixedReset | -2.13 % | YTW SCENARIO Maturity Type : Limit Maturity Maturity Date : 2045-04-10 Maturity Price : 13.79 Evaluated at bid price : 13.79 Bid-YTW : 3.76 % |
| PWF.PR.P | FixedReset | -1.99 % | YTW SCENARIO Maturity Type : Limit Maturity Maturity Date : 2045-04-10 Maturity Price : 17.26 Evaluated at bid price : 17.26 Bid-YTW : 3.58 % |
| ENB.PR.J | FixedReset | -1.97 % | YTW SCENARIO Maturity Type : Limit Maturity Maturity Date : 2045-04-10 Maturity Price : 19.90 Evaluated at bid price : 19.90 Bid-YTW : 4.54 % |
| BAM.PR.B | Floater | -1.76 % | YTW SCENARIO Maturity Type : Limit Maturity Maturity Date : 2045-04-10 Maturity Price : 14.50 Evaluated at bid price : 14.50 Bid-YTW : 3.46 % |
| ENB.PF.C | FixedReset | -1.76 % | YTW SCENARIO Maturity Type : Limit Maturity Maturity Date : 2045-04-10 Maturity Price : 20.10 Evaluated at bid price : 20.10 Bid-YTW : 4.63 % |
| IAG.PR.G | FixedReset | -1.74 % | YTW SCENARIO Maturity Type : Hard Maturity Maturity Date : 2025-01-31 Maturity Price : 25.00 Evaluated at bid price : 24.90 Bid-YTW : 3.87 % |
| TRP.PR.A | FixedReset | -1.66 % | YTW SCENARIO Maturity Type : Limit Maturity Maturity Date : 2045-04-10 Maturity Price : 18.90 Evaluated at bid price : 18.90 Bid-YTW : 3.77 % |
| TRP.PR.C | FixedReset | -1.51 % | YTW SCENARIO Maturity Type : Limit Maturity Maturity Date : 2045-04-10 Maturity Price : 15.66 Evaluated at bid price : 15.66 Bid-YTW : 3.81 % |
| MFC.PR.F | FixedReset | -1.36 % | YTW SCENARIO Maturity Type : Hard Maturity Maturity Date : 2025-01-31 Maturity Price : 25.00 Evaluated at bid price : 18.10 Bid-YTW : 6.33 % |
| BAM.PF.B | FixedReset | -1.31 % | YTW SCENARIO Maturity Type : Limit Maturity Maturity Date : 2045-04-10 Maturity Price : 22.10 Evaluated at bid price : 22.60 Bid-YTW : 3.93 % |
| BAM.PR.C | Floater | -1.30 % | YTW SCENARIO Maturity Type : Limit Maturity Maturity Date : 2045-04-10 Maturity Price : 14.45 Evaluated at bid price : 14.45 Bid-YTW : 3.47 % |
| PWF.PR.T | FixedReset | -1.29 % | YTW SCENARIO Maturity Type : Limit Maturity Maturity Date : 2045-04-10 Maturity Price : 23.09 Evaluated at bid price : 24.50 Bid-YTW : 3.31 % |
| SLF.PR.H | FixedReset | -1.12 % | YTW SCENARIO Maturity Type : Hard Maturity Maturity Date : 2025-01-31 Maturity Price : 25.00 Evaluated at bid price : 21.20 Bid-YTW : 5.12 % |
| ENB.PR.T | FixedReset | -1.03 % | YTW SCENARIO Maturity Type : Limit Maturity Maturity Date : 2045-04-10 Maturity Price : 19.20 Evaluated at bid price : 19.20 Bid-YTW : 4.54 % |
| MFC.PR.M | FixedReset | -1.03 % | YTW SCENARIO Maturity Type : Hard Maturity Maturity Date : 2025-01-31 Maturity Price : 25.00 Evaluated at bid price : 24.00 Bid-YTW : 4.07 % |
| MFC.PR.C | Deemed-Retractible | 1.24 % | YTW SCENARIO Maturity Type : Hard Maturity Maturity Date : 2025-01-31 Maturity Price : 25.00 Evaluated at bid price : 24.50 Bid-YTW : 4.82 % |
| Volume Highlights | |||
| Issue | Index | Shares Traded |
Notes |
| HSE.PR.A | FixedReset | 959,404 | RBC crossed two blocks of 443,800 each and another two of 30,300 each, all at 16.25. YTW SCENARIO Maturity Type : Limit Maturity Maturity Date : 2045-04-10 Maturity Price : 16.21 Evaluated at bid price : 16.21 Bid-YTW : 4.02 % |
| BAM.PF.C | Perpetual-Discount | 136,416 | RBC crossed 82,300 at 23.34. YTW SCENARIO Maturity Type : Limit Maturity Maturity Date : 2045-04-10 Maturity Price : 22.98 Evaluated at bid price : 23.30 Bid-YTW : 5.23 % |
| BMO.PR.Q | FixedReset | 130,935 | TD crossed blocks of 43,500 and 64,600, both at 22.91. YTW SCENARIO Maturity Type : Hard Maturity Maturity Date : 2022-01-31 Maturity Price : 25.00 Evaluated at bid price : 22.82 Bid-YTW : 3.90 % |
| ENB.PR.F | FixedReset | 126,709 | Desjardins crossed 100,000 at 19.25. YTW SCENARIO Maturity Type : Limit Maturity Maturity Date : 2045-04-10 Maturity Price : 19.01 Evaluated at bid price : 19.01 Bid-YTW : 4.54 % |
| BNS.PR.Z | FixedReset | 101,894 | TD crossed 83,100 at 22.90. YTW SCENARIO Maturity Type : Hard Maturity Maturity Date : 2022-01-31 Maturity Price : 25.00 Evaluated at bid price : 22.86 Bid-YTW : 3.74 % |
| FTS.PR.M | FixedReset | 90,791 | Scotia crossed 14,600 at 24.95; RBC crossed 70,000 at 24.98. YTW SCENARIO Maturity Type : Limit Maturity Maturity Date : 2045-04-10 Maturity Price : 23.12 Evaluated at bid price : 24.80 Bid-YTW : 3.38 % |
| There were 60 other index-included issues trading in excess of 10,000 shares. | |||
| Wide Spread Highlights | ||
| Issue | Index | Quote Data and Yield Notes |
| PWF.PR.A | Floater | Quote: 16.50 – 18.25 Spot Rate : 1.7500 Average : 1.1921 YTW SCENARIO |
| PWF.PR.T | FixedReset | Quote: 24.50 – 25.30 Spot Rate : 0.8000 Average : 0.5885 YTW SCENARIO |
| CIU.PR.C | FixedReset | Quote: 16.10 – 17.00 Spot Rate : 0.9000 Average : 0.7418 YTW SCENARIO |
| FTS.PR.F | Perpetual-Premium | Quote: 24.81 – 25.09 Spot Rate : 0.2800 Average : 0.1821 YTW SCENARIO |
| VNR.PR.A | FixedReset | Quote: 23.72 – 24.07 Spot Rate : 0.3500 Average : 0.2639 YTW SCENARIO |
| GWO.PR.N | FixedReset | Quote: 17.15 – 17.46 Spot Rate : 0.3100 Average : 0.2249 YTW SCENARIO |