Archive for November, 2008

MAPF Portfolio Composition, November 2008

Saturday, November 29th, 2008

Trading was heavy in November as a disorderly decline in a confused market brought many opportunities to the Fund, although there was a decline from October’s extraordinary level of activity.

Trades were, as ever, triggered by a desire to exploit transient mispricing in the preferred share market (which may the thought of as “selling liquidity”), rather than any particular view being taken on market direction, sectoral performance or credit anticipation.

MAPF Sectoral Analysis 2008-11-28
HIMI Indices Sector Weighting YTW ModDur
Ratchet 0% N/A N/A
FixFloat 0% N/A N/A
Floater 0% N/A N/A
OpRet 0% N/A N/A
SplitShare 33.4% (+12.3) 16.57% 4.24
Interest Rearing 0% N/A N/A
PerpetualPremium 0.0% (0) N/A N/A
PerpetualDiscount 66.5% (-8.4) 8.22% 11.15
Scraps 0% N/A N/A
Cash +0.1% (-3.8) 0.00% 0.00
Total 100% 11.00% 8.83
Totals and changes will not add precisely due to rounding. Bracketted figures represent change from October month-end. Cash is included in totals with duration and yield both equal to zero.

The “total” reflects the un-leveraged total portfolio (i.e., cash is included in the portfolio calculations and is deemed to have a duration and yield of 0.00.). MAPF will often have relatively large cash balances, both credit and debit, to facilitate trading. Figures presented in the table have been rounded to the indicated precision.

The proportion of SplitShares held increased as the fund took a position in FFN.PR.A on November 19, following a preciptuous price decline.

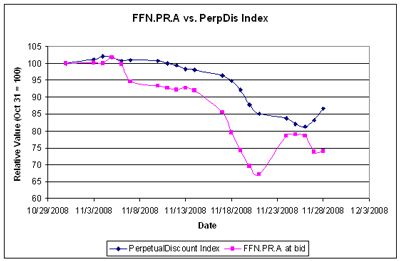
FFN.PR.A was one of November’s worst performers:

Asset coverage of 1.4+:1 as of November 14 according to the company. Now with a pre-tax bid-YTW of 17.40% based on a bid of 5.63 and a hardMaturity 2014-12-1 at 10.00. XFN may be used as a proxy (albeit not a terribly good one) for the holdings and is down 7.2% since Nov. 14, so estimate the month-end asset coverage as $13.00. Given that the ask price of the FFN capital units was 4.10 at month-end, this implies a retraction price of $8.43 … although retractions are tricky with this issue in this environment because the company requires ten notice days prior to the month-end retraction valuation date. Still, it’s tempting!

Although the asset coverage of the preferred share’s obligations is only about 1.3:1, the coverage of the capital invested is over 2:1. Additionally, the estimated retraction – as of November 28 – is very attractive, providing a large, immediate profit. The fly in the ointment regarding retraction is the lengthy notice period – ten days – required prior to the retraction date; this problem is exacerbated by all the holidays in December. The fund may elect to retract its holding of FFN.PR.A, but a decision will not be made until the last minute!

Sadly, this has been an unprofitable trade to date, but the enormous yield, good asset coverage (relative to invested capital) and favourable retraction possibility means my only regret is missing the bottom by a few days!

Credit distribution is:

MAPF Credit Analysis 2008-11-28
DBRS Rating Weighting
Pfd-1 56.7% (-18.5)
Pfd-1(low) 10.5% (+10.2)
Pfd-2(high) 0% (0)
Pfd-2 0.4% (0)
Pfd-2(low) 32.3% (+12.2)
Cash 0.1% (-3.8)
Totals will not add precisely due to rounding. Bracketted figures represent change from October month-end.

The fund does not set any targets for overall credit quality; trades are executed one by one. Variances in overall credit will be constant as opportunistic trades are executed. The overall credit quality of the portfolio is now roughly equal to the credit quality of CPD at August month-end. The fund has a position in FBS.PR.B, currently under review-negative by DBRS and the position in FFN.PR.A is vulnerable, but is should be noted that while the asset coverage relative to obligations is under pressure, the asset coverage relative to invested capital remains comfortable.

MAPF Split Share Positions
(Major)
Asset coverage
Ticker NAVPU
11/28
(Estimate)
Preferred
Obligation
Asset
Coverage
(Obligation)
MAPF
Book Price
Asset
Coverage
(Invested
Capital)
FBS.PR.B $12.09 $10.00 1.2+:1 $7.02 1.7+:1
FFN.PR.A $13.05 $10.00 1.3+:1 $6.43 2.0+:1
BNA.PR.C $45.82 $25.00 1.8+:1 $17.25 2.7-:1
FBS.PR.B NAVPU $11.28 11/27, XFN has increased 7.2% in interim
FFN.PR.A NAVPU $14.06 11/14, XFN has declined 7.2% in interim
BNA.PR.C, approximately 2.4 shares of BAM.A per unit; BAM.A closed at 19.09 11/28

Liquidity Distribution is:

MAPF Liquidity Analysis 2008-11-28
Average Daily Trading Weighting
<$50,000 11.1% (+9.5)
$50,000 – $100,000 33.2% (+4.7)
$100,000 – $200,000 1.0% (-29.4)
$200,000 – $300,000 21.3% (+2.8)
>$300,000 33.2% (+15.2)
Cash 0.1% 3.9% (-3.8)
Totals will not add precisely due to rounding. Bracketted figures represent change from October month-end.

MAPF is, of course, Malachite Aggressive Preferred Fund, a “unit trust” managed by Hymas Investment Management Inc. Further information and links to performance, audited financials and subscription information are available the fund’s web page. A “unit trust” is like a regular mutual fund, but is sold by offering memorandum rather than prospectus. This is cheaper, but means subscription is restricted to “accredited investors” (as defined by the Ontario Securities Commission) and those who subscribe for $150,000+. Fund past performances are not a guarantee of future performance. You can lose money investing in MAPF or any other fund.

A similar portfolio composition analysis has been performed on The Claymore Preferred Share ETF (symbol CPD) as of August 29. When comparing CPD and MAPF:

  • MAPF credit quality is similar
  • MAPF liquidity is somewhat higher
  • MAPF Yield is higher
  • But … MAPF is more exposed to PerpetualDiscounts and SplitShares
  • MAPF is less exposed to Fixed-Resets and Operating Retractibles

Index Performance: November 2008

Saturday, November 29th, 2008

Performance of the HIMIPref™ Indices for November, 2008, was:

Total Return
Index Performance
November 2008
Three Months
to
November 28, 2008
Ratchet N/A N/A
FixFloat -17.02% -28.88%
Floater -31.57% -61.61%
OpRet -1.46% -7.06%
SplitShare -12.42% -21.67%
Interest -11.59% -29.33%
PerpetualPremium N/A N/A
PerpetualDiscount -13.34% -21.66%
FixedReset -8.88% N/A
Funds (see below for calculations)
CPD -11.10% -19.90%
DPS.UN -12.95% -24.18%
Index
BMO-CM 50 -10.70% -20.11%

Claymore has published NAV and distribution data for its exchange traded fund (CPD) and I have derived the following table:

CPD Return, 1- & 3-month, to November, 2008
Date NAV Distribution Return for Sub-Period Monthly Return
August 29, 2008 16.91      
Sept 25 16.41 0.2135 -1.69% -2.89%
Sept 30 16.21   -1.22%
October 31 15.04 0.00   -7.22%
November 28, 2008 13.37 0.00   -11.10%
Quarterly Return -19.90%

The DPS.UN NAV for November 26 has been published so we may calculate the November returns (approximately!) for this closed end fund:

DPS.UN NAV Return, November-ish 2008
Date NAV Distribution Return for period
Estimated October Ending Stub +1.42%
October 29, 2008 16.96    
November 26, 2008 14.53   -14.33%
Estimated November Ending Stub +3.80%
Estimated November Return -12.95%
CPD had a NAV of $14.83 on October 29 and $15.04 on October 31. The estimated October end of month stub period return for CPD was therefore +1.42%, which is subtracted from the DPS.UN period return to estimate a return for the period.
CPD had a NAV of $12.88 on November 26 and $13.37 on November 28. The estimated November month-end stub period return for CPD was therefore +3.80%, which is added to the DPS.UN period return to estimate a return for the period.
The October return for DPS.UN’s NAV is therefore the product of three period returns, -1.42%, -14.33% & +3.08%, to arrive at an estimate for the calendar month of -12.95%

Now, to see the DPS.UN quarterly NAV approximate return, we refer to the calculations for September and October:

DPS.UN NAV Returns, three-month-ish to end-October-ish, 2008
September-ish -3.70%
October-ish -9.56%
November-ish -12.95%
Three-months-ish -24.18%

Best & Worst Performers: November 2008

Saturday, November 29th, 2008

These are total returns, with dividends presumed to have been reinvested at the bid price on the ex-date. The list has been restricted to issues in the HIMIPref™ indices.

November, 2008
Issue Index DBRS Rating Monthly Performance Notes (“Now” means “November 28”)
BAM.PR.K Floater Pfd-2(low) -35.0649% Was also the worst performer in September and second worst in October – it has been hit not just by the general downdraft in BAM issues, but by expectations of continuing drops in prime. Is it any wonder it is starting to attract interest? Worthy of note is the fact that the BAM floaters are trading through the BPP floaters; similar terms, issued by a subsidiary with an even higher proportion of commercial property exposure, lower rating, extremely illiquid … and have been trading through them for months.
BAM.PR.B Floater Pfd-2(low) -30.8081% Also a poor performer in September and October.
BAM.PR.J OpRet Pfd-2(low) -30.1646% Now with a pre-tax bid-YTW of 15.43% based on a bid of 13.15 and a softMaturity 2018-3-30 at 25.00.
BNA.PR.C SplitShare Pfd-2(low) -25.9396% Asset coverage of 1.8+:1 based on BAM.A at 19.09 and 2.4 BAM.A per unit. Now with a pre-tax bid-YTW of 18.61% based on a bid of 9.10 and a hardMaturity 2019-1-10 at 25.00.
FFN.PR.A SplitShare Pfd-2(low) -25.4771% Asset coverage of 1.4+:1 as of November 14 according to the company. Now with a pre-tax bid-YTW of 17.40% based on a bid of 5.63 and a hardMaturity 2014-12-1 at 10.00. XFN may be used as a proxy (albeit not a terribly good one) for the holdings and is down 7.2% since Nov. 14, so estimate the month-end asset coverage as $13.00. Given that the ask price of the FFN capital units was 4.10 at month-end, this implies a retraction price of $8.43 … although retractions are tricky with this issue in this environment because the company requires ten notice days prior to the month-end retraction valuation date. Still, it’s tempting!
WFS.PR.A SplitShare Pfd-2(low) -0.0971% Asset coverage of 1.1+:1 as of November 20 according to Mulvihill. The company announced an issuer bid and is under credit review negative. Now with a pre-tax bid-YTW of 16.59% based on a bid of 7.80 and a hardMaturity 2011-6-30 at 10.00. Estimated retraction price of 8.54 using NAV of 11.27 and Capital Units of 2.37.
TD.PR.N OpRet Pfd-1 +1.2500% Now with a pre-tax bid-YTW of 4.60% based on a bid of 25.11 and a softMaturity 2014-1-30 at 25.00.
IGM.PR.A OpRet Pfd-2(high) +1.4289% Now with a pre-tax bid-YTW of 5.56% based on a bid of 25.10 and a softMaturity 2013-6-29 at 25.00.
TD.PR.M OpRet Pfd-1 +3.4666% Now with a pre-tax bid-YTW of 4.47% based on a bid of 25.37 and a softMaturity 2013-10-30 at 25.00.
GWO.PR.E OpRet Pfd-1(low) +3.6653% Now with a pre-tax bid-YTW of 4.85% based on a bid of 24.75 and a softMaturity 2014-3-30 at 25.00.

Just as in August 2007, BAM issues are over-represented in the poor performers’ list … and I am just as unable to find a convincing rationale for this.

November 28, 2008

Saturday, November 29th, 2008

Chaos and pandemonium today. Perhaps some investors are enthused about the proposed bank stake legislation?

Another piece of legislation made quaint by the financial crisis also forced Mr. Flaherty to risk raising the spectre of a public bailout of Canadian banks by acknowledging the government doesn’t currently have the power to buy shares in financial institutions – something governments in the U.S. and Europe did, to the tune of hundreds of billions this year, to keep their banks from failing.

The new Fed Balance sheet shows a slight shrinkage, with a decline in liabilities to depositors of all stripes balanced by a decline in foreign currency assets. Hmmm … Bloomberg highlights the continued increase in commercial paper holdings.

Sorry folks – no words of wisdom today. Just be grateful the month is over, that’s my advice.

Note that these indices are experimental; the absolute and relative daily values are expected to change in the final version. In this version, index values are based at 1,000.0 on 2006-6-30.
The Fixed-Reset index was added effective 2008-9-5 at that day’s closing value of 1,119.4 for the Fixed-Floater index.
Index Mean Current Yield (at bid) Mean YTW Mean Average Trading Value Mean Mod Dur (YTW) Issues Day’s Perf. Index Value
Ratchet N/A N/A N/A N/A 0 N/A N/A
Fixed-Floater 6.65% 6.97% 76,605 13.69 6 +2.6042% 791.9
Floater 10.11% 10.41% 59,282 9.11 2 +4.7746% 350.0
Op. Retract 5.50% 6.81% 138,568 4.17 15 +0.0669% 980.0
Split-Share 7.58% 15.82% 69,411 3.68 12 +1.8318% 816.9
Interest Bearing 9.15% 19.41% 58,730 2.99 3 +2.0262% 798.4
Perpetual-Premium N/A N/A N/A N/A N/A N/A N/A
Perpetual-Discount 7.99% 8.11% 190,698 11.33 71 +4.1904% 690.2
Fixed-Reset 6.11% 5.76% 1,150,302 14.04 12 +0.1987% 976.7
Major Price Changes
Issue Index Change Notes
HSB.PR.D PerpetualDiscount +6.1211% Now with a pre-tax bid-YTW of 8.03% based on a bid of 15.95 and a limitMaturity. Closing quote 15.95-98, 6×1. Day’s range of 15.00-98.
RY.PR.E PerpetualDiscount +6.2670% Now with a pre-tax bid-YTW of 7.29% based on a bid of 15.60 and a limitMaturity. Closing quote 15.60-79, 1×4. Day’s range of 14.76-15.89.
BMO.PR.K PerpetualDiscount +6.3492% Now with a pre-tax bid-YTW of 7.92% based on a bid of 16.75 and a limitMaturity. Closing quote 16.75-24, 10×12. Day’s range of 15.45-17.25.
CM.PR.G PerpetualDiscount +6.3884% Now with a pre-tax bid-YTW of 8.17% based on a bid of 16.82 and a limitMaturity. Closing quote 16.82-39, 9X14. Day’s range of 15.62-17.48.
TD.PR.Q PerpetualDiscount +6.4000% Now with a pre-tax bid-YTW of 7.6377% based on a bid of 18.62 and a limitMaturity. Closing quote 18.62-26, 5×3. Day’s range of 17.51-19.55 (!).
PWF.PR.E PerpetualDiscount +6.5246% Now with a pre-tax bid-YTW of 8.75% based on a bid of 16.00 and a limitMaturity. Closing quote 16.00-20, 7×4. Day’s range of 15.08-16.20.
BNS.PR.J PerpetualDiscount +6.5432% Now with a pre-tax bid-YTW of 7.73% based on a bid of 17.26 and a limitMaturity. Closing quote 17.26-50, 7×10. Day’s range of 16.05-17.59.
RY.PR.C PerpetualDiscount +6.5912% Now with a pre-tax bid-YTW of 7.26% based on a bid of 16.01 and a limitMaturity. Closing quote 16.01-70, 3×20. Day’s range of 15.15-16.45.
RY.PR.F PerpetualDiscount +6.9607% Now with a pre-tax bid-YTW of 7.24% based on a bid of 15.52 and a limitMaturity. Closing quote 15.52-90, 3×4. Day’s range of 14.60-15.94.
CM.PR.P PerpetualDiscount +7.3671% Now with a pre-tax bid-YTW of 8.35% based on a bid of 16.76 and a limitMaturity. Closing quote 16.76-25, 3×8. Day’s range of 15.65-17.00.
SLF.PR.E PerpetualDiscount +7.5099% Now with a pre-tax bid-YTW of 8.29% based on a bid of 13.60 and a limitMaturity. Closing quote 13.60-65, 3×8. Day’s range of 12.05-13.65.
PWF.PR.I PerpetualDiscount +7.5758% Now with a pre-tax bid-YTW of 8.60% based on a bid of 17.75 and a limitMaturity. Closing quote 17.75-90, 30×8. Day’s range of 16.40-17.75.
GWO.PR.G PerpetualDiscount +7.8614% Now with a pre-tax bid-YTW of 8.05% based on a bid of 16.19 and a limitMaturity. Closing quote 16.19-30, 4×4. Day’s range of 15.00-16.39.
CM.PR.H PerpetualDiscount +7.9100% Now with a pre-tax bid-YTW of 8.21% based on a bid of 14.87 and a limitMaturity. Closing quote 14.87-98, 5×5. Day’s range of 13.57-14.99.
CM.PR.J PerpetualDiscount +7.9414% Now with a pre-tax bid-YTW of 8.18% based on a bid of 14.00 and a limitMaturity. Closing quote 14.00-25, 2×5. Day’s range of 13.17-14.25.
POW.PR.A PerpetualDiscount +7.9843% Now with a pre-tax bid-YTW of 8.67% based on a bid of 16.50 and a limitMaturity. Closing quote 16.50-75, 4×22. Day’s range of 15.84-50.
PWF.PR.L PerpetualDiscount +8.0000% Now with a pre-tax bid-YTW of 8.14% based on a bid of 15.93 and a limitMaturity. Closing quote 15.93-00, 1×20. Day’s range of 15.00-16.20.
BNA.PR.B SplitShare +8.0028% Asset coverage of 1.8+:1 based on BAM.A at 19.09 and 2.4 BAM.A per unit. Now with a pre-tax bid-YTW of 15.25 based on a bid of 15.25 and a hardMaturity 2016-3-25 at 25.00. Closing quote of 15.25-00, 7×4. One trade, 100 shares, at 16.00.
PWF.PR.F PerpetualDiscount +8.4746% Now with a pre-tax bid-YTW of 8.34% based on a bid of 16.00 and a limitMaturity. Closing quote 16.00-17.00, 1×4. Day’s range of 15.00-16.50.
MFC.PR.C PerpetualDiscount +8.4871% Now with a pre-tax bid-YTW of 7.69% based on a bid of 14.70 and a limitMaturity. Closing quote 14.70-15.79 (!), 1×3. Day’s range of 13.85-15.98 (!).
ELF.PR.F PerpetualDiscount +8.7705% Now with a pre-tax bid-YTW of 10.23% based on a bid of 13.27 and a limitMaturity. Closing quote 13.27-74, 17×10. Day’s range of 12.40-27.
ELF.PR.G PerpetualDiscount +8.7783% Now with a pre-tax bid-YTW of 10.12% based on a bid of 12.02 and a limitMaturity. Closing quote 12.02-13.15 (!) 1×5. Day’s range of 11.15-12.50.
MFC.PR.B PerpetualDiscount +9.5306% Now with a pre-tax bid-YTW of 7.59% based on a bid of 15.40 and a limitMaturity. Closing quote 15.40-00, 1×5. Day’s range of 14.00-15.45.

There were sixty-eight index-included $25-pv-equivalent issues trading over 10,000 shares today. Sorry there’s no table!

PWF.PR.M Closes with Greenshoe!

Friday, November 28th, 2008

Power Financial has announced:

the successful completion and closing of an offering of 7,000,000 Non-Cumulative 5-Year Rate Reset First Preferred Shares, Series M (the “Series M Shares”), priced at $25.00 per share to raise gross proceeds of $175 million.

The issue was bought by an underwriting group led by BMO Capital Markets and Scotia Capital Inc. Following the successful sale of the initially announced 6,000,000 Series M Shares, the underwriters exercised an option to purchase an additional 1,000,000 Series M Shares.

The Series M Shares will be listed and posted for trading on the Toronto Stock Exchange under the symbol “PWF.PR.M”. Proceeds from the issue will be used to supplement Power Financial’s financial resources and for general corporate purposes.

The greenshoe noted in the initial announcement was therefore 50% subscribed.

Sadly for the buyers, however, the issue is trading more as a perpetual than a retractible. closing at 23.83-98, 10×19, after trading 125,030 shares in a range of 23.75-20. The yield until the limitMaturity is 6.18%, while the yield to the first call is 7.13%.

The issue has been added to the FixedReset Index.

I have uploaded an evaluation of the FixedReset subIndex.

November 27, 2008

Thursday, November 27th, 2008

Spend-every-penny announced today that the proper manner to fight imminent recession is to cut government spending, end the right to strike for civil servants and eliminate the pension problem by eliminating the rules.

After thirteen straight trading days of losses, eight of which were over 1%, and cumulatively a stunning crash of 19.53% … the Americans stayed home to eat turkey … and the PerpetualDiscount market went up!

Note that these indices are experimental; the absolute and relative daily values are expected to change in the final version. In this version, index values are based at 1,000.0 on 2006-6-30.
The Fixed-Reset index was added effective 2008-9-5 at that day’s closing value of 1,119.4 for the Fixed-Floater index.
Index Mean Current Yield (at bid) Mean YTW Mean Average Trading Value Mean Mod Dur (YTW) Issues Day’s Perf. Index Value
Ratchet N/A N/A N/A N/A 0 N/A N/A
Fixed-Floater 6.81% 7.17% 75,012 13.47 6 -0.6039% 771.8
Floater 10.59% 10.92% 58,778 8.74 2 -13.5665% 334.0
Op. Retract 5.51% 6.82% 137,532 4.17 15 +0.3483% 979.3
Split-Share 7.71% 16.43% 69,267 3.68 12 -0.3225% 802.2
Interest Bearing 9.33% 19.86% 59,862 2.94 3 -0.6884% 782.5
Perpetual-Premium N/A N/A N/A N/A N/A N/A N/A
Perpetual-Discount 8.32% 8.44% 187,123 10.99 71 +2.2778% 662.5
Fixed-Reset 6.10% 5.73% 1,077,888 14.07 12 -0.4512% 974.8
Major Price Changes
Issue Index Change Notes
BAM.PR.K Floater -15.1282%  
BAM.PR.B Floater -12.0000%  
FFN.PR.A SplitShare -6.1873% Asset coverage of 1.4+:1 as of November 14 according to the company. Now with a pre-tax bid-YTW of 17.47% based on a bid of 5.61 and a hardMaturity 2014-12-1 at 10.00. Closing quote of 5.60-69, 291×2. Day’s range of 5.50-98.
BNA.PR.A SplitShare -6.0052% Asset coverage of 1.7+:1 as of today, based on BAM.A at 18.11 and 2.4 BAM.A shares per BNA unit. Now with a pre-tax bid-YTW of 26.55% based on a bid of 18.00 and a hardMaturity 2010-9-30 at 25.00. Closing quote of 18.00-50, 10×12. Day’s range of 18.85-15.
BCE.PR.R FixFloat -5.7648%  
BNA.PR.B SplitShare -5.4886% See BNA.PR.A, above. Now with a pre-tax bid-YTW of 15.01% based on a bid of 14.12 and a hardMaturity 2016-3-25 at 25.00. Closing quote of 14.12-16.47 (!), 5×2. Day’s range of 13.06-15.20 (!).
W.PR.J PerpetualDiscount +5.0286% Now with a pre-tax bid-YTW of 9.08% based on a bid of 15.76 and a limitMaturity. Closing quote 15.76-89, 4×1. Day’s range of 14.51-15.99.
FBS.PR.B SplitShare +5.2679% Asset coverage of 1.1-:1 as of November 20 according to TD Securities. Now with a pre-tax bid-YTW of 16.62% based on a bid of 7.25 and a hardMaturity 2011-12-15 at 10.00. Closing quote of 7.25-49, 49×46. Day’s range of 7.11-49.
PWF.PR.F PerpetualDiscount +5.3571% Now with a pre-tax bid-YTW of 9.06% based on a bid of 14.75 and a limitMaturity. Closing quote 14.75-40, 9×3. Day’s range of 14.60-49.
NA.PR.L PerpetualDiscount +5.3725% Now with a pre-tax bid-YTW of 8.35% based on a bid of 14.71 and a limitMaturity. Closing quote 14.71-48, 4×5. Day’s range of 13.96-70.
IAG.PR.A PerpetualDiscount +5.4936% Now with a pre-tax bid-YTW of 8.70% based on a bid of 13.25 and a limitMaturity. Closing quote 13.25-40, 18×12. Day’s range of 12.56-40.
CM.PR.G PerpetualDiscount +6.0362% Now with a pre-tax bid-YTW of 8.70% based on a bid of 15.81 and a limitMaturity. Closing quote 15.81-94, 3X2. Day’s range of 15.03-94.
RY.PR.A PerpetualDiscount +7.00% Now with a pre-tax bid-YTW of 7.49% based on a bid of 14.99 and a limitMaturity. Closing quote 14.99-00, 2×8. Day’s range of 14.50-00.
GWO.PR.I PerpetualDiscount +7.1249% Now with a pre-tax bid-YTW of 8.31% based on a bid of 13.57 and a limitMaturity. Closing quote 13.57-10, 2×5. Day’s range of 13.37-20.
POW.PR.A PerpetualDiscount +7.5299% Now with a pre-tax bid-YTW of 9.37% based on a bid of 15.28 and a limitMaturity. Closing quote 15.28-75, 10×6. Day’s range of 15.55-85.
GWO.PR.G PerpetualDiscount +7.9170% Now with a pre-tax bid-YTW of 8.68% based on a bid of 15.01 and a limitMaturity. Closing quote 15.01-12, 1×4. Day’s range of 14.21-15.40.
POW.PR.B PerpetualDiscount +12.2807% Now with a pre-tax bid-YTW of 8.54% based on a bid of 16.00 and a limitMaturity. Closing quote 16.00-95, 7×2. Day’s range of 14.46-15.80.
Volume Highlights
Issue Index Volume Notes
GWO.PR.J FixedReset 358,750 Eight blocks totalling 182,100 shares. New Issue settled today.
TD.PR.N OpRet 103,250 CIBC crossed 100,000 at 25.25. Now with a pre-tax bid-YTW of 4.48% based on a bid of 25.25 and a softMaturity 2014-1-30 at 25.00.
WFS.PR.A SplitShare 128,900 Desjardins crossed 100,000 at 8.00. Asset coverage of 1.1+:1 as of November 20 according to Mulvihill. Now with a pre-tax bid-YTW of 16.40% based on a bid of 7.83 and a hardMaturity 2011-6-30 at 10.00.
BNS.PR.N PerpetualDiscount 51,543 Now with a pre-tax bid-YTW of 8.37% based on a bid of 15.94 and a limitMaturity.
CM.PR.H PerpetualDiscount 38,582 Now with a pre-tax bid-YTW of 8.87% based on a bid of 13.78 and a limitMaturity.

There were fifty-three other index-included $25-pv-equivalent issues trading over 10,000 shares today.

GWO.PR.J Closes with Greenshoe!

Thursday, November 27th, 2008

Greatwest Lifeco has announced:

the closing of its previously announced offering of Non-Cumulative 5-Year Rate Reset First Preferred Shares, Series J (the “Series J Shares”) priced at $25.00 per share. Following the successful sale of the initially announced offering of 8,000,000 Series J Shares, the underwriters of the offering exercised their over-allotment option to purchase an additional 1,200,000 Series J Shares, resulting in the Company issuing today 9,200,000 Series J Shares to raise gross proceeds of $230 million. The net proceeds will be used by the Company for general corporate purposes and to augment Lifeco’s current liquidity position.

The offering was made through a syndicate of underwriters led by BMO Nesbitt Burns Inc. and Scotia Capital Inc. The shares will be posted for trading on the Toronto Stock Exchange under the symbol “GWO.PR.J”.

The greenshoe noted in the initial announcement was therefore fully subscribed.

Sadly for the buyers, however, the issue is trading more as a perpetual than a retractible. closing at 24.25-35 on volume of 358,750 shares. The yield until the limitMaturity is 5.97%, while the yield to the first call is 6.73%.

The issue has been added to the FixedReset Index.

I have uploaded an evaluation of the FixedReset subIndex

CBU.PR.A Completes Investment of New Issue Proceeds

Thursday, November 27th, 2008

Ordinarily this wouldn’t be worth a post. A split-share company starts up, they get a cheque from the underwriters, they put it to work. Big deal.

On this occasion, however, the announcement from First Asset had a certain Wow! factor:

When the preliminary prospectus was filed on September 10, 2008, the approximate dividend yield on the Portfolio would have been approximately 4.74% with the Preferred Shares having initial dividend coverage of 172%. As a result of the sell off prior to and during the investing period, the yield of the acquired Portfolio is 6.06% with dividend coverage of the Preferred Shares of 218% with approximately $0.25/Unit per annum of initial excess cash flow after deducting expenses. Any such excess cash flow will contribute to the growth of the Net Asset Value of the Company.

The closing of this issue was reported on PrefBlog. CBU.PR.A will not be tracked by HIMIPref™. It’s a shame, given the fat coupon and the 2.5:1 asset coverage, but it’s just too small to trade efficiently.

November 26, 2008

Wednesday, November 26th, 2008

Moody’s notes that its accuracy ratio has declined:

Moody’s ratings performance has deteriorated sharply from the elevated levels seen in recent years. The deterioration is primarily driven by investment grade defaults that include multiple affiliates of Lehman Brothers and Washington Mutual. The one-year horizon “accuracy ratio” (AR) was 78.7% in the third quarter relative to 94.7% a year ago. This sharp decline in performance is similar to that observed in previous downturns that were marked by a sudden surge in the aggregate default rate. The investment grade default rate at 0.12%, while above its historical average of 0.05%, is currently below the 0.5% observed at the peak of the previous downturn in
2000-2002.

Accrued Interest takes exception to Moody’s negative views on the Financial Guarantee business.

What a day! The TXPR index was down 5.94% on the BCE news.

Note that these indices are experimental; the absolute and relative daily values are expected to change in the final version. In this version, index values are based at 1,000.0 on 2006-6-30.
The Fixed-Reset index was added effective 2008-9-5 at that day’s closing value of 1,119.4 for the Fixed-Floater index.
Index Mean Current Yield (at bid) Mean YTW Mean Average Trading Value Mean Mod Dur (YTW) Issues Day’s Perf. Index Value
Ratchet N/A N/A N/A N/A 0 N/A N/A
Fixed-Floater 6.77% 7.12% 76,841 13.53 6 -25.0084% 776.5
Floater 9.15% 9.39% 57,533 9.94 2 +1.7664% 386.5
Op. Retract 5.46% 8.02% 137,799 3.87 15 -0.8053% 975.9
Split-Share 7.67% 16.26% 67,294 3.69 12 +0.2993% 804.8
Interest Bearing 9.26% 19.99% 59,358 2.99 3 +3.7771% 787.9
Perpetual-Premium N/A N/A N/A N/A N/A N/A N/A
Perpetual-Discount 8.49% 8.63% 185,439 10.80 71 -0.8010% 647.7
Fixed-Reset 6.07% 5.68% 968,924 14.14 12 -1.3168% 979.2
Major Price Changes
Issue Index Change Notes
BCE.PR.Z FixFloat -28.8889%  
BCE.PR.Y Ratchet -28.6423%  
BCE.PR.I FixFloat -28.2174%  
BCE.PR.G FixFloat -26.8603%  
BCE.PR.C FixFloat -24.5725%  
BCE.PR.R FixFloat -22.1333%  
BCE.PR.A FixFloat +4.7619%  
BAM.PR.J OpRet -11.3715% Now with a pre-tax bid-YTW of 15.80% based on a bid of 12.86 and a softMaturity 2018-3-30 at 25.00. Closing quote of 12.86-52, 3×5. Day’s range of 12.85-50.
BNA.PR.C SplitShare -10.0000% Asset coverage of 1.7-:1 based on BAM.A at 17.21 and 2.4 BAM.A / unit. Now with a pre-tax bid-YTW of 18.77% based on a bid of 9.00 and a hardMaturity 2019-1-10 at 25.00. Closing quote 9.00-9.69, 2×3. Day’s range of 9.00-10.00.
CIU.PR.A PerpetualDiscount -10.0000% Now with a pre-tax bid-YTW of 8.32% based on a bid of 13.95 and a limitMaturity. Closing quote 13.95-00, 1×75. Day’s range of 14.00-15.25.
POW.PR.A PerpetualDiscount -9.9493% Now with a pre-tax bid-YTW of 10.09% based on a bid of 14.21 and a limitMaturity. Closing quote 14.21-15.74 (!), 3×2. Day’s range of 13.82-15.75.
CL.PR.B PerpetualDiscount -6.6793% Now with a pre-tax bid-YTW of 8.12% based on a bid of 19.70 and a limitMaturity. Closing quote 19.70-28, 3×3. Day’s range of 19.50-21.50 (!).
BNA.PR.B SplitShare -6.6250% See BNA.PR.C, above. Now with a pre-tax bid-YTW of 13.95% based on a bid of 14.94 and a hardMaturity 2016-3-25 at 25.00. Closing quote of 14.94-15.99 (!), 4×1. Day’s range of 14.93-16.99 (!).
BNS.PR.Q FixedReset -6.4731%  
BNS.PR.P FixedReset -5.6180%  
PWF.PR.G PerpetualDiscount -5.5556% Now with a pre-tax bid-YTW of 8.83% based on a bid of 17.00 and a limitMaturity. Closing quote 17.00-93, 1×12. Day’s range of 16.90-18.00.
LBS.PR.A SplitShare -5.5215% Asset coverage of 1.3+:1 as of November 20, according to Brompton Group. Now with a pre-tax bid-YTW of 17.32% based on a bid of 6.16 and a hardMaturity 2013-11-29 at 10.00. Closing quote of 6.16-50, 35×2. Day’s range of 5.76-52.
BAM.PR.B Floater -5.0633%  
POW.PR.D PerpetualDiscount +5.4545% Now with a pre-tax bid-YTW of 8.81% based on a bid of 14.50 and a limitMaturity. Closing quote 14.50-87, 6×3. Day’s range of 13.75-51.
FTN.PR.A SplitShare +6.5467% Asset coverage of 1.7-:1 as of November 14, according to the company. Now with a pre-tax bid-YTW of 12.59% based on a bid of 6.69 and a hardMaturity 2015-12-1 at 10.00. Closing quote of 6.69-23, 32×5. Day’s range of 6.15-7.25.
FIG.PR.A +7.3171% InterestBearing Asset coverage of 1.1-:1 as of November 25, according to the Capital unit NAV of 1.39 and 0.71 Capital Units per preferred. Now with a pre-tax bid-YTW of 15.43% based on a bid of 6.60 and a hardMaturity 2014-12-31 at 10.00. Closing quote of 6.60-74, 4×1. Day’s range of 6.12-60
BAM.PR.K Floater +8.3333%  
LFE.PR.A SplitShare +12.1616% Asset coverage of 1.6-:1 as of November 14 according to the company. Now with a pre-tax bid-YTW of 15.70% based on a bid of 7.00 and a hardMaturity 2012-12-1 at 10.00. Closing quote of 7.00-24, 189×1. Day’s range of 6.52-25.
Volume Highlights
Issue Index Volume Notes
NSI.PR.C Scraps (would be OpRet, but there are volume concerns) 241,600 Nesbitt crossed 39,200 at 25.05 the CIBC crossed blocks of 178,400 & 21,600 at the same price. Now with a pre-tax bid-YTW of 4.96% based on a bid of 25.00 and optionCertainty 2038-11-26 at 24.75.
CGI.PR.B Scraps 202,700 CIBC crossed 192,000 at 22.70. Now with a pre-tax bid-YTW of 6.73% based on a bid of 22.70 and a softMaturity 2014-3-14 at 25.00.
L.PR.A Scraps (would be OpRet but there are credit concerns) 149,695 TD crossed 137,400 at 21.80. Now with a pre-tax bid-YTW of 8.70% based on a bid of 21.76 and a softMaturity 2015-7-30 at 25.00
SLF.PR.C PerpetualDiscount 121,050 CIBC crossed 100,000 at 12.50. Now with a pre-tax bid-YTW of 8.88% based on a bid of 12.55 and a limitMaturity.
SLF.PR.D PerpetualDiscount 117,909 CIBC crossed 100,000 at 12.40. Now with a pre-tax bid-YTW of 9.07% based on a bid of 12.30 and a limitMaturity.
WN.PR.B Scraps (would be OpRet but there are credit concerns) 112,200 Desjardins crossed 50,000 at 25.10, then CIBC crossed 50,000 at the same price. Now with a pre-tax bid-YTW of 6.59% based on a bid of 25.00 and optionCertainty 2009-6-30
TD.PR.M OpRet 101,710 CIBC bought 97,500 from Desjardins at 25.36. Now with a pre-tax bid-YTW of 4.47% based on a bid of 25.36 and a softMaturity 2013-10-30 at 25.00.
TCA.PR.Y PerpetualDiscount 83,562 National crossed 80,000 at 42.25. Now with a pre-tax bid-YTW of 6.84% based on a bid of 41.51 and a limitMaturity.
SBC.PR.A SplitShare 180,072 DIBC crossed 103,600 at 7.10, Desjardins crossed 70,000 at 7.02. Now with a pre-tax bid-YTW of 15.84% based on a bid of 7.03 and a hardMaturity 2012-11-30.

There were sixty other index-included $25-pv-equivalent issues trading over 10,000 shares today.

UST.PR.A Renews Issuer Bid

Wednesday, November 26th, 2008

First Asset has announced:

acceptance by the Toronto Stock Exchange (the “TSX”) of the Trust’s Notice of Intention to make a Normal Course Issuer Bid (the “NCIB”) to permit the Trust to acquire its Preferred Securities and Capital Units (collectively, the “Securities”).

Pursuant to the NCIB, the Trust proposes to purchase through the facilities of the TSX, from time to time, if it is considered advisable, up to 396,485 Preferred Securities and up to 396,485 Capital Units of the Trust, representing approximately 10% of the public float which is the same number as the Trust’s issued and outstanding Securities, being 3,964,850 Preferred Securities and 3,964,850 Capital Units as of the date hereof. The Trust will not purchase in any given 30-day period, in the aggregate, more than 79,297 Preferred Securities and 79,297 Capital Units, being 2% of the issued and outstanding Units as of the date hereof. Purchases of Units under the NCIB may commence on November 28, 2008. The Board of Directors of First Asset Funds Inc., the manager of the Trust, believes that such purchases are in the best interests of the Trust and are a desirable use of the Trust’s funds. All purchases will be made through the facilities of the TSX in accordance with its rules and policies. All Securities purchased by the Trust pursuant to the NCIB will not be cancelled and will be held for resale. The NCIB will expire on November 27, 2009.

On November 26, 2007, the Trust announced that it was making a Normal Course Issuer Bid, which commenced November 28, 2007, to purchase up to 461,420 Preferred Securities and up to 461,420 Capital Units through the facilities of the TSX. No Securities were repurchased under the bid, which expires on November 27, 2008.

UST.PR.A is not tracked by HIMIPref™.