Margin debt in the US is declining:
NYSE margin debt surged from $182 billion to $505 billion in the six years ended in June 2015, roughly tracing the trajectory of the S&P 500, which tripled over the period. The biggest gains came in 2013, with credit rising 35 percent as U.S. stocks climbed 30 percent for the best returns in 16 years.
Since June, it’s been the other way around, with margin debt falling 6.3 percent to $473 billion at the NYSE’s last update, which covered August. The S&P 500 slid 4.4 percent at the end of that period as stocks entered a correction.
I’ll need to be convinced that this means anything as a market-timing indicator, as is often proclaimed but I’ll accept it as a rough measure of retail sentiment. It interested me due to a BIS working paper by Fernando Avalos, Ramon Moreno and Tania Romero titled Leverage on the buy side:
This paper investigates the microeconomic determinants of leverage decisions by asset managers. Investment funds (the “buy side”) have significantly increased their share of global capital flows in recent years. Unconventional monetary policies in advanced economies have squeezed returns while reducing borrowing costs, which in principle creates an incentive for asset managers to use more leverage. We start by studying the recent behaviour of fund leverage in different asset categories at an aggregate level. Leverage appears to have increased significantly in funds focused on the fixed income markets of emerging economies. Then we analyse the microeconomic factors that shape the leverage decision. In line with theory, we find that leverage rises with expected returns, and falls with market risk and borrowing costs. Transaction costs are also mentioned in the literature as another factor that should inhibit leverage. Lacking the requisite data, we introduce as proxies changes in capital controls and macroprudential policies, because they tend to affect expected returns in comparable ways. We find that tighter capital controls on inflows increase leverage rather than decrease it, but that macroprudential measures have no discernible effect. Finally, we discuss these results and their policy implications.
…
Funds dedicated to global markets or advanced economies had little debt in their capital structure, whereas debt in leveraged EME fixed income funds was close to 30 percent of AUM towards the end of our sample period. The leverage ratio of EME fixed income funds surged after 2009 before falling abruptly back in 2014, although current levels are still much higher than before the surge. The number of funds using leverage is relatively small in our sample, but their size is about three times that of their unleveraged peers. They control more than 30 percent of AUM in their sector (down from 50 percent around 2010), making them quite significant players in their target markets.
Meanwhile Fed officials seem anxious to emphasize that their hesitation in hiking rates in September due to concerns over global risks (discussed yesterday) should not be taken as an indication of what will happen in the year’s remaining two FOMC meetings:
Federal Reserve Bank of Richmond President Jeffrey Lacker said the U.S. is already at full employment and the central bank may risk overheating the economy as it attempts to drive additional job gains.
With the unemployment rate at 5.1 percent, the central bank has achieved its goal and “exhausted relevant slack in the labor market,” the Richmond Fed chief said.
“We’re there,” Lacker said in an interview in his office Thursday, referring to the central bank’s mandate to lower joblessness to the level consistent with stable price pressures. The median forecast of that rate among Fed officials is 4.9 percent, according to estimates released following last month’s meeting of the policy-making Federal Open Market Committee.
“Pushing on to wring more slack out — there is some risks associated with that,” said Lacker. Inflation pressures may emerge with a lag, but the “risks can be very real.”
The Richmond Fed chief dissented at the FOMC’s September meeting, preferring a 0.25 percentage point increase in the federal funds rate.
And Dudley of the NY Fed provided supporting fire:
Federal Reserve Bank of New York President William C. Dudley said he expects the U.S. central bank to raise interest rates by December, echoing comments by fellow regional Fed chief Dennis Lockart in Atlanta, while cautioning that this was not a pledge to action and will depend on the economy staying on track.
Dudley told CNBC television in an interview Friday that he was still in the 2015 liftoff camp.
“Based on my forecast, yes I am, but it’s a forecast. And we’re going to get a lot of data between now and December,” he said. “It’s not a commitment.”
…
Last month’s FOMC decision, and a disappointing September U.S. employment report, has sapped investors’ confidence the Fed will be able to raise rates this year, as Fed Chair Janet Yellen has said she expects will be warranted. The probability of a 2015 hike is now priced around 40 percent in federal funds futures markets, compared to above 60 percent ahead of last month’s Fed meeting, based on the assumption that the effective fed funds rate will be 0.375 percent after liftoff.Dudley said the key to liftoff will be whether the labor market continues to improve, thereby putting more upward pressure on wages and inflation. Last month’s jobs report was “definitely weaker,” but even monthly gains of 120,000 or 150,000 are enough to continue to push the U.S. unemployment rate lower, he said.
Lockhart says the same:
Federal Reserve Bank of Atlanta President Dennis Lockhart said the first interest rate increase since 2006 will likely be warranted later this month or in December.
“The economy remains on a satisfactory track, and, speaking for myself, I see a liftoff decision later this year at the October or December FOMC meetings as likely appropriate,” Lockhart said in prepared remarks Friday in New York, referring to the Federal Open Market Committee.
…
“The ambiguity of the moment reinforces the need to closely watch the vital signs of the economy over the coming weeks to determine if the outlook has changed,” he said.Lockhart, who has never dissented, said consumer activity will be a key signal that the U.S. economy can sustain its momentum despite the global slowdown.
“The consumer-based dimension of the economy has been robust for several months,” Lockhart said to the Society of American Business Editors and Writers, even as manufacturing and exports have been hurt by a stronger U.S. dollar.
The Atlanta Fed’s tracking estimate for the third quarter is a “relatively soft 1.1 percent,” though much of the weakness is due to a swing in inventories.
Alan Kreuger of Princeton wrote an op-ed in the NYT advocating a $12 minimum wage:
I am frequently asked, “How high can the minimum wage go without jeopardizing employment of low-wage workers? And at what level would further minimum wage increases result in more job losses than wage gains, lowering the earnings of low-wage workers as a whole?”
Although available research cannot precisely answer these questions, I am confident that a federal minimum wage that rises to around $12 an hour over the next five years or so would not have a meaningful negative effect on United States employment. One reason for this judgment is that around 140 research projects commissioned by Britain’s independent Low Pay Commission have found that the minimum wage “has led to higher than average wage increases for the lowest paid, with little evidence of adverse effects on employment or the economy.” A $12-per-hour minimum wage in the United States phased in over several years would be in the same ballpark as Britain’s minimum wage today.
But $15 an hour is beyond international experience, and could well be counterproductive. Although some high-wage cities and states could probably absorb a $15-an-hour minimum wage with little or no job loss, it is far from clear that the same could be said for every state, city and town in the United States.
I think the emphasis on the redistributive effects of the minimum wage are misguided; we should not be asking how to maximize the minimum wage subject to avoiding job losses; but rather, how to increase the minimum wage in order to force higher productivity at the low end of the job scale. I’m not suggesting that all productivity gains in the economy should be reflected in the minimum wage – that’s obviously a ridiculous argument – but some of the gains can be enforced.
Brookfield Renewable Energy Partners L.P., proud indirect issuer of BRF.PR.A, BRF.PR.B, BRF.PR.C, BRF.PR.E and BRF.PR.F, has announced:
an agreement to acquire a hydroelectric portfolio in Pennsylvania from Talen Energy for $860 million. Brookfield Renewable will acquire and fund the transaction with institutional partners and maintain an economic interest in the portfolio of approximately 40 percent. A portion of the purchase price will be funded with third party investment grade, non-recourse financing expected to close concurrently with the transaction.
The portfolio consists of two facilities, the 252 MW Holtwood station on the Susquehanna River and the 40 MW Wallenpaupack station on Lake Wallenpaupack in the Pocono Mountains, with a combined expected average annual generation of approximately 1.1 million megawatt hours. The acquisition provides a strong fit with Brookfield Renewable’s 417 MW Safe Harbor facility located eight miles upstream from Holtwood. All output is currently sold into PJM and the portfolio benefits from a diverse revenue stream including energy, capacity, renewable energy credits and ancillary services. Both Holtwood and Wallenpaupack have long-term FERC operating licenses through 2030 and 2045, respectively.
DBRS comments:
DBRS Limited (DBRS) today notes that Brookfield Renewable Energy Partners L.P. (BREP or the Company, rated BBB (high)) has announced its acquisition of a 292-megawatt (MW) hydroelectric portfolio in Pennsylvania (the Acquisition). The Acquisition is not expected to have a material impact on BREP’s rating. DBRS views the Acquisition as modestly negative to BREP’s business risk assessment (BRA), as the generation output from the acquired assets (representing approximately 4% of total pro-forma generation) is exposed to the merchant power market. However, DBRS expects BREP to prudently finance the Acquisition in order to be in line with DBRS’s 20% deconsolidated debt-to-capital threshold and to maintain a financial risk assessment (FRA) that remains supportive of the current rating.
TransCanada also announced an acquisition:
TransCanada Corporation (TSX:TRP)(NYSE:TRP) (TransCanada) today announced that it has reached an agreement to acquire the Ironwood natural gas fired, combined cycle power plant in Lebanon, Pennsylvania, with a nameplate capacity of 778 megawatts (MW), from Talen Energy Corporation (NYSE:TLN) for US$654 million. At closing, US$42 million in debt will be assumed and then repaid within 45 days of closing out of funds placed into escrow by the seller.
“This acquisition presents a unique opportunity in the current market environment and is a natural extension of our U.S. northeast power business, strengthening our overall portfolio of assets in the region,” said Russ Girling, TransCanada’s president and chief executive officer. “This relatively new and highly efficient gas-fired power plant provides us with a solid platform from which to continue to grow our already substantial wholesale, commercial and industrial customer base in this market area.”
Sure beats trying to promote Keystone! Jim Polson and Rebecca Penty of Bloomberg comment:
Companies from the Great White North are attracted by fast-growing power demand in parts of the U.S. and a regulatory model that allows bigger profits for utility monopolies. Their purchases are propping up sale values of U.S. independent producers amid a slowdown in the sector, according to UBS Securities LLC.
…
Canadian energy companies, pension funds and private equity firms are also more willing than U.S. utility owners to bank on the volatile earnings from power plants that sell into U.S. wholesale markets, said Kit Konolige, senior utility analyst for Bloomberg Intelligence. TransCanada and Brookfield bought so-called merchant plants that had been owned by PPL Corp. before it spun off Talen Energy Corp. in June to focus on more predictable utility businesses.And it’s not just power that Canadians are after. They’re also buying up U.S. oil and natural gas properties. Canada Pension Plan Investment Board, the country’s largest pension fund, said Thursday it isn’t done shopping for energy assets after committing almost $2 billion to the industry in the last two weeks. That includes a purchase announced Thursday of oil and gas producing properties in Colorado from Encana Corp.
Talen extracted “top dollar” for its deals this week, UBS analysts led by Julien Dumoulin-Smith wrote in a note.
So there’s lots of capital leaving Canada to buy power plants in the States. One has to wonder whether a more business-friendly regulatory environment would allow further increases in electricity exports while keeping the bucks and jobs up here:
U.S. electricity trade with Canada is increasing, providing more economic and reliability benefits to both the United States and Canada. Although the amount of electricity imported over the Canadian border is a small part of the overall U.S. power supply, the transmission connections linking Canada and the United States are an important component of the electricity markets in northern states.
Overall, Canada is a net exporter of electricity to the United States, and most of its power needs are met by hydroelectricity. Large hydroelectric projects in British Columbia, Manitoba, Quebec, and Newfoundland and Labrador have significantly increased the country’s generation capacity. On a net basis, Canada exports electricity mainly to New England, New York, and the Midwest states, while the United States exports electricity primarily from the Pacific Northwest states to the Canadian province of British Columbia.
As everybody knows, my company uses proprietary software (HIMIPref™) to examine the market for trade opportunities. Recently, PrefBlog’s corporate espionage department obtained information regarding hardware used for a similar purpose by other preferred share investors:

Click for Big
It was another hideous day for the Canadian preferred share market, with PerpetualDiscounts off 24bp, FixedResets losing 96bp and DeemedRetractibles down 29bp; the YTW on FixedResets is, incredibly, edging closer to the 5.00% mark. The Performance Highlights table is, of course, lengthy, with three MFC issues notable losers. Volume was well above average.
For as long as the FixedReset market is so violently unsettled, I’ll keep publishing updates of the more interesting and meaningful series of FixedResets’ Implied Volatilities. This doesn’t include Enbridge because although Enbridge has a large number of issues outstanding, all of which are quite liquid, the range of Issue Reset Spreads is too small for decent conclusions. The low is 212bp (ENB.PR.H; second-lowest is ENB.PR.D at 237bp) and the high is a mere 268 for ENB.PF.G.
Remember that all rich /cheap assessments are:
» based on Implied Volatility Theory only
» are relative only to other FixedResets from the same issuer
» assume constant GOC-5 yield
» assume constant Implied Volatility
» assume constant spread
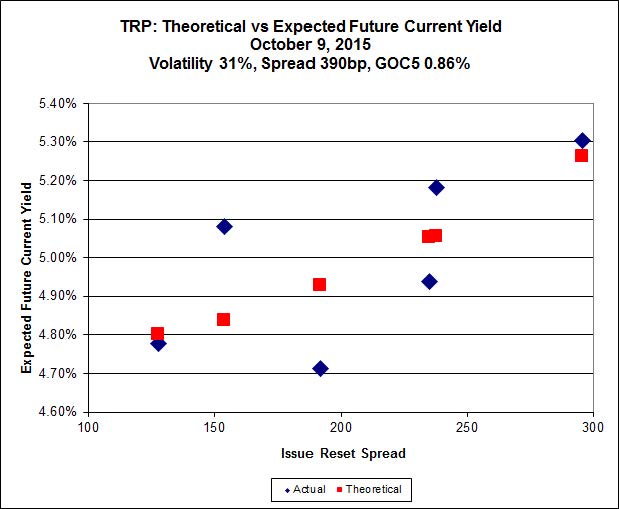
Here’s TRP:
Click for Big
Implied Volatility remained ridiculous.
TRP.PR.A, which resets 2019-12-31 at +192, is bid at 14.75 to be $0.65 rich, while TRP.PR.C, resetting 2016-1-30 at +154, is $0.59 cheap at its bid price of 11.81.
Click for Big
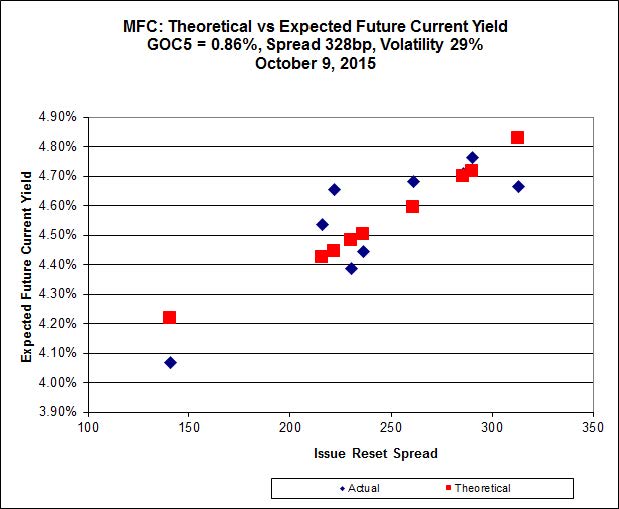
The fit deteriorated today for MFC, with Implied Volatility plummeting; this isn’t really surprising, given the large losses experienced by the three MFC issues at the extreme bad end of the Performance Highlights table.
Most expensive is MFC.PR.H, resetting at +313bp on 2017-3-19, bid at 21.38 to be 0.71 rich, while MFC.PR.K resetting at +222bp on 2018-9-19, is bid at 16.55 to be 0.78 cheap.
Click for Big
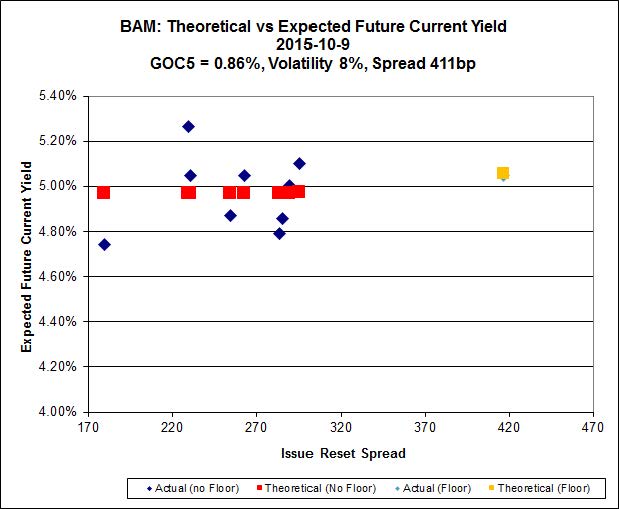
The fit on the BAM issues continues to be horrible!
The cheapest issue relative to its peers is BAM.PR.R, resetting at +230bp on 2016-6-30, bid at 15.00 to be $0.90 cheap. BAM.PF.G, resetting at +284bp on 2020-6-30 is bid at 19.30 and appears to be $0.69 rich.

Click for Big
Implied Volatility jumped today and is ridiculously high.
FTS.PR.K, with a spread of +205bp, and bid at 16.81, looks $0.36 expensive and resets 2019-3-1. FTS.PR.G, with a spread of +213bp and resetting 2018-9-1, is bid at 16.49 and is $0.30 cheap.

Click for Big
Investment-grade pairs predict an average three-month bill yield over the next five-odd years of -0.99%, with two outliers above 0.00% and two below -2.00%. The distribution is bimodal, with bank NVCC non-compliant pairs averaging -1.51% and other issues averaging -0.26%. There are three junk outliers above 0.00%.
Click for Big
Shall we just say that this exhibits a high level of confidence in the continued rapacity of Canadian banks?
| HIMIPref™ Preferred Indices These values reflect the December 2008 revision of the HIMIPref™ Indices Values are provisional and are finalized monthly |
|||||||
| Index | Mean Current Yield (at bid) |
Median YTW |
Median Average Trading Value |
Median Mod Dur (YTW) |
Issues | Day’s Perf. | Index Value |
| Ratchet | 0.00 % | 0.00 % | 0 | 0.00 | 0 | 0.5992 % | 1,583.6 |
| FixedFloater | 0.00 % | 0.00 % | 0 | 0.00 | 0 | 0.5992 % | 2,768.9 |
| Floater | 4.69 % | 4.72 % | 62,933 | 16.04 | 3 | 0.5992 % | 1,683.5 |
| OpRet | 0.00 % | 0.00 % | 0 | 0.00 | 0 | 0.0526 % | 2,764.0 |
| SplitShare | 4.34 % | 5.07 % | 72,442 | 3.00 | 5 | 0.0526 % | 3,239.3 |
| Interest-Bearing | 0.00 % | 0.00 % | 0 | 0.00 | 0 | 0.0526 % | 2,527.4 |
| Perpetual-Premium | 5.95 % | 5.90 % | 59,045 | 14.00 | 5 | -0.3955 % | 2,448.5 |
| Perpetual-Discount | 5.76 % | 5.84 % | 78,228 | 14.16 | 33 | -0.2373 % | 2,472.5 |
| FixedReset | 5.36 % | 4.95 % | 196,608 | 14.88 | 76 | -0.9550 % | 1,903.2 |
| Deemed-Retractible | 5.34 % | 5.38 % | 101,730 | 5.47 | 33 | -0.2883 % | 2,494.3 |
| FloatingReset | 2.66 % | 4.75 % | 63,342 | 5.83 | 9 | 0.1447 % | 2,046.3 |
| Performance Highlights | |||
| Issue | Index | Change | Notes |
| MFC.PR.K | FixedReset | -6.87 % | Not entirely real, but the issue did indeed have a bad day! It traded 33,613 shares in a range of 16.81-17.83, but it appears that the bid simply vanished shortly before the close, with 100 shares trading at 17.02 at 3:40; the next trade was 100 shares, 16.83, 3:53; and the final trade 100 shares, 16.81, 3:53. This issue also made the volume highlights, with RBC buying 19,800 from Scotia at 17.75, timestamped 11:35. YTW SCENARIO Maturity Type : Hard Maturity Maturity Date : 2025-01-31 Maturity Price : 25.00 Evaluated at bid price : 16.55 Bid-YTW : 8.82 % |
| MFC.PR.L | FixedReset | -6.51 % | Real enough! The issue traded 20,593 shares in a range of 16.70-17.77 before closing at 16.65-00. The day ended with two trade bursts; one set, timestamped 3:33-3:34, totalled 2900 shares in nine trades, starting at 17.00 and ending at 16.97; but 1300 of these shares traded at 16.78. The second set, timestamped 3:53-3:54, totalled 1500 shares in seven trades, starting at 16.78 and ending at 16.70. YTW SCENARIO Maturity Type : Hard Maturity Maturity Date : 2025-01-31 Maturity Price : 25.00 Evaluated at bid price : 16.65 Bid-YTW : 8.85 % |
| MFC.PR.M | FixedReset | -4.78 % | YTW SCENARIO Maturity Type : Hard Maturity Maturity Date : 2025-01-31 Maturity Price : 25.00 Evaluated at bid price : 18.11 Bid-YTW : 7.87 % |
| RY.PR.J | FixedReset | -4.51 % | YTW SCENARIO Maturity Type : Limit Maturity Maturity Date : 2045-10-09 Maturity Price : 18.42 Evaluated at bid price : 18.42 Bid-YTW : 4.96 % |
| BAM.PR.T | FixedReset | -4.38 % | YTW SCENARIO Maturity Type : Limit Maturity Maturity Date : 2045-10-09 Maturity Price : 15.70 Evaluated at bid price : 15.70 Bid-YTW : 5.29 % |
| PWF.PR.T | FixedReset | -4.06 % | YTW SCENARIO Maturity Type : Limit Maturity Maturity Date : 2045-10-09 Maturity Price : 19.60 Evaluated at bid price : 19.60 Bid-YTW : 4.34 % |
| MFC.PR.N | FixedReset | -3.74 % | YTW SCENARIO Maturity Type : Hard Maturity Maturity Date : 2025-01-31 Maturity Price : 25.00 Evaluated at bid price : 18.01 Bid-YTW : 7.87 % |
| BMO.PR.T | FixedReset | -3.74 % | YTW SCENARIO Maturity Type : Limit Maturity Maturity Date : 2045-10-09 Maturity Price : 17.52 Evaluated at bid price : 17.52 Bid-YTW : 4.73 % |
| TD.PF.D | FixedReset | -3.30 % | YTW SCENARIO Maturity Type : Limit Maturity Maturity Date : 2045-10-09 Maturity Price : 18.73 Evaluated at bid price : 18.73 Bid-YTW : 4.86 % |
| RY.PR.Z | FixedReset | -3.30 % | YTW SCENARIO Maturity Type : Limit Maturity Maturity Date : 2045-10-09 Maturity Price : 18.18 Evaluated at bid price : 18.18 Bid-YTW : 4.53 % |
| SLF.PR.H | FixedReset | -3.03 % | YTW SCENARIO Maturity Type : Hard Maturity Maturity Date : 2025-01-31 Maturity Price : 25.00 Evaluated at bid price : 16.00 Bid-YTW : 8.96 % |
| RY.PR.H | FixedReset | -2.99 % | YTW SCENARIO Maturity Type : Limit Maturity Maturity Date : 2045-10-09 Maturity Price : 18.14 Evaluated at bid price : 18.14 Bid-YTW : 4.59 % |
| BMO.PR.W | FixedReset | -2.73 % | YTW SCENARIO Maturity Type : Limit Maturity Maturity Date : 2045-10-09 Maturity Price : 17.49 Evaluated at bid price : 17.49 Bid-YTW : 4.70 % |
| CM.PR.Q | FixedReset | -2.68 % | YTW SCENARIO Maturity Type : Limit Maturity Maturity Date : 2045-10-09 Maturity Price : 19.27 Evaluated at bid price : 19.27 Bid-YTW : 4.73 % |
| RY.PR.M | FixedReset | -2.67 % | YTW SCENARIO Maturity Type : Limit Maturity Maturity Date : 2045-10-09 Maturity Price : 18.25 Evaluated at bid price : 18.25 Bid-YTW : 4.88 % |
| CM.PR.O | FixedReset | -2.65 % | YTW SCENARIO Maturity Type : Limit Maturity Maturity Date : 2045-10-09 Maturity Price : 18.02 Evaluated at bid price : 18.02 Bid-YTW : 4.64 % |
| TD.PF.E | FixedReset | -2.45 % | YTW SCENARIO Maturity Type : Limit Maturity Maturity Date : 2045-10-09 Maturity Price : 19.52 Evaluated at bid price : 19.52 Bid-YTW : 4.78 % |
| PWF.PR.P | FixedReset | -2.29 % | YTW SCENARIO Maturity Type : Limit Maturity Maturity Date : 2045-10-09 Maturity Price : 13.68 Evaluated at bid price : 13.68 Bid-YTW : 4.51 % |
| NA.PR.S | FixedReset | -2.21 % | YTW SCENARIO Maturity Type : Limit Maturity Maturity Date : 2045-10-09 Maturity Price : 17.66 Evaluated at bid price : 17.66 Bid-YTW : 4.84 % |
| SLF.PR.G | FixedReset | -2.07 % | YTW SCENARIO Maturity Type : Hard Maturity Maturity Date : 2025-01-31 Maturity Price : 25.00 Evaluated at bid price : 14.20 Bid-YTW : 9.36 % |
| TD.PF.B | FixedReset | -2.03 % | YTW SCENARIO Maturity Type : Limit Maturity Maturity Date : 2045-10-09 Maturity Price : 17.85 Evaluated at bid price : 17.85 Bid-YTW : 4.58 % |
| CU.PR.H | Perpetual-Discount | -1.96 % | YTW SCENARIO Maturity Type : Limit Maturity Maturity Date : 2045-10-09 Maturity Price : 22.19 Evaluated at bid price : 22.55 Bid-YTW : 5.91 % |
| TD.PF.A | FixedReset | -1.92 % | YTW SCENARIO Maturity Type : Limit Maturity Maturity Date : 2045-10-09 Maturity Price : 17.85 Evaluated at bid price : 17.85 Bid-YTW : 4.59 % |
| TD.PF.C | FixedReset | -1.90 % | YTW SCENARIO Maturity Type : Limit Maturity Maturity Date : 2045-10-09 Maturity Price : 17.51 Evaluated at bid price : 17.51 Bid-YTW : 4.66 % |
| RY.PR.N | Perpetual-Discount | -1.67 % | YTW SCENARIO Maturity Type : Limit Maturity Maturity Date : 2045-10-09 Maturity Price : 22.04 Evaluated at bid price : 22.36 Bid-YTW : 5.63 % |
| BMO.PR.S | FixedReset | -1.60 % | YTW SCENARIO Maturity Type : Limit Maturity Maturity Date : 2045-10-09 Maturity Price : 18.50 Evaluated at bid price : 18.50 Bid-YTW : 4.59 % |
| PWF.PR.K | Perpetual-Discount | -1.39 % | YTW SCENARIO Maturity Type : Limit Maturity Maturity Date : 2045-10-09 Maturity Price : 21.25 Evaluated at bid price : 21.25 Bid-YTW : 5.84 % |
| HSE.PR.G | FixedReset | -1.29 % | YTW SCENARIO Maturity Type : Limit Maturity Maturity Date : 2045-10-09 Maturity Price : 21.83 Evaluated at bid price : 22.26 Bid-YTW : 4.99 % |
| FTS.PR.G | FixedReset | -1.26 % | YTW SCENARIO Maturity Type : Limit Maturity Maturity Date : 2045-10-09 Maturity Price : 16.49 Evaluated at bid price : 16.49 Bid-YTW : 4.81 % |
| CM.PR.P | FixedReset | -1.24 % | YTW SCENARIO Maturity Type : Limit Maturity Maturity Date : 2045-10-09 Maturity Price : 17.50 Evaluated at bid price : 17.50 Bid-YTW : 4.66 % |
| TRP.PR.D | FixedReset | -1.20 % | YTW SCENARIO Maturity Type : Limit Maturity Maturity Date : 2045-10-09 Maturity Price : 15.63 Evaluated at bid price : 15.63 Bid-YTW : 5.44 % |
| BAM.PR.N | Perpetual-Discount | -1.19 % | YTW SCENARIO Maturity Type : Limit Maturity Maturity Date : 2045-10-09 Maturity Price : 19.88 Evaluated at bid price : 19.88 Bid-YTW : 6.03 % |
| BMO.PR.Y | FixedReset | -1.19 % | YTW SCENARIO Maturity Type : Limit Maturity Maturity Date : 2045-10-09 Maturity Price : 19.08 Evaluated at bid price : 19.08 Bid-YTW : 4.90 % |
| GWO.PR.R | Deemed-Retractible | -1.19 % | YTW SCENARIO Maturity Type : Hard Maturity Maturity Date : 2025-01-31 Maturity Price : 25.00 Evaluated at bid price : 20.80 Bid-YTW : 7.39 % |
| RY.PR.W | Perpetual-Discount | -1.18 % | YTW SCENARIO Maturity Type : Limit Maturity Maturity Date : 2045-10-09 Maturity Price : 22.40 Evaluated at bid price : 22.66 Bid-YTW : 5.47 % |
| SLF.PR.J | FloatingReset | -1.17 % | YTW SCENARIO Maturity Type : Hard Maturity Maturity Date : 2025-01-31 Maturity Price : 25.00 Evaluated at bid price : 12.65 Bid-YTW : 10.14 % |
| IFC.PR.A | FixedReset | -1.17 % | YTW SCENARIO Maturity Type : Hard Maturity Maturity Date : 2025-01-31 Maturity Price : 25.00 Evaluated at bid price : 15.22 Bid-YTW : 9.62 % |
| BMO.PR.R | FloatingReset | -1.10 % | YTW SCENARIO Maturity Type : Hard Maturity Maturity Date : 2022-01-31 Maturity Price : 25.00 Evaluated at bid price : 21.50 Bid-YTW : 4.63 % |
| MFC.PR.B | Deemed-Retractible | -1.08 % | YTW SCENARIO Maturity Type : Hard Maturity Maturity Date : 2025-01-31 Maturity Price : 25.00 Evaluated at bid price : 20.18 Bid-YTW : 7.67 % |
| RY.PR.P | Perpetual-Discount | -1.04 % | YTW SCENARIO Maturity Type : Limit Maturity Maturity Date : 2045-10-09 Maturity Price : 23.40 Evaluated at bid price : 23.70 Bid-YTW : 5.57 % |
| RY.PR.O | Perpetual-Discount | -1.02 % | YTW SCENARIO Maturity Type : Limit Maturity Maturity Date : 2045-10-09 Maturity Price : 22.00 Evaluated at bid price : 22.30 Bid-YTW : 5.60 % |
| RY.PR.C | Deemed-Retractible | -1.01 % | YTW SCENARIO Maturity Type : Hard Maturity Maturity Date : 2022-01-31 Maturity Price : 25.00 Evaluated at bid price : 24.55 Bid-YTW : 5.07 % |
| FTS.PR.H | FixedReset | 1.09 % | YTW SCENARIO Maturity Type : Limit Maturity Maturity Date : 2045-10-09 Maturity Price : 13.85 Evaluated at bid price : 13.85 Bid-YTW : 4.30 % |
| BAM.PF.G | FixedReset | 1.15 % | YTW SCENARIO Maturity Type : Limit Maturity Maturity Date : 2045-10-09 Maturity Price : 19.30 Evaluated at bid price : 19.30 Bid-YTW : 5.10 % |
| TRP.PR.E | FixedReset | 1.31 % | YTW SCENARIO Maturity Type : Limit Maturity Maturity Date : 2045-10-09 Maturity Price : 16.25 Evaluated at bid price : 16.25 Bid-YTW : 5.32 % |
| MFC.PR.J | FixedReset | 1.31 % | YTW SCENARIO Maturity Type : Hard Maturity Maturity Date : 2025-01-31 Maturity Price : 25.00 Evaluated at bid price : 18.53 Bid-YTW : 7.64 % |
| TRP.PR.A | FixedReset | 1.37 % | YTW SCENARIO Maturity Type : Limit Maturity Maturity Date : 2045-10-09 Maturity Price : 14.75 Evaluated at bid price : 14.75 Bid-YTW : 4.95 % |
| POW.PR.A | Perpetual-Discount | 1.53 % | YTW SCENARIO Maturity Type : Limit Maturity Maturity Date : 2045-10-09 Maturity Price : 23.59 Evaluated at bid price : 23.86 Bid-YTW : 5.89 % |
| MFC.PR.H | FixedReset | 1.57 % | YTW SCENARIO Maturity Type : Hard Maturity Maturity Date : 2025-01-31 Maturity Price : 25.00 Evaluated at bid price : 21.38 Bid-YTW : 6.24 % |
| BAM.PF.F | FixedReset | 1.59 % | YTW SCENARIO Maturity Type : Limit Maturity Maturity Date : 2045-10-09 Maturity Price : 19.15 Evaluated at bid price : 19.15 Bid-YTW : 5.12 % |
| GWO.PR.N | FixedReset | 1.82 % | YTW SCENARIO Maturity Type : Hard Maturity Maturity Date : 2025-01-31 Maturity Price : 25.00 Evaluated at bid price : 14.00 Bid-YTW : 9.48 % |
| BAM.PF.A | FixedReset | 2.01 % | YTW SCENARIO Maturity Type : Limit Maturity Maturity Date : 2045-10-09 Maturity Price : 18.79 Evaluated at bid price : 18.79 Bid-YTW : 5.21 % |
| BMO.PR.M | FixedReset | 2.13 % | YTW SCENARIO Maturity Type : Hard Maturity Maturity Date : 2022-01-31 Maturity Price : 25.00 Evaluated at bid price : 24.00 Bid-YTW : 3.73 % |
| TD.PR.T | FloatingReset | 2.59 % | YTW SCENARIO Maturity Type : Hard Maturity Maturity Date : 2022-01-31 Maturity Price : 25.00 Evaluated at bid price : 21.40 Bid-YTW : 4.56 % |
| Volume Highlights | |||
| Issue | Index | Shares Traded |
Notes |
| RY.PR.J | FixedReset | 63,708 | TD bought 10,900 from RBC at 19.00. YTW SCENARIO Maturity Type : Limit Maturity Maturity Date : 2045-10-09 Maturity Price : 18.42 Evaluated at bid price : 18.42 Bid-YTW : 4.96 % |
| BAM.PF.H | FixedReset | 63,340 | Recent new issue. YTW SCENARIO Maturity Type : Limit Maturity Maturity Date : 2045-10-09 Maturity Price : 23.12 Evaluated at bid price : 24.92 Bid-YTW : 4.97 % |
| CM.PR.Q | FixedReset | 46,975 | TD crossed 10,000 at 19.75. YTW SCENARIO Maturity Type : Limit Maturity Maturity Date : 2045-10-09 Maturity Price : 19.27 Evaluated at bid price : 19.27 Bid-YTW : 4.73 % |
| BAM.PF.A | FixedReset | 35,504 | YTW SCENARIO Maturity Type : Limit Maturity Maturity Date : 2045-10-09 Maturity Price : 18.79 Evaluated at bid price : 18.79 Bid-YTW : 5.21 % |
| RY.PR.P | Perpetual-Discount | 34,438 | Recent new issue. YTW SCENARIO Maturity Type : Limit Maturity Maturity Date : 2045-10-09 Maturity Price : 23.40 Evaluated at bid price : 23.70 Bid-YTW : 5.57 % |
| MFC.PR.K | FixedReset | 33,613 | RBC bought 19,800 from Scotia at 19,800. YTW SCENARIO Maturity Type : Hard Maturity Maturity Date : 2025-01-31 Maturity Price : 25.00 Evaluated at bid price : 16.55 Bid-YTW : 8.82 % |
| There were 45 other index-included issues trading in excess of 10,000 shares. | |||
| Wide Spread Highlights | ||
| Issue | Index | Quote Data and Yield Notes |
| BAM.PR.C | Floater | Quote: 10.00 – 11.49 Spot Rate : 1.4900 Average : 0.8503 YTW SCENARIO |
| RY.PR.J | FixedReset | Quote: 18.42 – 18.90 Spot Rate : 0.4800 Average : 0.2762 YTW SCENARIO |
| MFC.PR.H | FixedReset | Quote: 21.38 – 21.99 Spot Rate : 0.6100 Average : 0.4179 YTW SCENARIO |
| RY.PR.H | FixedReset | Quote: 18.14 – 18.68 Spot Rate : 0.5400 Average : 0.3497 YTW SCENARIO |
| BNS.PR.C | FloatingReset | Quote: 21.26 – 21.84 Spot Rate : 0.5800 Average : 0.3931 YTW SCENARIO |
| TRP.PR.E | FixedReset | Quote: 16.25 – 17.00 Spot Rate : 0.7500 Average : 0.5922 YTW SCENARIO |
Perhaps you are aware of the fact that Interactive Brokers Canada allows the shorting of some Preferred shares. This has only recently come to my attention when purchasing some Enbridge $US prefs. I also confirmed that quite a few of the $CAD prefs were available for shorting. Possibly this is the reason prefs are trading at such low prices. My Canadian broker does not offer prefs for shorting perhaps because of the very unfavourable tax treatment?
Obviously there is plenty to be confused about in the preferred share market right now. Thus, it seems unfair to single out the BCE floating issues, but it seems like a good spot to start. It doesn’t seem right that they are within spitting distance of the low they put in during the financial crisis. Corporate yields are way below 2008 levels and based on BCE long term bond yields, the market doesn’t appear to be worried about BCE in particular.
It is strange to me that a retail investor could borrow at prime or better (tax deductable) to buy BCE floating shares that pay prime+2.25% (tax advantaged). The banks can’t even get this kind of margin.
The only plausible explanations that I can come up with are:
1) Preferred share investors are running for the hills and they would like to stop losing money. They are not currently concerned whether an investment has a good income profile.
2) Taking their cues from the T-Bill rate implied by the T-Bill indexed floaters with their pairs, the holders of BCE’s Prime indexed floaters are expecting a similar or even larger decrease in the banks’ prime lending rate. However, even if prime goes to 2%, you’d still be making approximately prime + 1.6% on the above mentioned investment. Prime below 2% doesn’t seem all that likely to me.
James, what do you see as a likely floor for “prime”? Also, do you see any other factors influencing the current price level of the BCE floaters?
Hi James & al,
Very interesting comments from GAndreone & LD such that I look forward reading James with his replies to those.
On my end, my only “explanation” for the general sell off in the prefs is, and I wonder if James could confirm or infirm that, that there must be a sufficiently large quantity of prefs held by prefs mutual funds / ETFs and/or pension funds to have them toppling the market when the holders of such mutual funds / ETFs or managers of such pension funds realise that they were wrong in their belief of holding an investment with a fairly constant capital value and return.
Their (ours I should say as I don’t think anyone saw it coming) mistake was that no one fully appreciated in 2009-2012, when the bulk of the fix reset came on the market, with many of those with increments below 200 bps in their reset formula) that GOC rates could go that much lower by the time most of these fix reset would reset their rate. As a result, the water bath is being thrown out with the good chuby babies in it (i.e. the floaters, the non-banking resetable and perps). I would think this mostly happens because of the low liquidity of prefs in general and the fact that when one does sell his units in his prefs mutual fund or etf, the managers of those must (or do it out of lack of understanding) sell in turn the pref constituents of their funds / ETFs in a general way to maintain the respective ratios of the holding of the fund / ETF under management. In other words, if I manage an ETF made of prefs and I have an outflow of 1 billion from my holder units out of this ETF, I must sell a value worth of 1 billion in the constituing prefs of my funds on a prorata basis of each issues consituting its holdings (that is, including those whould should not be hammered by the current market conditions).
If the above makes sense (and I am full of doubts here), my question for James is thus whether we can track the relative value / outflow from these “market makers robots” who just have to sell because they have to, irrespective of the objective values of what they are selling. In other words, if it is indeed significant as I believe it is, I wish I could know when the net outlflow / inflow in cash in “prefs weapons of mass capital destruction or gain” (i.e prefs mutual funds / ETF and pension funds) will have stabilized.
To LD
The BCE floaters are even more illogical because , in most cases, you can buy the other member of the pair at a lower price than the prime rate floater, enjoy the higher coupon for a year and then convert to the prime rate floater. These prices would only be logical if the market was expecting the prime to raise significantly but your hypothesis number 2 is that the market expects the rates to go down further……
I don’t know if a lot of people are buying these floaters on margin, but at these prices, it looks like an easy way to make money on the spread if you believe BCE is of good enough credit quality….
Clearly this market is perplexing…..
At what point will companies themselves step in and scoop up a portion and eliminate future obligations. There also might be balance sheet and credit rating benefits. Why by up common when prefs are cheaper?
It looks as if James is taking a well deserved break eating turkey on this Thanksgiving long weekend. Hopefully, he will be pleased to see renewed attention from his assiduous readers. This might also be a sign that prefholders are nearing their “puke” point (supposed to be a sign of bottoming for those who believe in “technical astrology”… Sorry I meant by that “technical analysis).
Regarding BarleyandHops above query and as reported by James in prior posts, BAM, FFH and I think another (if I recall correctly) have recently launched and, in some cases, in fact acted upon buying back some of their preferreds stocks for cancellation. What I had observed with BAM’s recent repurchase program is that, due to the low volume of prefs and the rules for private share buybacks, it might be very costly and lengthy to put in gear the process of buying back pref stocks for their cancellation. No doubts, James is the one who should be able to enlighten us further on that but my feeling is that there might just not be enough savings in play for an issuer to buyback on the retail market and cancel prefs.
Hi Everyone – I’m new to investing in preferred shares and have found this site to be very informative. I understand the distributions on rate-resets will be adjusted lower and that will affect an ETF such as CPD, but I also read in the news now that the selling is overdone. Does an ETF such as CPD make sense as an investment at this time? I don’t believe rates will be this low for the ~ 30 year time horizon I have so the chance of capital gains with eventual rising rates (over 30 years) coupled with monthly distributions makes this asset class enticing to me. I’m looking for confirmation that my opinion makes sense, rates will likely rise over 30 years and preferreds belong in my portfolio. Does anyone have a differing opinion or advice on ownership of preferreds? I appreciate any response!
Hello All – long time reader of this blog, but I seldom comment – thought I might throw my 2 cents on a number of the above points into the mix – all just IMHO of course.
If issuers get serious about retiring issues at these levels we’d likely start to see open tender / buyback offers – this may not be that likely though as recent issuance has demanded higher yields.
As noted, prefs are shortable (like almost any security) but they are typically expensive to borrow – short individual names is essentially double short carry (-7-10%) – they are too expensive and illiquid for institutional short players to get aggressive. The etfs do provide a viable option (still not cheap though).
I think its interesting that the leaders to the downside in late Sept (pre BMO issue) were the major financial fixed-resets – interesting because they are liquid enough, with high enough ratings, to have found their way into some institutional (non-pref-specialist) portfolios. Coupled with the timing (quarter end, days after FOMC, plus October is many a financial firm year end) and the large unbalanced block rotations between the etfs – it smells like an institutional player, or perhaps wealth manager, was aggressively rotating out of prefs. It could also explain some of the price action as the etf market makers would not fire market orders deep through the book.
Given this year in prefs, I don’t think it’d be too surprising to see some more aggressive rotations (both in and out) through year end.
I’d enjoy any opinions James, or anyone else, might lend to these.
Oh dear by vs buy. Apologies for that.
Observations from my view, today the 13th . Volume was okay but notably larger interest on the buy side. Maybe we have seen and are seeing a rotation from retail to other. Is this margin/loan closing out positions? A run for the gates as it were.
MFC (F/M) have had a good deal of difficulty in finding a floor. Seeing SLF.PR.J finding some upside is nice.
RY.PR.W is confusing.
Possibly this is the reason prefs are trading at such low prices. My Canadian broker does not offer prefs for shorting perhaps because of the very unfavourable tax treatment?
The tax treatment of having to pay short dividends was addressed in the post Shorting Prefs: Part 2 (for those who came in late). Note that this tax treatment will not apply to investors who are not taxable in Canada, e.g., pension funds and foreigners.
It’s always tempting to blame the shorts for market (I’ve seen comment boards where basically every tick downwards is blamed on evil shorts and their bankers), but I’d need a lot of convincing before I agreed with you. There’s a short position report available from the Exchange but I’ve never purchased it because I don’t know how I would use it.
Even if I did buy one and saw all kinds of huge shorts, how do I know it’s not a market maker who’s long CPD and ZPR on the other side?
It is strange to me that a retail investor could borrow at prime or better (tax deductable) to buy BCE floating shares that pay prime+2.25% (tax advantaged).
True enough, but the risk is that the bank pulls your funding. This is not too likely for modest borrowing on a home-equity line of credit, but could happen. And then there are margin calls, either explicit or otherwise.
Remember that any prime loan that a retail investor can get from a bank will be callable … without notice. So, strictly speaking, they have a term of one day, while the BCE RatchetRate preferreds are perpetual, which is not just a term mismatch, it’s the longest one mathematically possible!
What if you lose your job and the next day the bank calls you to update your credit profile?
While there’s nothing really wrong with the way you frame your example, I would rather cast it in terms of ‘why do people buy X when Y is available’. But perhaps that’s a matter of taste.
James, what do you see as a likely floor for “prime”?
Holy smokes, that’s a tough one. Maybe 2.50%? That would be one more cut from the BoC, partially matched by the banks, but they’ve been strenuously resisting cutting prime further because they have to cover their labour and other costs.
But, of course, the beauty of market commentary is that now matter how bad a scenario one describes for the economic environment, somebody can always describe a worse one and decry your recklessness.
Also, do you see any other factors influencing the current price level of the BCE floaters?
Nope. Basically, as happened during the Credit Crunch (and to at least some extent is also happening with FixedResets right now) we are seeing the results of issues paying variable dividends based on short rates while competing for investment dollars with fixed rate issues. During the Crunch, this resulted in Floating Rate shares having a ZERO total return when measured over FIFTEEN years, which puts today’s problems into perspective a little!
On my end, my only “explanation” for the general sell off in the prefs is, and I wonder if James could confirm or infirm that,a sufficiently large quantity of prefs held by prefs mutual funds / ETFs and/or pension funds to have them toppling the market when the holders of such mutual funds / ETFs or managers of such pension funds realise that they were wrong in their belief of holding an investment with a fairly constant capital value and return.
Well, it’s possible! I’m not sure how meaningful it is though; it’s only one layer removed from the direct holding of preferreds. The assumption of constant return started crumbling last December with the TRP.PR.A reset and the assumption of constant value has been crumbling ever since.
For this sort of ‘unsophisticated investor’ argument, I would prefer the twin explanations of fatigue (it’s not fun seeing nine months of heavy losses in your ‘safe’ investment) and quarter-end window dressing … although that one seems to have been at least partially disproved by the fact that losses in October are mounting daily!
A third possible explanation is ‘tax-loss selling’ … I was talking to a broker last week who is planning to start his crystallization strategy now, in October, to avoid the rush. He’s one of the good ones – he’ll just be swapping between issues – but there are lots of bad ones out there!
As a result, the water bath is being thrown out with the good chuby babies in it (i.e. the floaters, the non-banking resetable and perps).
To me, they’re all good chubby babies! Like the male codfish with his thousand offspring, I love them all equally.
However, subscribers to PrefLetter will be aware that the spread between FixedResets and Straights has been narrowing substantially for quite some time. This suggests the possibility that some investors are selling FixedResets to purchase Straights; I know that several actively managed preferred funds have been doing just that, making a market-timing bet on deflation, or at least a lengthy period of low government yields.
The BCE floaters are even more illogical because , in most cases, you can buy the other member of the pair at a lower price than the prime rate floater, enjoy the higher coupon for a year and then convert to the prime rate floater. These prices would only be logical if the market was expecting the prime to raise significantly
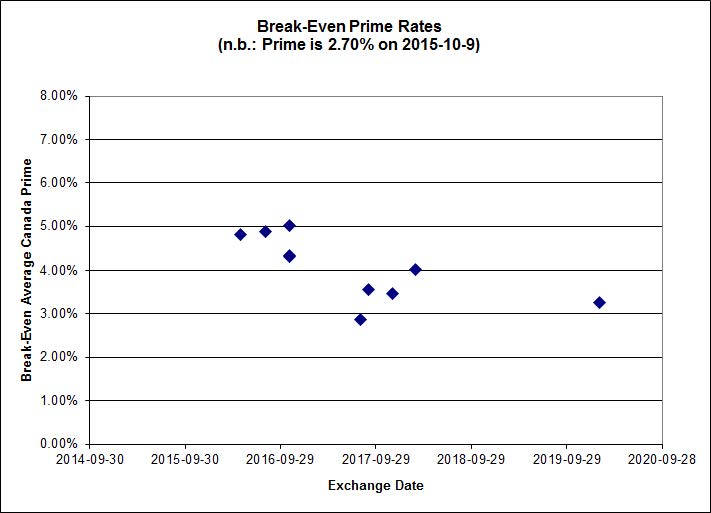
Quite right; I have been publishing a chart of the implied average prime rate to the next Exchange Date for these pairs on a daily basis for some time now, and virtually all pairs require an average prime in excess of 3% during this period in order for the RatchetRate preferred to provide an equal total return as the corresponding FixedFloater. To the extent that this is unlikely, the RatchetRate preferreds are expensive.
If the above paragraph looks like random words strung together, I recommend perusing my publication Preferred Pairs. There is a calculator available.
Thank you James, I have two follow-up topices if I may:
1. As far as you can tell, are you observing a diminution of the outflow of cash out of prefs? If the pref prices keep going down in value more than the value of new issues, I assume it means that the market is selling more than they are buying prefs but, if it is just for window dressing / taking capital losses purposes, the total market cap value of all prefs plus cash held by pref ETF and funds managers awaiting on the sidelines redeployment in the pref market should start to stabilize and, eventually, when the market will be truly oversold, this total value shall start increasing back. I fear that the answer might be that there is no way to tell that.
2. Your link for your publication “Preferred Pairs” as well as BCE own investors’ site are very well done but I still don’t understand the “rationale”, if any, behind the (overcompliacted IMHO what must be scaring the market) of their dividend fixing formulas. Did you wrote in the past something about what these formulas (which I believe are essentially the same between each pair except for the effects of the conversion rights between the ratched and the corresponding fixed floater) actually means in practical terms?
Trying to simplifying things with observations while just dealing with the floater of each pair, I observe that:
a) they all start to pay montly dividend at 80% of prime when they come into existence;
b) This divy rate remains the same if / for so long as the stock keeps trading on average between 24.875 and 25.125;
c) the divy rate, will increase montly between 1& and 4% of prime per month if the stock price drops below 24.875 and up to a maximum of 4% per month if the stock price drops below 24.50;
d) Trying to make a simple scenario, this would mean that the stock will pay the maximum of 100% prime rate (out of $25 dollar par value) if the stock was to go down from day one starting trading below 24.50 for 5 consecutive months (in which case the divy rate would increase from its initial 80% of prime to the maxiumum of 100% of prime (that is, 80% + 5 X 4%);
e) From that point on, the divy rate will remain at 100% of prime for so long the stock price remains below $25.125 since it is not until that level that the divy rate starts to go down by 1% of Prime per month it stays at that price. The stock would need to go up to 25.50 to go down by 4% of prime per month until it reaches the minimum divy of paying only 50% of prime.
f) In other words, it seems very unlikely to me and I don’t see how the divy rate of the existing floaters (who have all been trading well below $24.50 for a while (I think) could ever see their divy rate going back down below 100% of prime.
Is it a fair assessement or what am I missing as possible scenario whereby the market would see it advantageous to value at more than 25.125 something that would pay less than 100% of prime???
Why are these floaters redeemable at $25.50 while the ratchet of the pair is only redeemable at $25.00?
… And I haven’t started to study the divy formulas for ratchets of the pair! Why is it so complicated?
Thks
!
At what point will companies themselves step in and scoop up a portion and eliminate future obligations. There also might be balance sheet and credit rating benefits.
That’s happening – to a very limited extent – now, with the Fairfax NCIB and the Brookfield Renewable NCIB.
It probably won’t happen much in the banking and insurance sector, because reductions of Tier 1 capital have to be approved by OSFI and OSFI might be a little leary of granting permission to buy up preferred shares a year in advance – if times change, they could be criticized! In that sector, I think the issuers would have to do it by a tender offering or ‘put rights’ issue.
There was an announcement of an authorized NCIB for BAM on August 12, but I don’t know how serious it is. There are lots of announcements; not so much cash.
For the rest of them – I don’t know what it would take!
It looks as if James is taking a well deserved break eating turkey on this Thanksgiving long weekend.
I wish! It was PrefLetter weekend, not Thanksgiving weekend!
Does an ETF such as CPD make sense as an investment at this time?
That depends on your portfolio goals and needs. If you have a need for long term steady income in a taxable portfolio (and you’re Canadian and therefore eligible for the dividend tax credit) then CPD could well make sense as an investment.
I would never make an investment recommendation based on the thesis that ”it will go up’. That’s market timing and it doesn’t work. I would however, make recommendations based on ideas such as ‘it will meet your portfolio needs better than other things you can buy, based on the long-term characteristics of the asset class’
I don’t believe rates will be this low for the ~ 30 year time horizon I have so the chance of capital gains with eventual rising rates (over 30 years) coupled with monthly distributions makes this asset class enticing to me.
Whether or not you make a capital gain is a more complex question than whether or not ‘rates’ (by which I assume you mean five-year Canada yields) will increase.
Long rates are different from short rates and respond to different stimuli. The same applies with respect to corporate rates vs. governments.
It is reasonable to assume that five-year Canada rates will rise in the future; I am on record as stating that current levels for GOC-5 are not sustainable and I have illustrated my belief with a discussion of monetary policy from a central banker’s perspective. And, yes, if we also accept that the Central Banks will not permit deflation to take root, that necessarily implies an increase in dividends paid from the levels currently projected (which are less than dividends currently paid).
However, this does not automatically translate into an expectation of capital gains. That will depend on FixedResets spreads to other investments. Spreads against five-year Canada are now very high; spreads against PerpetualDiscounts are now very low; and PerpetualDiscount spreads against long term corporates are now very high. So, sure, if yields and spreads return to ‘normal’, there will be a capital gain.
But if spreads were abnormal before, they might be normal now. And relationships could change … we might see GOC-5 increase, but long-term corporate yields increase more and this would reduce, if not eliminate, if not reverse our expectations, dependent upon the size of the various moves.
There are an awful lot of moving parts. While I will agree that, sure, chances for long term capital gains are now higher than they were nine months ago, that doesn’t mean it’s a sure thing.
Preferred Shares are all about tax-advantaged income. In the case of FixedResets, which now make up the bulk of the market, they’re all about inflation-protected tax-advantaged income (but remember you’re paying what is still a pretty stiff price for that inflation protection!). If that characteristic makes preferreds suitable for your portfolio, then yes, you should be considering them very seriously right now.
it smells like an institutional player, or perhaps wealth manager, was aggressively rotating out of prefs. It could also explain some of the price action as the etf market makers would not fire market orders deep through the book.
Given this year in prefs, I don’t think it’d be too surprising to see some more aggressive rotations (both in and out) through year end.
I think you’re right, to a very large extent. However, I think there’s a large retail component to the current downdraft – simply based on the idea that preferreds are an essentially retail product, so nobody else can do much selling; and because I’m hearing from retail investors who are just fed up. By and large they were sold these things with the assurance that the reset mechanism would keep the price constant; now they figure they were lied to, so they’re selling their positions on the way to their lawyers’ offices. Their investments are losing value and they’re not really sure why … this was also the case, to a large extent, with Straight Perpetuals during the Credit Crunch.
Thank you for the detailed reply. Reading the links you’ve included I was unaware of the magnitude of reduction in dividends based on the current GOC 5 rate. That being said, I do feel inflation protected tax advantaged income is good for my portfolio and an ETF such as CPD will give me good diversification. As a long term vehicle for retirement income I feel this is a good choice for a risk-adverse individual such as myself.
It probably won’t happen much in the banking and insurance sector, because reductions of Tier 1 capital have to be approved by OSFI.
Yes. True, maybe.
http://www.osfi-bsif.gc.ca/eng/fi-if/rg-ro/gdn-ort/adv-prv/pages/advisory_3860.aspx
This maybe only true for pref shares which have conversion elements. All others are open for discussion. So I understand.
If the event is to offset some forward liability other than conversion, it might seem all is okay. Indeed encouraged by current regs.
My eyes this am watched as certain issues were bought at market in rather large amounts. Of course if Im right the market will become thinner and less fluid.
I’ve been *market timing* since 2000 when I sold all my stocks and bought 30 year US treasuries yielding 7% and it has been working out really well for me ever since. Dumb luck?
AX.PR.U will reset to yield 8.52% on 3/31/18 if the US 5Yr rate is still 1.34% and AX.PR.U still trades at $16.90. I predict that it instead will be called at $25 unless Artis goes through some kind of credit event. There are lots of other Canadian rate-reset preferreds from fairly diversified, sector-wise, companies selling at bargain basement prices.
You just need a multi-year hold period and market timing for buying on this panic selling of Canadian rate-reset preferreds will work out very well indeed, just like it did in 2009.
RY.PR.W is confusing.
Although it is an old issue, it convertible into common and therefore can be made NVCC-compliant at the stroke of a pen.
Does that help?
As far as you can tell, are you observing a diminution of the outflow of cash out of prefs? … I fear that the answer might be that there is no way to tell that.
Surely the cashflow in is mathematically equal to the cash-flow out?
I still don’t understand the “rationale”, if any, behind the of their dividend fixing formulas. Did you wrote in the past something about what these formulas actually means in practical terms?
Calculation of RatchetRate Dividend Yield. Is this what you mean?
The rationale behind the FixedFloater / Ratchet Rate structure was the same as that of the FixedReset / FloatingReset structure: by allowing conversion to a floating rate instrument, it was supposed to give investors some assurance that the issue would always be trading near par. Ha!
The FF/RR structure could not be used by banks for Tier 1 Capital purposes because the Ratchet Rate adjustment mechanism can be decried as credit-dependent and that’s not allowed under the OSFI rules.
The post Fixed-Resets : Critchley Likes, Ruggins Doesn’t has a link to a column by Barry Critchley of the Financial Post titled BNS offers investors better deal in which Len Ruggins, a former BCE/ Bell Canada executive, decries the FixedReset structure.
More interestingly, in the post Critchley of Financial Post: Fixed-Resets Good!, I link to Critchley’s column Ruggins, a master of Tier 1, in which Ruggins gives himself a pat on the back for being so good to investors when he sold them prefs:
The structure did work as expected for quite some time. At the beginning of the Credit Crunch – when we also had the BCE Income Trust Teachers Deal to think about – and after the Teachers deal fell through, BCE started weakening.
I drew a very nice graph for my seminar on Floating Rate issues about it … I plotted the percentage of prime (in terms of dividend) on the same graph as a plot of percentage of par (in terms of price of the share). It was most interesting … at first the percentage of prime increased steadily, with the price rock solid at just a little below par.
But then the percentage of prime hit 100, and the price started to go down.
The structure did very well … within its design limits! But the fundamental problem with preferreds that purport to be risk-free is that they ain’t. They are perpetual instruments with perpetual credit risk and given that basic characteristic, ain’t nuthin’ that will stop the price from dropping eventually.
Nowadays, I think it’s fair to assume that there is little likelihood in the medium term of the Ratchets being priced at greater than par and therefore the price going down. For the foreseeable future, they will pay 100% of prime, which normally should be three month bills plus 200bp, give or take, and as we are finding to our chagrin, bills+200bp can look pretty damn skinny at times, especially when there’s lots of good stuff paying more.
Why are these floaters redeemable at $25.50 while the ratchet of the pair is only redeemable at $25.00?
The Ratchets can ALWAYS be redeemed at 25.50 and are redeemable at 25.00 on Exchange dates. This protects the issuer in the event that prime goes up to 20% or something and they don’t feel like paying it.
As a long term vehicle for retirement income I feel this is a good choice for a risk-adverse individual such as myself.
That’s what they’re for! Just don’t go overboard and don’t expect price stability! As I have written in the past, in Fixed Income you can have Security of Income or Security of Principal; you cannot have both!
It probably won’t happen much in the banking and insurance sector, because reductions of Tier 1 capital have to be approved by OSFI.
Yes. True, maybe.
http://www.osfi-bsif.gc.ca/eng/fi-if/rg-ro/gdn-ort/adv-prv/pages/advisory_3860.aspx
The linked OSFI advisory deals with “Section 3860 of the CICA Handbook and the Regulatory Capital Treatment of Preferred Shares and Innovative Tier 1 Instruments”
Prior to the revision of this section, all preferred shares were considered equity for accounting purposes. The accounting treatment was then changed such that retractible preferreds were moved from the Shareholders’ Equity section of the Balance Sheet to the Liabilities Section – in other words, they became bonds for accounting purposes.
This destroyed the market for retractibles, because there was no longer any reason to issue them; extant issues hit their retraction date, and were redeemed without being replaced by similar issues.
You can read more about the changes in the posts Are Preferred Shares Debt or Equity? and Management Reaction to Mandatory Accounting Changes.
It probably won’t happen much in the banking and insurance sector, because reductions of Tier 1 capital have to be approved by OSFI.
There is basically only one reason why OSFI-regulated companies issue preferred shares: because prefs count (up to a limit) as part of Tier 1 Capital and they’re cheaper for the company to issue than common equity.
Every single preferred share issued by a bank or insurer is now part of its Tier 1 Capital. Some of these are under the gun, with the phasing out of NVCC-non-compliant eligibility (for banks) and there are those (like me) who anticipate the extension of these rules to insurers.
And, being part of Tier 1, regulatory permission is required for redemption or cancellation.
I’ve been *market timing* since 2000 when I sold all my stocks and bought 30 year US treasuries yielding 7% and it has been working out really well for me ever since. Dumb luck?
Yes.
AX.PR.U will reset to yield 8.52% on 3/31/18 if the US 5Yr rate is still 1.34% and AX.PR.U still trades at $16.90. I predict that it instead will be called at $25 unless Artis goes through some kind of credit event.
AX.PR.U is a FixedReset, 5.25%+446 and therefore, from the standpoint of the issuer will reset at 5.80% if the US 5-Yr rate is 1.34%.
Long-term US corporates now yield about 4.86% and all BBB debt (like Artis’) yields about 60bp more than all corporate debt.
So you could well be right about redemption, and at the very least there would seem to be a good chance of price appreciation based on a thesis that spreads to bonds will normalize … but you can say that about any preferred.
Good luck!
What a great bit of information. To much to learn.
And, being part of Tier 1, regulatory permission is required for redemption or cancellation.
That I surmised. But, I see no reason/regulation to buy and hold (balance sheet fix), mmm, unless there is a tax incentive as investment income.
While not a bank, I may have seen that FN.PR.A had today a completed sale order for 41k at 10ish. Certainly out of the ordinary for such a thin stock.
I think year end reporting for 2015 will be not as usual.
Thanks for this forum of education.
B&H