Category: Interesting External Papers

Interesting External Papers

Economic Effects of Sub-Prime, Part I : Loss Estimates

In the comments to my post Is the US Banking System Really Insolvent? Prof. Menzie Chin brought to my attention a wonderful paper: Leveraged Losses: Lessons from the Mortgage Market Meltdown.

This paper has also been highlighted on Econbrowser under the title Tabulating the Credit Crunch’s Effects: One Educated Guess.

The source document is in several parts – to do justice to it, I will be be posting reviews of each section. In this post, I will examine Part 3: Estimating Mortgage Credit Losses.

The first method of estimation is described thus:

The mechanics of these estimates is best explained by focusing on the $243 billion baseline estimate produced by the global bank analysts at Goldman Sachs. Their model simply extrapolates the performance – defaults, loss severities, and total loss rates – of each “vintage” (origination year) of subprime and other mortgage loans, based on its own history as well as the typical progression pattern through time. For example, suppose that the cumulative default rate on the 2006 subprime vintage is 3% at the end of 2007. Suppose further that the 2004 vintage showed a cumulative default rate of 1% after 1 year and 4% after 3 years, i.e. a fourfold increase over 2 additional years. Their procedure is to use the data on the 2004 vintage to extrapolate the cumulative default rate on the 2006 vintage. In this scenario, the default rate on the 2006 vintage would be 12% by the year 2009.

This methodology is, of course, complete nonsense. While I am sure that it is possible to determine a factor that correlates time from origination with cumulative loss experience, it is totally unacceptable to consider this the sole factor. As the authors state in the introduction to section 3.2 regarding adjustments to this baseline forecast:

Although the modeling strategy described above seems quite logical, it does not account for the possibility of a structural break that might result from falling home prices. In particular, because the detailed mortgage performance data required to build these types of models are available only back to the mid-1990s, there are no observations on how defaults and losses on a particular vintage change through time when home prices start to fall.

It would seem much more logical to consider – at least! – a three-factor model, which would incorporate the effect of negative equity on default rates and some measure of income … in other words, the good old “asset coverage” and “income coverage” tests that will be so familar to PrefBlog’s readers. The authors do not do this, nor do they attempt to do this – they simply increase the subprime default rates by one third and assume that non-subprime [you can’t call this “prime”, because of the “jumbo” and “Alt-A” netherworlds] defaults rise to one-half of the historical peak to arrive at an estimate of $400-billion total losses.

While the authors admit that these assumptions are extremely arbitrary, I will go a bit further and say that they are so arbitrary that their inclusion detracts from the credibility of the paper.

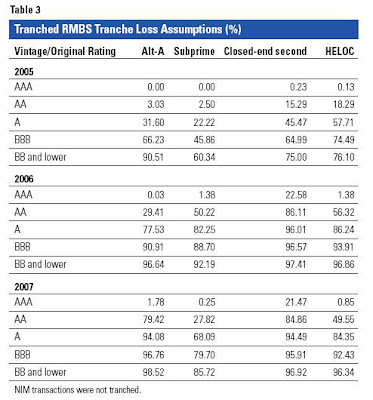
The second method sets up a grid analyzing total sub-prime issuance of $1,402-billion into cells determined by tranche rating and vintage. Each cell is then multiplied by the price of the ABX contract corresponding to that cell to calculate a loss estimate. The authors present their data as Exhibits 3.2, 3.3 and 3.4; a highly abbreviated summary of the data is:

Abbreviated Version of Loss Estimate
Tranche Nominal
Value
Loss
Factor
(Weighted
Average)
Loss
 AAA 1,133   18.9%  214
 AA 135   43.0%  58
 A 70   65.7%  46
 BBB 49   79.6%  39
 BB/Other 15   86.7%  13
 Total 1,402     371

The authors note:

There are many caveats that come with these estimates. We know that trading is thin in the underlying loan pools. More importantly, the ABX prices probably include a risk premium that is necessary to induce investors to bear mortgage credit risk in the current mortgage credit crisis. It may therefore overstate the market’s true expectation of future losses, although the size of this overstatement is difficult to gauge. Nonetheless, it is interesting to us that the range of losses from this exercise is not too different from the one obtained using method one calculations.

I will go so far as to say that the risk premium “probably” included in ABX prices is probably dominant. Let’s have a look at some analysis that at least purports to be an analysis, rather than an academic exercise in applying the Efficient Market Hypothesis. From Accrued Interest‘s post S&P on the monolines: No problem. Why?:

I will note that the Fitch stress test of RMBS, noted in their recent report on insurance companies, allows for a 5% loss on AAA, 30% on AA and 100% on everything else. 

It is quite apparent that – regardless of the loss of information inherent in my presentation of highly compressed versions of the authors’ calculations – that there are huge differences between “price” and “value”, where price is defined by reference to the ABX indices and value is defined by S&P’s cumulative default projections.

I will not make an impassioned defense of S&P here, nor will I repeat the concerns about the ABX indices that I raised in response to Prof. James Hamiltion’s Econbrowser post “Mortgage Securitization“. I will, however, point out that it seems rather intellectually dishonest not to include any “bottom up” analyses that might, possibly, give rise to smaller numbers in this review article. If the authors don’t place any credence in the estimates – that’s fine, let them say so. But completely ignoring such estimates detracts further from the paper’s credibility.

The paper’s third method of estimation is much more robust. The authors examine prior experience in three states (California (1991-1997), Texas (1986-1989) and Massachussets (1990-1993)) that experienced sharp declines in housing prices and arrive at potential foreclosure rates in the current crisis by comparison:

Hence, we conclude from our analysis that a housing downturn that resembled the three regional busts, with a 10%-15% peak-to-trough home price fall, could triple the national foreclosure rate over the next few years. This would imply a rise from 0.4% in mid-2006 to 1.2% in 2008 or 2009. Once home prices recover, the foreclosure rate might gradually fall back toward 0.4%.

Unfortunately, the authors spoil a good start by making an aggressive assumption in the course of their calculation:

These assumptions imply cumulative “excess” foreclosures of 13.5% of the currently outstanding stock of mortgages over the next few years. [Note: The calculation is that the foreclosure rate exceeds its baseline level by an average of 0.48 percentage points per quarter for a 7-year period, which implies cumulative excess foreclosures of 13.5%.]

A seven year period? A severe nation-wide recession lasting seven years sounds more like a depression to me. Additionally, the authors arrive at this figure by tripling the mid-2006 foreclosure figure of 0.4%, when the tripling in the states’ data was achieved from base rates of about 0.2%.

To be fair, though, I will note the recent Mortgage Bankers’ Associate press release:

The delinquency rate does not include loans in the process of foreclosure.  The percentage of loans in the foreclosure process was 2.04 percent of all loans outstanding at the end of the fourth quarter, an increase of 35 basis points from the third quarter of 2007 and 85 basis points from one year ago.

The rate of loans entering the foreclosure process was 0.83 percent on a seasonally adjusted basis, five basis points higher than the previous quarter and up 29 basis points from one year ago.

The total delinquency rate is the highest in the MBA survey since 1985.  The rate of foreclosure starts and the percent of loans in the process of foreclosure are at the highest levels ever.

The increase in foreclosure starts was due to increases for both prime and subprime loans.  From the previous quarter, prime fixed rate loan foreclosure starts remained unchanged at 0.22 percent, but prime ARM foreclosure starts increased four basis points to 1.06 percent. Subprime fixed foreclosure starts increased 14 basis points to 1.52 percent and subprime ARM foreclosure starts increased 57 basis points to 5.29 percent. FHA foreclosure starts decreased 4 basis points to 0.91 percent and VA foreclosure starts remained unchanged at 0.39.

Their figure of 13.5% cumulative foreclosures is then applied to $11-trillion of total mortgage debt to arrive at foreclosure starts of $1.5-trillion. These foreclosure starts turn into actual repossessions at a rate of 55-60%, and the authors claim average loss severity of 50%, to arrive at total losses (over seven years, remember) of $400-billion.

Quite frankly, their phrasing of the justification of the 55-60% repossession strikes me as a little suspicious:

However, the percentage of all foreclosure starts that turn into repossessions – measured by the number of Real Estate Owned (REO) notices divided by the lagged number of Notices of Default (NoD) – has recently risen to over 50% according to Data Quick, Inc., a real estate information company.

It’s only recently risen to over 50%? What is it normally? What was it in the data that has been presented for the three states that give rise to the “tripling” statistic? There has been a lot of analysis to the effect that a lot of sub-prime mortgages didn’t even make their first payment – which is taken as a warning flag of intentional fraud. Has this been accounted for?

Quite frankly, there are too many unanswered questions here for me to take the loss estimates seriously. I will stress: I am not taking a position on what the actual level of subprime losses will be. I am, however, pleading desperately for a credible estimate.

I will note that Larry Summers thinks $400-billion total is optomistic.

Update, 2008-3-8: There is a laudatory article in the Economist:

The study begins by estimating the size of mortgage-related losses using three different methods.

Each method involves some heroic assumptions.

Strikingly, however, all three approaches yield similar results: that mortgage-credit losses are likely to be around $400 billion.

Not only are the assumptions heroic, they are not supported by evidence or argument. There is no indication in the paper that they are anything other than “plugs” … a factor used to ensure you get the result you want. It is therefore not terribly impressive that all three approaches yield similar results … whatever happened to critical thinking?

Update, 2008-3-23: Here are PIMCO’s views on the matter, as of January 2008:

In order to measure the distance to a resolution of the problem, we need to estimate the extent of the valuation losses in subprime loans and related products. There is no clear answer, but data from the International Monetary Fund (IMF) and the Organization for Economic Co-operation and Development (OECD) suggest subprime losses of $300 billion. Roughly speaking, this is equivalent to 15% (40% default rate times 40% loss rate) of the $2 trillion in outstanding subprime home mortgages including Alt-A loans. However, judging from losses announced recently by financial institutions, we believe that actual overall subprime losses come to nearly double this figure or approximately $500 billion. This is because in addition to losses on subprime loans themselves, there were also steep valuation losses on other securitized products that make up nearly half the total. Financial institutions have an exposure of about 40%, so we believe that their latent losses amount to $200-250 billion.

Let us now examine the disparity between these potential losses and the actual losses (including valuation losses) posted by financial institutions. Losses declared by the major banks as of the end of last year came to around $100 billion, roughly 40-50% of the estimated latent loss. (Figure 3)

Update, 2008-3-25: Goldman Sachs is estimating $460-billion to the “leveraged sector”:

Wall Street banks, brokerages and hedge funds may report $460 billion in credit losses from the collapse of the subprime mortgage market, or almost four times the amount already disclosed, according to Goldman Sachs Group Inc. Profits will continue to wane, other analysts said.

“There is light at the end of the tunnel, but it is still rather dim,” Goldman analysts including New York-based Andrew Tilton said in a note to investors today. They estimated that residential mortgage losses will account for half the total, and commercial mortgages as much as 20 percent.

Note that Goldman Sachs influenced the conclusions of the paper reviewed in this post, so this is not a fully independent estimate.

Interesting External Papers

IIAC 3Q07 Issuance Report

The Investestment Industry Association of Canada announced its Review of Equity New Issues and Trading for the third quarter of 2007, noting:

Preferred share issuance down 97 per cent quarter-over-quarter

Issuance in the first three quarters of 2007 totalled $4.2-billion, compared with $28.5-billion common, $6.4-billion Income Trusts, $1.6-billion Limited Partnerships and $0.3-billion Capital Trusts. Presumably, the two new issues announced in September for October settlement will be incorporated into the 4Q07 figures.

Interesting External Papers

FDIC Quarterly Report on US Banks

As noted by the WSJ, the American Federal Deposit Insurance Corporation has released its 4Q07 Quarterly Banking Report. It starts off with a bang!:

Record-high loan-loss provisions, record losses in trading activities and goodwill impairment expenses combined to dramatically reduce earnings at a number of FDIC-insured institutions in the fourth quarter of 2007. Fourth-quarter net income of $5.8 billion was the lowest amount reported by the industry since the fourth quarter of 1991, when earnings totaled $3.2 billion. It was $29.4 billion (83.5 percent) less than insured institutions earned in the fourth quarter of 2006. The average return on assets (ROA) in the quarter was 0.18 percent, down from 1.20 percent a year earlier. This is the lowest quarterly ROA since the fourth quarter of 1990, when it was a negative 0.19 percent. Insured institutions set aside a record $31.3 billion in provisions for loan losses in the fourth quarter, more than three times the $9.8 billion they set aside in the fourth quarter of 2006. Trading losses totaled $10.6 billion, marking the first time that the industry has posted a quarterly net trading loss. In the fourth quarter of 2006, the industry had trading revenue of $4.0 billion. Expenses for goodwill and other intangibles totaled $7.4 billion, compared to $1.6 billion a year earlier. Against these negative factors, net interest income remained one of the few positive elements in industry performance. Net interest income for the fourth quarter totaled $92.0 billion, an 11.8-percent ($9.7-billion) year-over-year increase.

… but things aren’t always as they seem …

Earnings weakness was fairly widespread in the fourth quarter. More than half of all institutions (51.2 percent) reported lower net income than in the fourth quarter of 2006, and 57.1 percent reported lower quarterly ROAs. However, the magnitude of the decline in industry earnings was attributable to a relatively small number of large institutions. In contrast to the steep 102 basis-point drop in the industry’s ROA, the median ROA fell by only 14 basis points, from 0.93 percent to 0.79 percent. Seven large institutions accounted for more than half of the total year-over-year increase in loss provisions. Ten large institutions accounted for the entire decline in trading results. Five institutions accounted for three-quarters of the increase in goodwill and intangibles expenses, and sixteen institutions accounted for three-quarters of the year-over-year decline in quarterly net income. One out of every four institutions with assets greater than $10 billion reported a net loss for the fourth quarter. Institutions associated with subprime mortgage lending operations and institutions engaged in significant trading activity were among those reporting the largest earnings declines.

… and capital ratios were, by and large, reasonable …

Total equity capital increased by $25.1 billion (1.9 percent) during the fourth quarter. This increase lagged behind the 2.6-percent increase in assets during the quarter, and the industry’s equity-to-assets ratio declined from 10.44 percent to 10.37 percent. Goodwill accounted for almost one-third ($7.9 billion) of the increase in equity, despite large write-downs of goodwill at several institutions. The industry’s leverage capital ratio registered a larger decline during the quarter, because leverage capital does not include goodwill. The leverage ratio fell from 8.14 percent to 7.98 percent, a four-year low. In contrast, the industry’s total risk-based capital ratio, which includes loss reserves, increased from 12.74 percent to 12.79 percent. At the end of 2007, 99 percent of all insured institutions, representing more than 99 percent of total industry assets, met or exceeded the highest regulatory capital standards.

… although things got a little hairy at the margins (and, presumably, with the big money-centre banks) …

The number of FDIC-insured institutions reporting financial results declined from 8,559 to 8,533 during the fourth quarter.2 Fifty newly chartered institutions were added during the quarter, while 74 institutions were absorbed by mergers. One insured commercial bank failed in the fourth quarter. For the full year, 181 new insured institutions were chartered, 321 charters were absorbed in mergers, and three insured institutions failed. In the previous two years, there were no failures of FDIC-insured institutions, an interval unprecedented since the inception of the FDIC. In 2004, four insured institutions failed. Five mutually owned savings institutions, with combined assets of $4.8 billion, converted to stock ownership in the fourth quarter. For the entire year, ten insured savings institutions with total assets of $10.1 billion converted from mutual ownership to stock ownership. At the end of 2007, there were 76 FDIC-insured commercial banks and savings institutions on the “Problem List,” with combined assets of $22.2 billion, up from 65 institutions with $18.5 billion at the end of the third quarter.

All in all, I think the report justifies my remark in the Crony Capitalism? post:

As far as the overall health of the banking system is concerned, let’s look at the Fed’s Term Auction Facility. The last one was reported on February 12; there was one today. The very low premium on this money relative to Fed Funds – and the continuing drop in the TED Spread – leads me to conclude that insolvency, potential or undiscovered, is not a problem in the banking system. It’s illiquidity, pure and simple.

Interesting External Papers

IMF: Canadian Financial System is Well-Capitalized

The International Monetary Fund Country Report on Canada (2008) has been released. Here are some highlights:

Canadian banks appear to be sound and resilient. The stress tests indicate that the five largest banks would be capable of weathering a shock about one-third larger than the 1990–91 recession, involving a contraction of the North American economy, an increase in interest rate risk premia, and lower commodity prices. This resiliency may in part reflect the fact that the Canadian banks are national in scope and thus able to benefit from regional and sectoral diversification.

There’s more detail available on this. Credit risk is the major risk factor; market risk and liquidity risk were determined to be less important risk factors.

Until recently, most Canadian liquidity protection could only be drawn in the event of a GMD, whereas conduits in Europe and the United States enjoy virtually unconditional “global-style” liquidity protection.12 This may have been, in part, an unintended consequence of OSFI’s Regulation B-5, which exempted only GMD-conditional liquidity support from bank regulatory capital requirements. For unconditional facilities up to one year, OSFI and the United States used national discretion (consistent with Basel rules) to apply a 10 percent credit conversion factor (CCF), whereas most European countries applied a zero CCF. Basel II will apply a zero CCF to GMD-conditional support, and 20 percent to unconditional facilities with maturities up to one year.

Note: The required regulatory capital on a liquidity facility is calculated on the product of the CCF and the highest risk weight assigned to any of the underlying individual exposures covered by the facility.

I hadn’t known that about the European banks’ zero CCF on unconditional liquidity support! No wonder they’re in so much trouble! The Fed Policy, and its change to match stricter Canadian standards, has been previously discussed.

The situation in the ABCP market is still evolving and continues to pose a risk to investor confidence. Stress tests performed by OSFI indicate that if banks were to put the assets in their sponsored conduits on their balance sheets, this would leave them with capital above the regulatory targets. While the problems in the third-party conduits may result in losses to some of the parties involved, it is not clear that the stability of the broader financial system will be materially affected. There is, however, the risk that continuing problems in the ABCP and money markets could lead to a wider loss of confidence. The precise form such an event would take is of course difficult to predict, as are its possible consequences.

Note: However, these stress tests do not seem to consider an interruption of financing, a decline in asset prices, or the cost of holding “bridge loans” that would have otherwise been financed in the money markets.

…which leaves one wondering just what was modeled by the OSFI stress tests!

The banking system also appears to remain fairly stable in terms of marketbased measures. The two-year probability of default of a single Canadian bank implied by Moody’s KMV data has increased to about 7 percent in mid-December, compared with 2 percent before the market turbulence began in August 2007, and remains well below the 14 percent seen in the United States. A banking stability index (BSI) defined in terms of the joint probability of default of the largest banks in the system has also increased commensurately.

I’m surprised that this paragraph didn’t draw more headlines! KMV is a Merton-style structural model of defaults – as such, if may be expected to overestimate default probability at times when the equity cowboys are panicky.

Interesting External Papers

US Bank Panics in the Great Depression

The WSJ Economics Blog highlighted a paper by Mark Carlson of the Fed, titled Alternatives for Distressed Banks and the Panics of the Great Depression.

I must say that I don’t consider the conclusions too earth-shattering, but it’s always good to have hard data! The penultimate and conclusive sections read as follows:

One potential reason that restructuring may have been more difficult for banks that failed during panics is that the surge in the number of failing banks during panics increased the competition for new capital. It seems quite reasonable that, at least in the short run, the pool of resources available to investors to recapitalize banks is fixed. As the number of troubled institutions competing for those resources rose, only a small fraction might have been able to obtain them. Thus, even though some banks might have been able to attract capital during ordinary times, there were simply too many banks seeking that capital during panics.

A second reason that panics may have inhibited the ability of banks to pursue alternative resolution strategies is that the number of banks in trouble during panics may have made rescuing the banks more expensive or difficult. Allen and Gale (2000) show how interbank claims can cause losses to spread across banks. Diamond Rajan (2005) present a model in which illiquidity problems at one bank can reduce the liquidity of the banking system and cause problems for other banks. In these models the more banks affected in the initial state, the greater will be the problems for the other banks. Ferderer (2006) finds evidence that market liquidity did decline at times during the Depression. Donaldson (1992) also illustrates how that value of a bank can fall as the number of other banks in distress increases.

A third potential for the difficulty in attracting capital in crises might be an increased difficulty in valuing banks during a panic. Wilson, Sylla, and Jones (1990) noted that asset price volatility increases during panics. If investors had a more difficult time than usual valuing the bank, especially with risks likely tilted to the downside, they may not have been as willing to assist in restructuring the bank.

All three of these reasons could potentially contribute to a reduction in the ability of banks to recapitalize after suspending or to merge with another bank during a panic. The data used in this paper does not allow us to explore which, if any, of these reasons appears particularly important. This area may be fruitful ground for further research.

Section 5. Conclusion

The empirical literature on banking panics finds that banks that failed during panics were generally economically weaker than the ones that survived. The analysis here comes to a similar conclusion, but argues that this comparison provides an incomplete picture of the effects of panics on the banking system. Banks had alternatives to failing during regular times; they could either suspend and reorganize or merge with other banks. This study examines whether banks that failed during panics might, had the panic not occurred, have been able to pursue these other options. Through a series of comparisons, I find evidence that the balance sheets of banks that failed during panics were at least as strong as those of banks that were able to pursue alternative resolution strategies. These findings suggest that the panics may have played a role in preventing banks from suspending and reorganizing or from finding other banks to merge with, possibly due to the increase in the number of problem banks and uncertainty in pricing financial assets during panics.

The period of liquidation following bank failure caused assets to be taken out of the banking system and frozen for extended periods. During a bank merger, the assets stay in the banking system continuously. For banks that suspended temporarily, the median length of suspension in this sample was about 5 months. By comparison, Anari, Kolari, and Mason (2005) find that the average length of liquidation of a bank that failed in the early 1930s was about 6 years. The loss of the bank expertise and the freezing of bank assets and deposits have been found to have had negative effects on output (Bernanke 1983, Anari, Kolari, and Mason 2005}. Thus, to the extent that the panics prevented banks from pursuing less disruptive resolution strategies, then the panics of the early 1930s may well have played a role in prolonging and deepening the Great Depression.

Interesting External Papers

Earth to Regulators: Keep Out!

Willem Buiter’s excellent blog, Maverecon, brings to my attention two reports prepared in the UK:

Willem Buiter is frequently mentioned in PrefBlog: he has, for example, prepared a very good summary of Lessons from the 2007 Financial Crisis. I sharply disagreed with his prescription for reform of the Credit Rating Agencies and also with his current statement:

The Report also mentions the need to improve the functioning of securitisation markets, including improvements in valuation and credit rating agencies but offers very little beef in these areas. It is clear that the credit rating agencies will have to be ‘unbundled’, and that the same legal entity should not be able to sell both ratings and advice on how to structure instruments to get a good rating. The conflict of interest is just too naked. Rating agencies will have to become single-product firms, selling just ratings.

… but for now I’ll let that go. In this post I will discuss the Official Position.

Section 2.61 of the Financial Stability report states:

The Authorities believe that the preferred approach to tackling such issues is through market action, and where appropriate through changes to the IOSCO Code of Conduct on Credit Rating Agencies. However, it is important to recognise that prudential credit ratings are a regulatory tool, in that supervision within the CRD/Basel II framework places reliance on the use of rating opinions to determine risk weightings for capital purposes. Therefore regulators have a strong interest in ensuring that ratings are viewed as reliable and that the information content of ratings is sufficient. If the issues summarised above are not adequately addressed by the markets, alternative measures to remedy these issues should be considered.

… while Section 2.62 continues:

Investors also need to learn lessons from recent events. In particular, investors need to develop a more sophisticated use of ratings. Market participants that consider investing in new asset classes, such as structured products, should not use ratings as a substitute for appropriate levels of due diligence, nor draw – potentially misplaced – inferences from ratings that the behaviour of structured securities share the same characteristics, including liquidity characteristics, as more familiar comparably-rated corporate securities. Recent losses and illiquidity in such asset classes have ensured these issues are in the forefront of investors’ minds, and market practice is already adapting rapidly in response. There will be a role for coordinating bodies – such as industry groups and international fora – in clarifying and codifying new practice.

And, finally, I note that the authorities are requesting, inter alia, the following feedback:

2.6) Have the Authorities correctly identified the issues on which international work on credit rating agencies should focus?

2.7) Do you agree with the Authorities’ proposals to improve the information content of credit ratings?

2.8) Do you agree with the Authorities that the preferred approach to restoring confidence in ratings of structured products is through market action and, where appropriate, changes to the IOSCO Code of Conduct on Credit Rating Agencies?

First, let’s look at a little history. Remember the Panic of 1825? I will remind Assiduous But Sometimes Forgetful Readers of the bailout of the banking house of Sir Peter Pole, as related and analyzed by Larry Neal, professor of economics at the University of Illinois at Urbana-Champaign:

The first mention of the crisis occurs on December 8, 1825, when “The Governor [Cornelius Buller] acquainted the Court that he had with the concurrence of the Deputy Governor [John Baker Richards] and several of the Committee of Treasury afforded assistance to the banking house of Sir Peter Pole, etc.”44 This episode is described in vivid detail by the sister of Henry Thornton Jr., the active partner of Pole, Thornton & Co. at the time. On the previous Saturday, the governor and deputy governor counted out £400,000 in bills personally to Henry Thornton, Jr., at the Bank without any clerks present.45 All this was done to keep it secret so that other large London banks would not press their claims as well. A responsible lender of last resort would have publicized the cash infusion to reassure the public in general. Instead, the run on Pole & Thornton continued unabated, causing the company to fail by the end of the week. Then the deluge of demands for advances by other banks overwhelmed the Bank’s Drawing Office.

The analysis makes perfect sense to me. The lender of last resort should enjoy the utmost confidence of the investing public, with an unparalleled reputation for probity and bottomless pockets.

However, the Treasury Committee report on Northern Rock referenced above provides extensive detail about the urge of the lender of last resort to provide covert assistance only and why it was finally decided that any support had to be made public (paragraphs 123-142, inclusive). Paragraph 165 states as a conclusion of the committee:

We accept that the consequences of an announcement of the Bank of England’s support operation for Northern Rock were unpredictable. There was a reasonable prospect that the announcement would have reassured depositors rather than having the opposite effect, particularly prior to the premature disclosure of the operation. However, after the premature disclosure of the support, and against the background of the market reaction to Barclays use of lending a fortnight earlier, it seems surprising that the issues were not urgently revisited. It is unacceptable, that the terms of the guarantee to depositors had not been agreed in advance in order to allow a timely announcement in the event of an adverse reaction to the Bank of England support facility.

In this case it was the announcement that the Lender of Last Resort had been called upon that actually caused the run.

I will also note the acknowledgement of Prof. Buiter in Paragraph 164:

Professor Buiter took a rather different view:

If [the Tripartite authorities] were not quite convinced that the public would believe them—and in these days you cannot be sure of that—then the immediate creation of a deposit insurance scheme that actually works and is credible would have been desirable. To wait three days was again an unnecessary delay.

In other words, there is good agreement that the authorities have squandered the trust of the public. The quote seems to have been lost in a revision, but I recall reading at the time that one woman queuing up for her money at a Northern Rock branch told a reporter at the time – who was puzzled as to why she was concerned – that ‘they lied to us about Iraq. Why shouldn’t they lie to us now?’

My thesis can be stated very simply: given that distrust of regulatory and other official bodies is so deeply ingrained into the public psyche, how can there be any contemplation of the idea that increased regulation and official oversight of the Credit Rating Agencies will improve public trust in the ratings?

The proponents of increased regulation also appear to be completely unable to provide any evidence that a credit rating analyst required to fill in forms and tick off boxes will provide estimates and advice that are any better than he would have produced without filling in forms and ticking off boxes.

Sadly however, those investment advisors, both licensed and unlicenced, who persuaded clients/employers/investors that the ability to write a big cheque equated to investment management skill desperately need someone to blame, now that their delusions have blown up in their clients faces. There is also pressure from subscription-based agencies for the regulators to get them more clients. And, of course, the supreme test of one’s ability as a regulator is total faith in the proposition that everything be regulated by a wise regulator.

So … there’ll be changes, for sure. Mostly cosmetic, assuredly costly, definitely useless. But after all, nobody must ever lose money on an investment, or take responsibility for their own actions, right?

And, sadly, once any plan is implemented it will meet its unstated purpose of creating a well-defined scapegoat for any blow-up. As Scotia is proving in the course of its battle with David Berry: if you want to get somebody, and are prepared to spend enough money on enough lawyers to check through things carefully enough, you can “get” anybody … and pretend to be shocked at what you’ve found.

Interesting External Papers

Seniority of Bankers' Acceptances

This is a question that has bothered me for a long time – and I’ve never been able to get a satisfactory answer.

What is the seniority of Bankers’ Acceptances?

Finally, through the magic of the Internet, I’m a bit further forward with this inquiry and think – think! – I have a good answer with respect to US Law.

According to DRAFT COPY: PRINCIPLES AND CONDITIONS PRECEDENT FOR THE CREATION OF A LATIN AMERICAN BANKERS ACCEPTANCES MARKET, creditted to Matilde Carrau, Constantino Flores and Manuel Renato Martínez Quezada of the University of Arizona College of Law:

To recuperate the funds invested by the bank in the discount of the acceptance, the bank generally rediscounts the facility in the New York bankers acceptance market. To be able to participate in this market the acceptances have to meet the eligibility requirements established by 12 USC § 372 and § 373. The result of compliance with eligibility requirements also causes that the acceptances not to be considered a deposit subject to reserve requirements or FDIC assessment(155) under regulation D. Hence if the bankers acceptance is eligible for discount and purchase the bank will offer a better rate for this facility as compared to what it would offer in a traditional lending since these “savings” will partially be passed on to the customer.(156)

[155] Under FDIC regulation, banks are required to pay a premium over deposits; hence, if the bankers acceptance complies with eligibility requirements and is therefore not considered a deposit, no prime will be paid for said transaction and the operation will be cheaper.

[156] Professor Boris Kozolchyk comments that off balance sheet credit operations will always be preferred by bankers to get involved with. Bankers acceptances are regarded when backed by premium banks in the moneyness scale as one of the private instruments closest to the currency status; and for practical purposes, they may be regarded as money. Negotiable Instruments class, spring 1997 semester, University of Arizona College of Law, Master of Laws In International Trade Law Program (hereinafter NI Class comment).

Which seems to mean, according to these authors’ interpretation of US law (as of 1997!) that BAs are junior to DNs.

It is my (limited!) understanding that BAs in Canada are regulated by the Bills of Exchange Act … the fact that this is not the Bank Act leads me to believe that:

  • BAs are not considered deposits
  • BAs are not insured
  • BAs will be wiped out before insured deposits lose a dollar

But, I’m still trying to get something definitive from the CDIC and OSFI!

There’s more questions, too! Say the recipient of the proceeds of the BA (the issuer, whose note has been accepted by the bank) does, in fact, pay back his money while the bank is going down the drain. Will this repayment lose its identity in the bankruptcy, becoming part of the general assets of the bank and go towards paying its liabilities in order of seniority? Or does the payment retain its identity and be used to honour THE PARTICULAR BA that was issued against this payment?

Update, 2008-2-7: I have explicit confirmation from the CDIC that: “A Bankers’ Acceptance is not an insurable product with CDIC.”

Update, 2008-2-19: I asked the OSFI:

What is the status of Bankers’ Acceptances should the guaranteeing bank become bankrupt?

a) If the original issuer repays the debt, does this payment retain its identity (and become payable to the holder of those particular BAs), or do such repayments lose their identity and become undifferentiated assets of the bank?

b) If the original holder does not repay the loan, and the bank is not able to honour its guarantee, what is the seniority of the BA in the bankruptcy process? Are BAs junior to Deposit Notes, or parri passu?

c) Has the status of dishonoured BAs been tested in court?

and received the following answer:

OSFI does not have the authority over the day-to-day business operations of financial institutions, such as the issue you raise in your e-mail.

As you may know, a Bankers’ Acceptance note is a short-term promissory note issued by major corporations, backed by a Canadian Chartered Bank, and repayable on a specified date.   

Therefore, in order to determine the guarantee behind the note, you may wish to contact the financial institution from which the agreement originates.

Update, 2008-2-20: I have received the following answer from the Bank of Canada:

In response to your inquiry, I wish to inform you that the Bank of Canada, as the country’s Central Bank, does not provide banking services to the public, nor does it legislate the rules and regulations applicable to the activities of commercial banks and other financial institutions in Canada. This responsibility falls upon the jurisdiction of the Office of Superintendent of Financial Institutions, which can be reached at http://www.osfi-bsif.gc.ca/osfi/index_e.aspx?ArticleID=18.

There’s still a few arrows in my quiver, but I’m starting to run out of options!

Update #2, 2008-2-20: I have talked to a money market trader at a major bank – who in turn talked to his liquidity desk (who runs the BA book) – and the answer from there is:

  • (a) Payments from the underlying borrower would go into a BA pool, and
  • (b) BAs are parri passu with deposit notes

He had nothing written down on this matter.

Update, 2008-2-21 I checked Moody’s Guidelines for Rating Bank Junior Securities:

For most unregulated non-financial organizations, it is generally assumed that the probability of default is constant across the various obligations within a typical capital structure.1 (In other words, if the company goes bankrupt, it will default on all of its obligations.) Notching guidelines for these entities are therefore governed solely by differences in the expected severity of loss given default. However, because they are regulated — and their regulators may refuse to support certain junior obligations (or more likely, selectively impose losses on them without placing the entire bank into liquidation) — differences in the probability of default also play a role in bank notching practices.

The interplay between systemic support and selective interference complicates the analysis of banks’ junior obligations.

Moody’s does not notch senior debt issued by banks; they are rated at the same level as deposits. This is because deposits and senior debt have the same probability of default and generally rank pari passu in liquidation.

Here’s what Fitch has to say in its Bank Rating Methodology:

Support ratings are the product of Fitch’s assessment of a potential supporter’s (either a sovereign state’s or an institutional owner’s) propensity to support a bank and of its ability to support it. Its propensity to support is a judgement made by Fitch….

It is assumed that typically the following obligations will be supported: senior debt (secured and unsecured), including insured and uninsured deposits (retail, wholesale and interbank); obligations arising from derivatives transactions and from legally enforceable guarantees and indemnities, letters of credit, acceptances and avals; trade receivables and obligations arising from court judgements.

Update, 2008-2-22: OK, we’re starting to get somewhere! Here’s what a Bank of Canada spokesman had to say on the matter:

I would recommend seeking answers from issuers of these instruments or regulators thereof (securities commissions) or perhaps OSFI.

As for the Bank of Canada: BAs carry the credit risk of the accepting bank and are valued accordingly. If the Bank of Canada were holding (either outright or as collateral) a BA issued or accepted by a bank that becomes insolvent, the market value of the BA would obviously be reduced.

In this situation, the Bank of Canada would demand that the BA it is holding as collateral or in a repo be replaced by other collateral. If the institution that pledged or sold the BA to the Bank of Canada were to default at the same time as the bank that issued or accepted the BA were to become insolvent(a highly unlikely scenario), the Bank would be holding an unsecured claim against the bank, that would rank parri passu with the claims of depositors and other general creditors.

Update, 2008-2-27: Many thanks to the wonderful OSFI, who referred me to Section 369 of the Bank Act:

Insolvency 

369. (1) In the case of the insolvency of a bank, 

(a) the payment of any amount due to Her Majesty in right of Canada, in trust or otherwise, except indebtedness evidenced by subordinated indebtedness, shall be a first charge on the assets of the bank;

(b) the payment of any amount due to Her Majesty in right of a province, in trust or otherwise, except indebtedness evidenced by subordinated indebtedness, shall be a second charge on the assets of the bank;

(c) the payment of the deposit liabilities of the bank and all other liabilities of the bank, except the liabilities referred to in paragraphs (d) and (e), shall be a third charge on the assets of the bank;

(d) subordinated indebtedness of the bank and all other liabilities that by their terms rank equally with or subordinate to such subordinated indebtedness shall be a fourth charge on the assets of the bank; and

(e) the payment of any fines and penalties for which the bank is liable shall be a last charge on the assets of the bank.

(2) Nothing in subsection (1) prejudices or affects the priority of any holder of any security interest in any property of a bank.

(3) Priorities within each of paragraphs (1)(a) to (e) shall be determined in accordance with the laws governing priorities and, where applicable, by the terms of the indebtedness and liabilities referred to therein.

This helps a little … but Paragraph (3) kind of muddles the game, doesn’t it?

Update 2008-3-19: No response at all – not even an acknowledgement – from the thoroughly useless Canadian Bankers Association. I am now contacting the IR departments of the Big 6 Banks individually:

Sirs,

It is my understanding that under Section 369(1)(c) of the Bank Act, your Bankers Acceptances would be considered a third charge on the assets of the bank in the event of insolvency.

Section 369(3) of the Act notes that liabilities within this charge may be further ranked in accordance with terms of the indebtedness and liabilities referred to therein.

I would appreciate receiving information regarding Bankers Acceptances that have been accepted by your firm, regarding their seniority within the third charge.

Sincerely,
HYMAS INVESTMENT MANAGEMENT INC.

James Hymas
President

Update, 2008-03-24: TD is parri passu, according to their IR department:

In the event of the insolvency of The Toronto-Dominion Bank, the obligations of the Bank under any Banker’s Acceptance issued by it would rank against the unencumbered assets of the Bank on a parity with all deposit liabilities of the Bank, other than amounts due to the government of Canada or to a province thereof which shall be a first and second charge on the assets of the Bank. Under the laws of Canada, the obligations of the Bank under any Banker’s Acceptances issued by the Bank are direct liabilities of the Bank and rank at least pari passu with all unsecured, unsubordinated indebtedness of the Bank.

Update, 2008-7-18: Other references

Update, 2008-8-12: Daryl Merrett, Bank of Canada Review, 1981: The Evolution of Bankers’ Acceptances in Canada

Interesting External Papers

Understanding the Securitization of Subprime Mortgage Credit

A post today in Econbrowswer (which in turn was tipped by Calculated Risk) alerted me to a new Fed study: Understanding the Securitization of Subprime Mortgage Credit, which on first examination looks excellent.

I will admit that I have not thoroughly read the paper – I dare say it probably also took the authors more than an afternoon to research and write it – but I have had a look at some of the things that matter to me.

The authors identify seven frictions involved in the securitization process; number six – and a suggestion for mitigation – is:

Frictions between the asset manager and investor: Principal-agent [2.1.6]

  • The investor provides the funding for the MBS purchase but is typically not financially sophisticated enough to formulate an investment strategy, conduct due diligence on potential investments, and find the best price for trades. This service is provided by an asset manager (agent) who may not invest sufficient effort on behalf of the investor (principal).
  • Resolution: investment mandates and the evaluation of manager performance relative to a peer group or benchmark

This is one of the five that they highlight as causing the subprime crisis; they note:

Friction #6: Existing investment mandates do not adequately distinguish between structured and corporate ratings. Asset managers had an incentive to reach for yield by purchasing structured debt issues with the same credit rating but higher coupons as corporate debt issues.

[footnote] The fact that the market demands a higher yield for similarly rated structured products than for straight corporate bonds ought to provide a clue to the potential of higher risk.

I’m a bit confused by their footnote. Yes, there is an incentive to reach for yield; but the fact that “the market demands a higher yield for similarly rated structured products” implies that there are some managers who do not reach for yield – for one reason or another. If there weren’t, then yields for instruments of the same rating and term would be identical.

It is very tempting to think of the markets as being homogeneous – the market says this and the market says that. While there is some reason to believe that “the market” is a good predictor – whether of investment returns or election results (except in the New Hampshire primary!) – one must always remember that the market is heterogeneous and some players are better than others.

I will also note an eighth friction that is not mentioned by the authors; this is index-inclusion friction. I do not believe that this was a factor in the subprime fiasco; as the authors note:

Note that the Lehman Aggregate Index has a weight of less than one percent on non-agency MBS.

However, this kind of thing is indeed an issue. Canadian bond indices, for instance, include the banks’ Innovative Tier 1 Capital – and these things simply aren’t bonds! However – they’re included in the index. So, to the extent that a manager exercises his discretion and does not include them in a bond portfolio, he is mis-matching his portfolio. I noted early last year that quality spreads between tiers of bank paper were awfully skinny … but there are still spreads!

If I’m matched against the index and do not hold Tier 1 paper, I’m giving up yield due to my fear and – in 99 years out of 100 – I will underperform the average idiot who sees the chance to buy Royal Bank paper at a spread to other Royal Bank paper and buys the Tier 1 crap to pick up and extra 15bp. This is something James Hamilton of Econbrowser continually – and with good reason – harps on:

But who would be so foolish to have invested hundreds of billions of dollars in extra risky assets with negative expected returns? The logical answer would appear to be– someone who did not understand that they were accepting this risk.

Which brings us to the highly interesting Table 34 in section 6.1 of the report, which shows that:

the share of non-agency MBS in the total fixed-income portfolio increased from 12% (245/2022) in 2005 to 34% (740/2179) in 2006. In other words, the pension fund almost tripled its exposure to non-agency MBS. Further, note that this increase in exposure to risky MBS was at the expense of exposure to MBS backed by full faith and credit of the United States government, or an agency or instrumentality thereof, which dropped from $489.6 million to $58.9 million.

I’ll note that I don’t understand this “full faith and credit” stuff. Agency MBS are not explicitly guaranteed by the US treasury – which, again, James Hamilton has harped on:

Frame and Scott (2007) report that U.S. depository institutions face a 4% capital-to-assets requirement for mortgages held outright but only a 1.6% requirement for AA-rated mortgage-backed securities, which seems to me to reflect the (in my opinion mistaken) assumption that cross-sectional heterogeneity is currently the principal source of risk for mortgage repayment. Perhaps it’s also awkward for the Fed to declare that agency debt is riskier than Treasury debt and yet treat the two as equivalent for so many purposes.

Technically, I suppose, the authors may justify their “full faith and credit” stance with an insistence that they are talking about the full faith and credit of the GSEs … but somehow, I have the feeling that IF Fannie and Freddie go bust and IF they are not bailed out by Congress and IF large losses are experienced by investors in this paper, then the I-told-ya-so crowd will be the first to cast aspersions at portfolio managers who paid treasury prices for agency paper.

The portfolio managers discussed by Ashcraft & Schuermann made a decision that non-agency MBS were better, on a risk-reward basis, than agency MBS. It is very easy to say that the fact that this has not turned out very well so far proves that the portfolio managers were naive – but this is the sort of assessment that active portfolio managers are called upon to make as a matter of routine. Rather than focussing on this particular instance where … er … things don’t seem to have turned out so well, it would be much better to examine the portfolio management performance over a long history of such decisions and determine the manager’s skill from these data.

In fact, the authors do look at managers, fees and performance:

In 2006, the fund’s assets were 100% managed by external investment managers. The fixed income group is comprised of eight asset managers who collectively have over $2.2 trillion in assets under management (AUM). They are (with AUM in parentheses):

  • JPMorgan Investment Advisors, Inc. ($1.1 trillion, 2006)
  • Lehman Brothers Asset Management ($225 billion, 2006)
  • Bridgewater Associates ($165 billion, 2006)
  • Loomis Sayles & Company, LP ($115 billion, 2006)
  • MacKay Shields LLC ($40 billion, 2006)
  • Prima Capital Advisors, LLC ($1.8 billion, 2006)
  • Quadrant Real Estate Advisors LLC ($2.7 billion, 2006)
  • Western Asset Management ($598 billion, 2007)

The 2005 performance audit of this fund suggested that investment managers in the core fixed income portfolio are compensated 16.3 basis points. The fund paid these investment managers approximately $1.304 million in 2006 in order to manage an $800 million portfolio of investment-grade fixed-income securities. While the 2006 financial statement reports that these managers out-performed the benchmark index by 26 basis points (= 459 – 433), this was accomplished in part through a significant reallocation of the portfolio from relatively safe to relatively risk non-agency mortgage-backed securities. One might note that after adjusting for the compensation of asset managers, this aggressive strategy netted the pension fund only 10 basis points of extra yield relative to the benchmark index, for about $2.1 million.

Look at all those name-brand asset managers with 12-figure AUMs! One wonders what the long-term performance of these managers is; and particularly, how this performance was achieved. I should also point out that I know for a fact that working for a name-brand company is not particularly well correlated with investment management skill – quite the opposite, in my experience.

Update: Oh, and another thing! The researchers gleefully imply the portfolio managers in question are dumb yumps who ignorantly reached for yield, but do not provide a lot of details. According to Table 34, all – every single dollar’s worth – of the non-agency MBS was rated A- or better; no further details are given. Given the nature of the market, the nature of the managers and the nature of the investor, I will bet a nickel that the lion’s share (if not all) of this paper is comprised of AAA tranches.

These have taken a price thumping in the past year, but credit quality – as far as I can tell – of the AAA tranches remains pretty good. Maybe not AAA, but not junk, either. It will be most interesting to learn what the ultimate return on this paper is, if held to maturity.

I’ll tell you a little story, for instance. I’m involved with a real-money account that holds about $750,000 worth of paper issued by a subsidiary of, and ultimately guaranteed by, a major US-based financial firm. I tried to sell it … couldn’t get a bid.

Couldn’t. Even. Get. A. Damned. Bid.

So … for now, anyway, the client’s going to hold it. It’s still good quality paper. More liquid paper with the same guarantor trades around 6%.

What price should this paper be marked at? Am I an idiot for recommending its purchase last year? If it matures at par, do I then become a genius?

Update, 2008-01-12: Out of the kindness of my heart, I’m going to suggest another topic for a Master’s thesis. Here’s what I want you to do … get bond prices for an enormous variety of corporates (the index prepararers would be a good place to get these data) and slice it up into tranches based on yield and term. So now you’ve got a variety of market-based yield groups … say number 1 is “4.5-5.5 year term, 5.00% to 5.25% yield” and so on.

Now what I want you to do is follow each tranche to maturity and determine its total return over the period.

The questions are: (i) Do ex-ante yields predict ex-post returns?

(ii) Do these results tie in with other work that seeks to analyze bond yields in terms of risk-free rate, liquidity and default risk? The Bank of England has published some of the results of such work, but (a) they’re more interested in junk credits, and (b) I haven’t seen their source data, or (I am ashamed to admit) thoroughly read their source documents.

(iii) How risky is liquidity risk? This is the interesting part. I contend that most investors, particularly pension funds, are way more liquid than they have to be, in large part due to the way in which actuarial work is done, with all the liabilities being discounted at the long bond yield. To move the critical point to an extreme, consider a bond with a thirty-year term that cannot be sold (don’t laugh! The Canada Pension Plan used to be invested in these things!). Isn’t such a bond simply an equity with a poor return?

(iv) If investment mandates call for a given proportion of bonds, should there be elaboration of the liquidity requirement? Let us make some assumptions about the portfolio discussed above: (a) the non-agency paper, due to credit enhancements, is perfectly good from a credit standpoint, and (b) the ex-ante liquidity premium will be captured, 100% on maturity, and (c) the paper, ex-post, is way less liquid than the ex-ante assumption. In such a case, the investment returns of the portfolio will exceed the benchmark for the period of the investment. However, there will have been more interim risk. Is there a good way to describe this?

Update, 2008-2-7: Discussion with a reader has clarified a better way of expressing part of the above (2008-1-12 Update) idea: use the Moody’s Implied Ratings to compute GINI coefficients at industry-standard time-horizons. Also, check the volatility of the these ratings. Moody’s may have already done this … I really don’t know.

Anyway, I’ll bet a nickel that Moody’s assigned ratings are better than Moody’s implied ratings under these two metrics.

Update, 2008-2-8: Further discussion and thought! The idea that yield spreads are well-correlated with credit risk has been examined by the Cleveland Fed, with the idea that bank supervision would be improved if every bank had at least one sub-debt issue that would trade in the market, providing information to the Fed. According to the Cleveland Fed, this is not yet a reliable measure.

On the other hand, one would (well … could!) expect faster and more predictable refinancing for subprime-ARMs relative to “normal” prime mortgages, with everybody trying to refinance as soon as the teaser rate expired. This would lead to more predictable cash flows and less negative convexity for these instruments, which should imply a lower required yield, which would be REALLY hard to pick apart from the credit risk.

Interesting External Papers

Willem Buiter's Prescription

Willem Buiter of the London School of Economics has authored Lessons from the 2007 Financial Crisis, published by the Centre for Economic Policy Research.

The paper includes one thoroughly delicious quote that shows the author understands the nature of regulation:

Because Sarbanes-Oxley compliance is mainly a matter of box-ticking (like most realworld compliance, especially compliance originating in the USA), it has not materially improved the informational value of accounting or the protection offered to investors.

All in all, the essay is extremely good … I may not agree with all of it, but the man makes some good points and has some well-founded opinions. I’ll present some quotes from the essay with my own thoughts … but the full document is well worth reading.

There is a long section on the credit rating agencies. Mr. Buiter states as problems:

  • Any model of credit risk will have flaws and these flaws may be exploited by issuers. Even honest models won’t work particularly well during black swan events.
  • Only default risk is rated – not market risk and not liquidity risk
  • agencies are conflicted, in that:
    • they are paid by the issuers
    • they sell advisory services to their rating service clients
    • the complexity of some instruments results in designer and issuer working with the same model … possibly one designed by the issuer

To Mr. Buiter’s credit, he does not attempt to solve the first two problems with rhetoric:

There is no obvious solution other than ‘try harder and don’t pretend to know more than you know’ for the first problem. The second problem requires better education of the investing public.

His third problem, which has three facets, has a five part solution:

  • Reputational concerns
  • Remove the CRA’s quasi-regulatory role
  • Make the CRAs one-product firms
  • End payment by issuer
  • Increase competition

I don’t have a major problem with the idea of removing the CRAs’ quasi-regulatory role (their ratings are a factor in determining the credit conversion factor that converts the total value of the loan to risk-weighted assets), but Mr. Buiter is not clear on what is to replace the current system.

It seems clear that a loan to IBM is safer than a loan to Joe’s Barbershop; it also seems clear that this difference should have an effect on the measured risk profile of the bank. I suggest that the CRAs have a very good track record in assessing these risks – and yes, I am including the subprime & Enron debacles when reviewing their record.

The thing about risk, you see, is that it’s risky.

With respect to his third proposition, making the CRAs one-product firms … how is he going to enforce this and why would he want to? Yesterday we saw extremely poor performance by the CIBC preferred issues. I will suggest that some portion of this, at least, was due to stockbrokers telling their clients that CIBC was a relatively poor credit (relative to other banks, and relative to their financial position last year at this time) and exposure to it should be minimized. In such a case, the stockbroker is acting as a Credit Rating Agency.

In the absence of a regulatory role for CRAs, how is one to differentiate between a one-product-by-regulation firm and … anybody else?

His proposal for ending issuer payment is so convoluted I will reproduce it in full, to avoid charges of mockery by misquotation:

Payment by the buyer (the investors) is desirable but subject to a ‘collective action’ or ‘free rider’ problem. One solution would be to have the ratings paid for by a representative body for the (corporate) investor side of the market. This could be financed through a levy on the firms in the industry. Paying the levy could be made mandatory for all firms in a regulated industry. Conceivably, the security issuers could also be asked to contribute. Conflict of interest is avoided as long as no individual issuer pays for his own ratings. This would leave some free rider problems, but should permit a less perverse incentivised rating process to get off the ground. I don’t think it would be necessary (or even make sense) to socialise the rating process, say by creating a state-financed (or even industryfinanced) body with official and exclusive powers to provide the ratings.

Frankly, I don’t understand why his proposed solution, involving mandatory payments by firms in the industry, is different from the socialization he decries. There may also be some conflict with his proposal to emphasize reputational concerns and competition … how do I go about getting some of the lolly? Can I just declare to the central body that I am a credit rater, that will be $500,000 please?

Reputational concerns and competition currently work along the lines of … some firms are better regarded by investors than others. I, for instance, have greater respect for Fitch and Moody’s than for S&P and DBRS … give me my choice of any two ratings on a bond, and you know which ones I’ll pay attention to! How would this be reflected in such a centralized system?

In the end, I have to reiterate my familiar refrain: Credit Ratings are Advice. Take it, leave it, your choice. So far, the Bank of Canada has said it best:

investors should not lose sight of the fact that one can delegate tasks but not accountability.

After reviewing the macroeconomic situation he makes further proposals, including:

if a financial institution borrows short and lends long, if it borrows liquid (during normal times, but with the risk of occasional illiquidity in its usual funding channels) and lends illiquid, and if banks are substantially exposed to it, then it should be regulated like a bank, even if it says ‘Hedge Fund’ on the letterhead. The rules should aggressively chase the unceasing attempts, through institutional and instrument innovation, to avoid regulation.

I disagree with this, particularly with the implicit belief that rules exist in order that they be followed. The weak point of the argument here is “if banks are substantially exposed to it“. It does seem likely that there has been far too much contagion in the past crisis, but regulating the universe is not the proper answer. What should be done is to improve the capital requirement rules and force the banks to make a more substantial capital provision for their riskier assets – such as Mr. Buiter implies is a good description for their hedge fund exposure.

If the risk weights applied to, for instance, the provision of a global liquidity line to a SIV have been shown to be inadequate (and this has not been documented, although I suspect that it is the case) … increase the risk weight of the line! Currently it’s at a flat 10% … I suggest that a tiering be considered, so that a bank with $10-billion of tier 1 capital can extend such a line for $10-billion at the 10% rate, but the next ten billion is charged at a 20% rate, etc.

Ensuring that everything is regulated is poor policy. Let us ensure that the core of the financial system – the banks, who have access to lines provided by the central banks – is secure, and then let people play around on the edges to their, and their investors’, hearts’ content.

The main problem with the arrangement [separating bank supervision functions from liquidity provision functions] is that it puts the information about individual banks in a different agency (the FSA) from the agency with the liquid financial resources to provide short-term assistance to a troubled bank (the Bank of England). This happened when the Bank lost banking sector supervision and regulatory responsibility on being made operationally independent for monetary policy by Gordon Brown in 1997. It’s clear this separation of information and resources does not work.

This issue was discussed on December 5.

Liquidity can vanish today, because market participants with surplus liquidity fear that both they themselves and their potential counterparties will be illiquid in the future (say, three months from now), when the loans would have to be repaid. A credible commitment by the Central Bank to provide liquidity in the future (three months from now) would solve the problem, but it is apparent that the required credibility simply does not exist. Therefore, the only time-consistent solution, in the absence of a credible commitment mechanism, is to intervene today at a three-month maturity.

One lesson – that Canadian non-bank ABCP investors will be happy to explain thoroughly – from the current crisis is that liquidity risk is different from credit risk. Traditionally, LIBOR spreads are explained in terms of credit risk – I suggest that liquidity risk is the operational concern and that liquidity hoarding is its sympton. I remember on anecdote from the Panic of 1907 … a banker complained to J.P. Morgan that his liquid assets had been eroded to 18% … Morgan gave him the what-for, telling him that liquid assets were held precisely for such circumstances.

If a bank’s afraid to make three-month interbank loans because it might have its credit lines drawn on in the intervening time, then part of the problem is that it has too many lines – a problem that would be addressed by higher capital charges.

To address the point, however, I have no problem with, for instance, a regular three month term facility, to be financed with treasury bills as a neutralizer.

Capitalism, based on greed, private property rights and decentralised decision making, is both cyclical and subject to bouts of financial manic-depressive illness. There is no economy-wide auctioneer, no enforcer of systemic ‘transversality conditions’ to rule out periodic explosive bubble behaviour of asset prices in speculative
markets. It’s unfortunate, but we have to live with it. The last time humanity tried to do away with these excesses of capitalism, we got central planning, and we all know now how well that worked. Hayek and Keynes were both right.

Hear, hear!

All in all, a fine article.

Interesting External Papers

Bank of Canada Discusses Credit Rating Agencies

The Bank of Canada has released the December 2007 Financial System Review which includes a review of the Credit Rating Agency issue by Mark Zelmer, the Director of the Financial Risk Office.

Frankly, it’s a bit wishy-washy, but does summarize the various issues in a well-structured manner. Mr. Zelmer concludes:

In the end though, investors need to accept responsibility for managing credit risk in their portfolios. While complex instruments such as structured products enhance the benefits to be gained from relying on credit ratings, investors should not lose sight of the fact that one can delegate tasks but not accountability. Suggestions such as rating structured products on a different rating scale could be helpful, in that this may encourage investors to think twice before investing in such complex instruments. Nevertheless, investors still need to understand the products they invest in, so that they can critically review the credit opinions provided by the rating agencies.