A story on Bloomberg brought to my attention a Morningstar study titled 2015 Fee Study: Investors Are Driving Expense Ratios Down:
- Investors are paying less for fund management, largely as a matter of choice.
- The asset-weighted expense ratio across all funds was 0.64% in 2014, down from 0.65% in 2013
and 0.76% five years ago.- Investors are choosing low-cost funds. Over the past decade, 95% of all flows have gone into funds in the lowest-cost quintile. Passive funds have benefited disproportionately.
- Investors continue to move away from load-based share classes while typically lower-cost share classes, such as Institutional shares, have gained favor.
- Firms sponsoring lineups with lower asset-weighted expense ratios—most notably Vanguard—have gained market share during the past five years.
- Over the past five years, 63% of the fund share classes and exchange-traded products in our universe reduced their expense ratio, but only about 24% of them saw their fee fall by more than 10%.
- Meanwhile, 21% of the share classes we examined ratcheted up their takes.
- Estimated industry fee revenue is at an all-time high, reaching $88 billion in 2014, up from $50 billion 10 years ago.
- During that 10-year period, industry assets under management increased 143% while the asset weighted expense ratio declined 27% and industry fee revenue grew by approximately 78%.
- Thus, the industry—rather than fund shareholders—has benefitted most from the increase in asset under management.
…
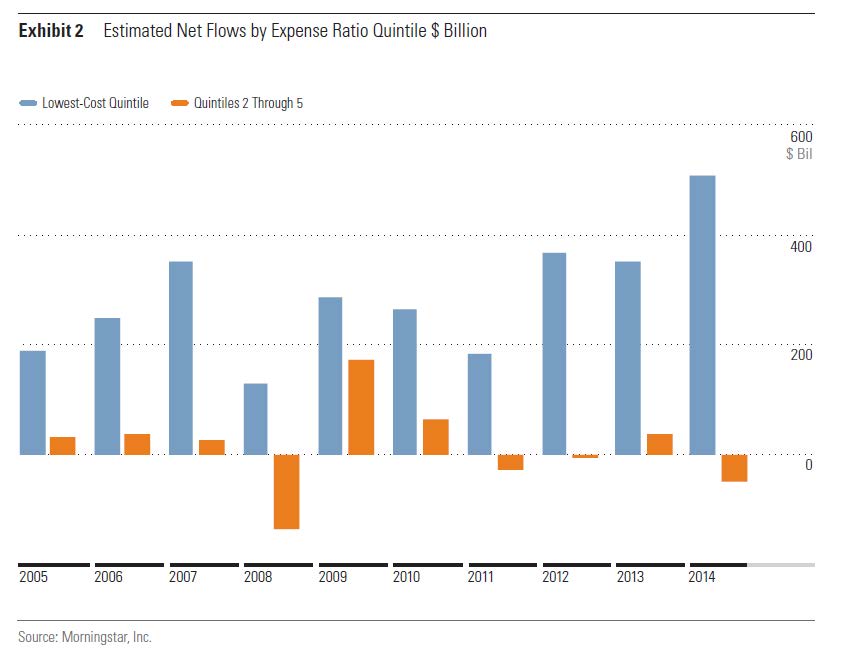
During the past decade, low-cost funds have been attracting far more inflows than their more expensive peers. This has helped to reduce the industry’s average asset-weighted expense ratio over time. Mutual funds and ETPs with expense ratios ranking in the least-expensive quintile of all funds attracted an aggregate $3.03 trillion of estimated net inflows during the past 10 years, compared with just $160 billion for funds in the remaining four quintiles. That is to say that 95% of all flows have gone into funds in the lowest-cost quintile. Passive funds (mutual funds and ETPs) have been prominent recipients of the capital flowing into low-cost funds. Compared with funds falling in cost quintiles 2 through 5, funds in the lowest-cost quintile are more likely to be index funds.
Click For Big
Note that in the US trailers are referred to as 12b-1 fees. The SEC is attemting to ensure that the paperwork associated with such fees is maximized.
Investor Advocates – generally more accurately referred to as “Increased Employment Of Regulators Advocates”, or “Paid Stalking Horses For Regulators” or simply as “Blowhards Without Brains, Knowledge Or Mandate” – will be horrified at the notion that investors are migrating to lower-cost funds without the benefit of increased regulation.
BNS Split Corp. II, proud issuer of BSC.PR.B, has been confirmed at Pfd-2 by DBRS:
The dividends received from the Portfolio are used to pay a fixed cumulative quarterly distribution of $0.2003 per share to holders of the Class B Preferred Shares, yielding approximately 4.25% annually on the initial issue price of $18.85. The current yield on the Portfolio shares fully covers the Class B Preferred Share dividends, providing dividend coverage (net of expenses) of approximately 2.5 times. The Class A Capital Shares receive all excess dividend income after the Class B Preferred Share distributions and other expenses of the Company have been paid.
The performance of the Company has been somewhat volatile since the last rating action. However, downside protection did increase to 68.2% on April 16, 2015, compared with 67.5% on April 10, 2014. A recent increase in dividend distributions from the Bank of Nova Scotia helped boost the dividend coverage ratio. As a result, the rating of the Class B Preferred Shares has been confirmed at Pfd-2.
It was a violently mixed day for the Canadian preferred share market, with PerpetualDiscounts down 33bp, FixedResets gaining 81bp and DeemedRetractibles off 4bp. The Performance Highlights table is, predictably, stuffed full of winning FixedResets, with ENB, BAM and TRP issues well represented. Volume was average.
For as long as the FixedReset market is so violently unsettled, I’ll keep publishing updates of the more interesting and meaningful series of FixedResets’ Implied Volatilities. This doesn’t include Enbridge because although Enbridge has a large number of issues outstanding, all of which are quite liquid, the range of Issue Reset Spreads is too small for decent conclusions. The low is 212bp (ENB.PR.H; second-lowest is ENB.PR.D at 237bp) and the high is a mere 268 for ENB.PF.G.
Remember that all rich /cheap assessments are:
» based on Implied Volatility Theory only
» are relative only to other FixedResets from the same issuer
» assume constant GOC-5 yield
» assume constant Implied Volatility
» assume constant spread
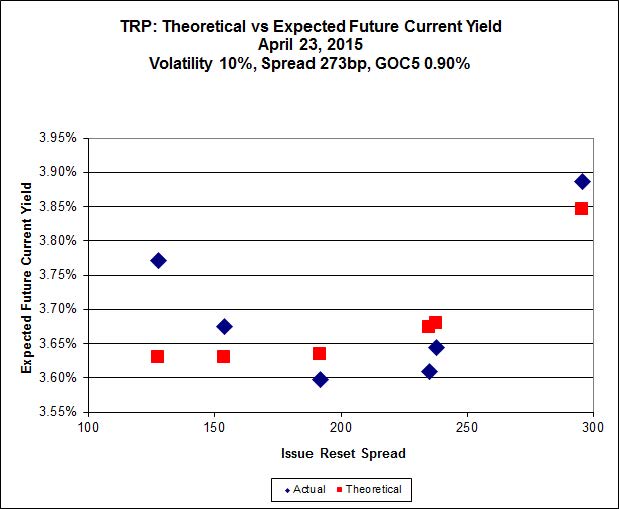
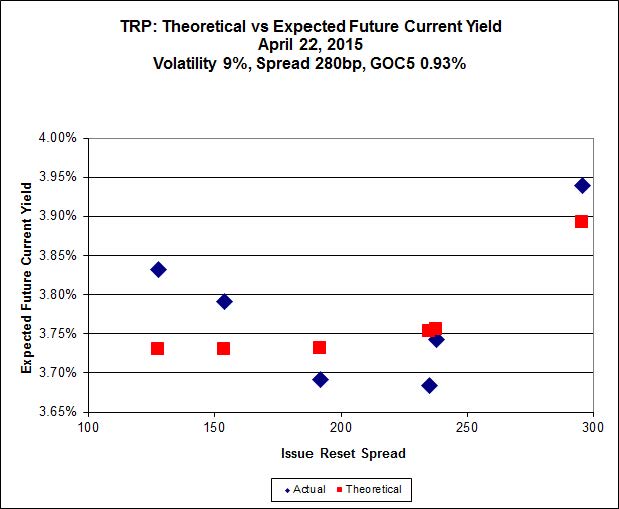
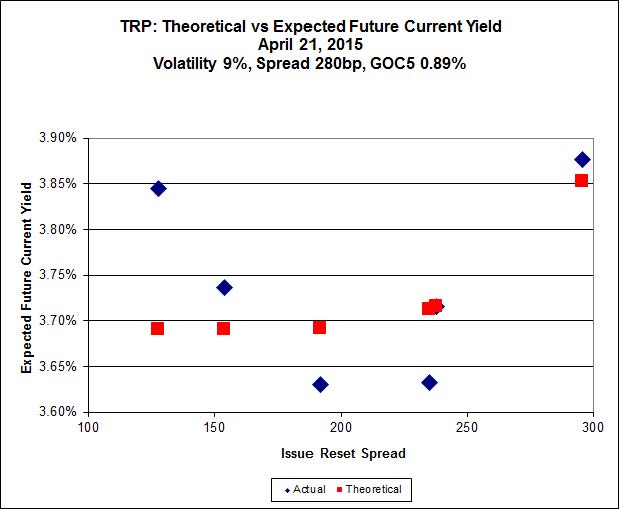
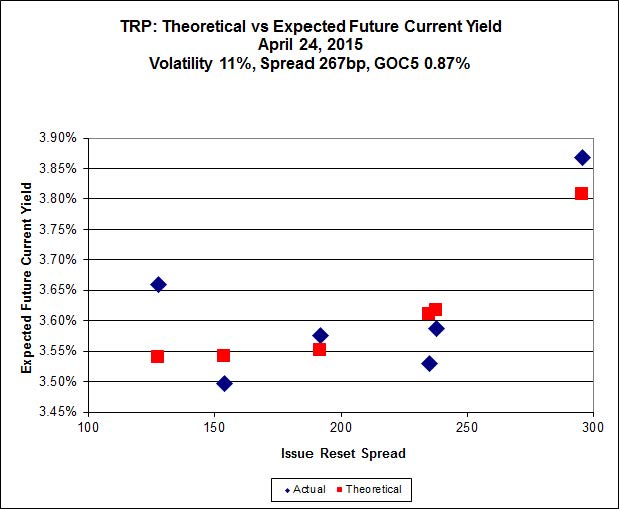
Here’s TRP:
Click for Big
TRP.PR.E, which resets 2019-10-30 at +235, is bid at 22.81 to be $0.51 rich, while TRP.PR.B, resetting 2015-6-30 at +128, is $0.49 cheap at its bid price of 14.69.

Click for Big
Another excellent fit (despite a sharp increase in Implied Volatility today), but the numbers are perplexing. Implied Volatility for MFC continues to be a conundrum, although it declined substantially today. It is still too high if we consider that NVCC rules will never apply to these issues; it is still too low if we consider them to be NVCC non-compliant issues (and therefore with Deemed Maturities in the call schedule).
Most expensive is MFC.PR.M, resetting at +236 on 2019-12-19, bid at 23.40 to be $0.45 rich, while MFC.PR.L, resetting at +216bp on 2019-6-19, is bid at 21.44 to be $0.70 cheap.
Click for Big
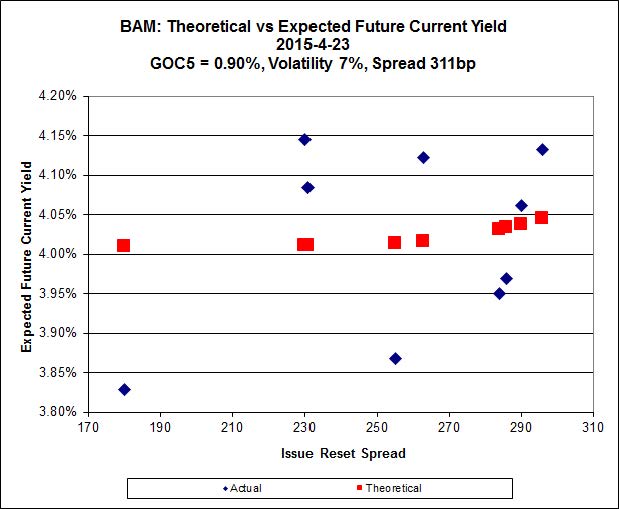
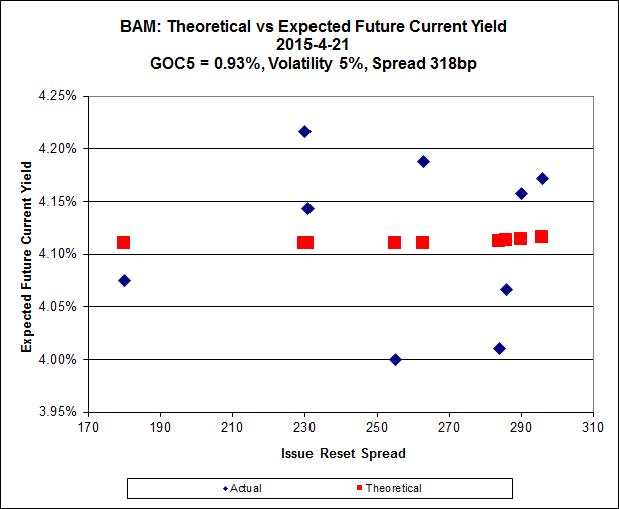
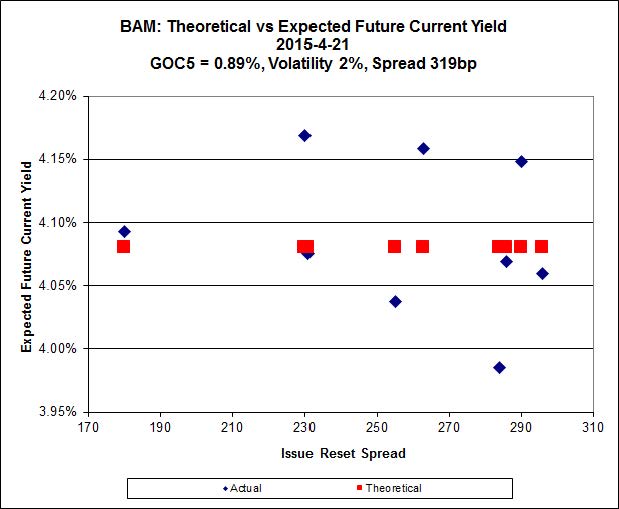
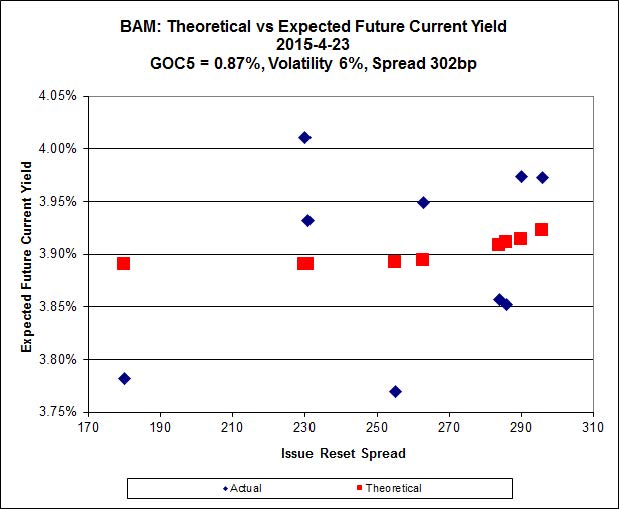
The cheapest issue relative to its peers is BAM.PR.R, resetting at +230bp on 2016-6-30, bid at 19.76 to be $0.61 cheap. BAM.PF.E, resetting at +255bp 2020-3-31 is bid at 22.68 and appears to be $0.71 rich.
Click for Big
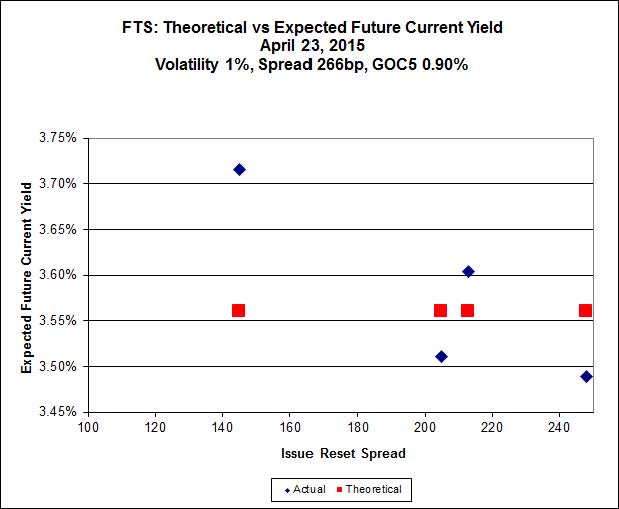
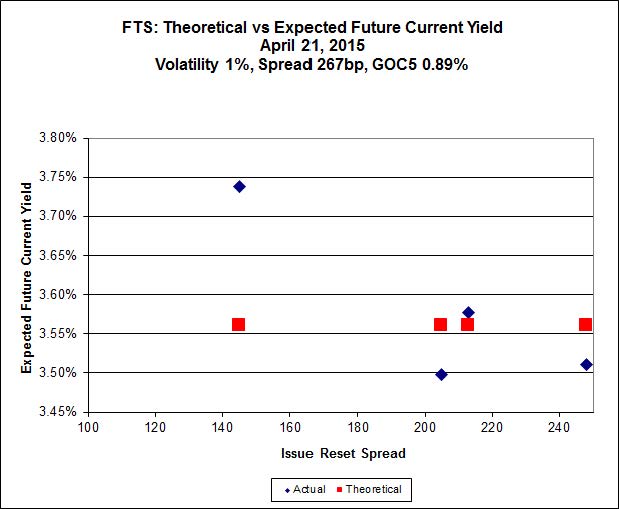
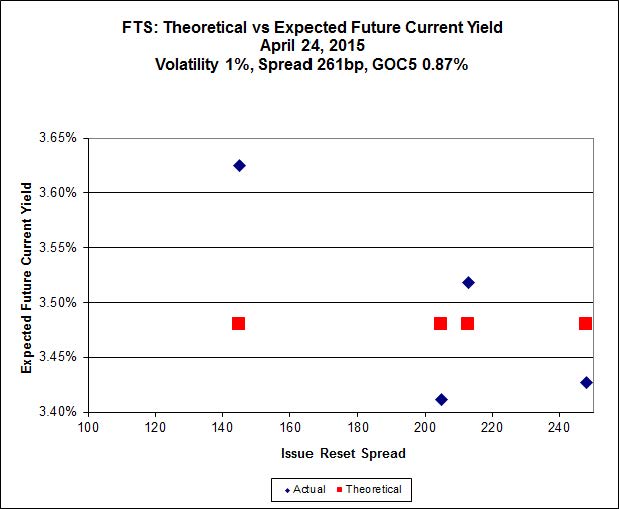
FTS.PR.H, with a spread of +145bp, and bid at 16.00, looks $0.67 cheap and resets 2015-6-1. FTS.PR.K, with a spread of +205bp and resetting 2019-3-1, is bid at 21.40 and is $0.42 rich.
Click for Big
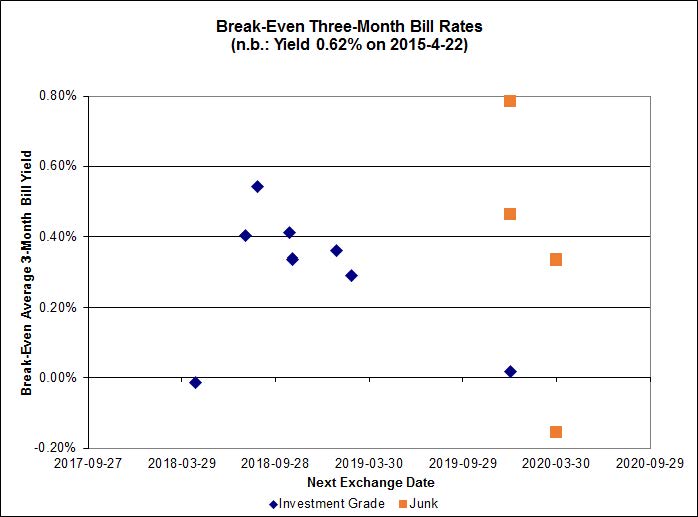
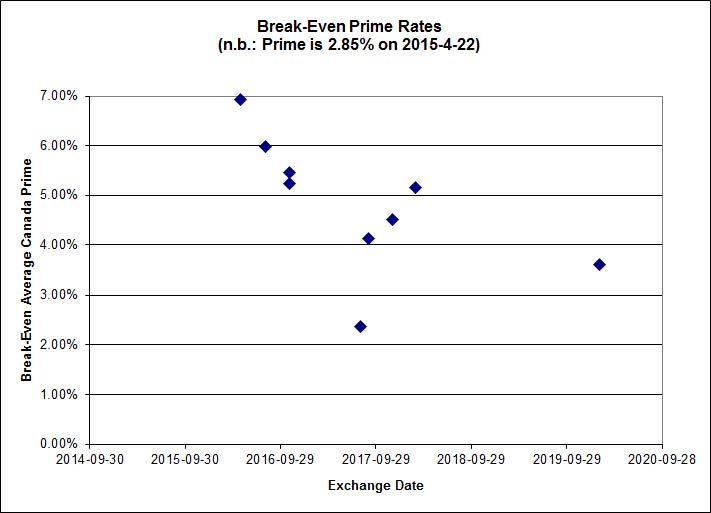
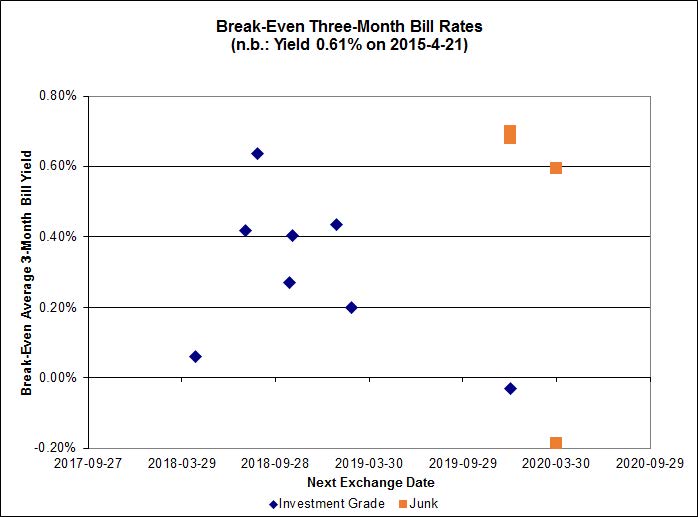
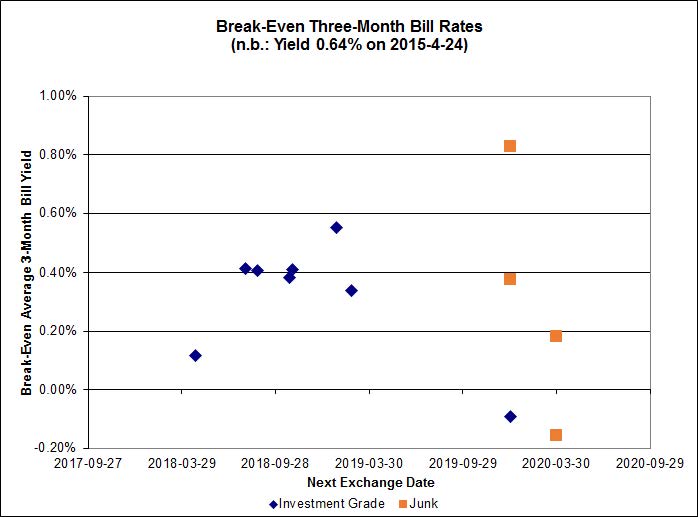
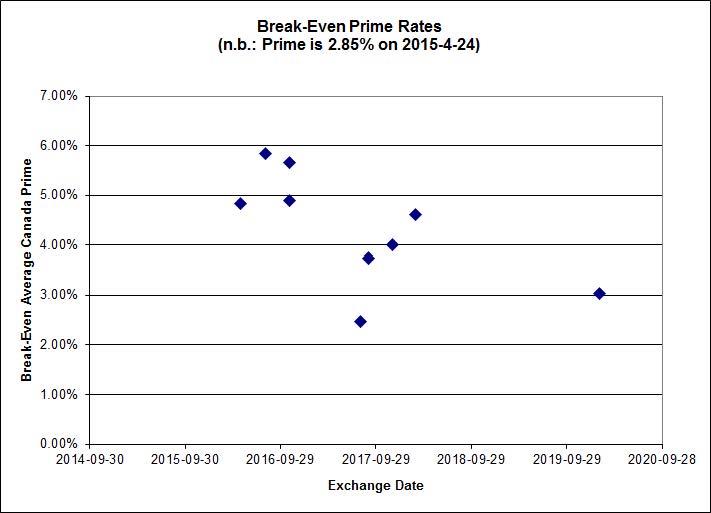
Investment-grade pairs now predict an average over the next five years of about 0.40%, but TRP.PR.A / TRP.PR.F is an outlier at -0.09% The DC.PR.B / DC.PR.D pair retains its customary outlier status, with a breakeven rate of -1.41%0.
Click for Big
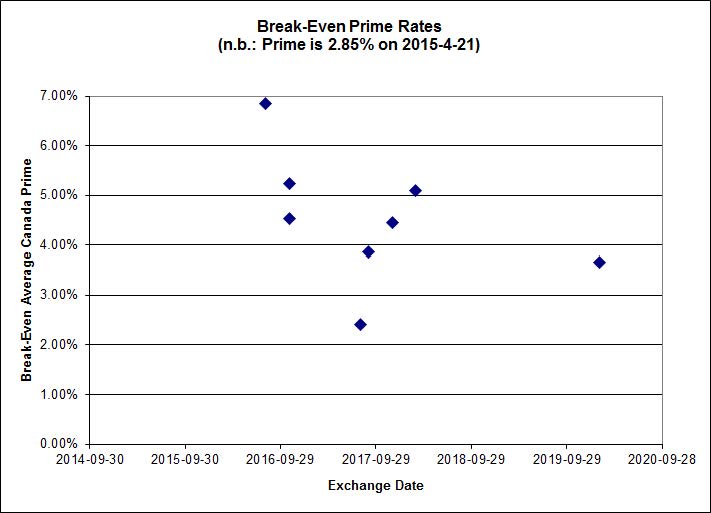
Shall we just say that this exhibits a high level of confidence in the continued rapacity of Canadian banks?
| HIMIPref™ Preferred Indices These values reflect the December 2008 revision of the HIMIPref™ Indices Values are provisional and are finalized monthly |
|||||||
| Index | Mean Current Yield (at bid) |
Median YTW |
Median Average Trading Value |
Median Mod Dur (YTW) |
Issues | Day’s Perf. | Index Value |
| Ratchet | 0.00 % | 0.00 % | 0 | 0.00 | 0 | -0.6534 % | 2,158.1 |
| FixedFloater | 0.00 % | 0.00 % | 0 | 0.00 | 0 | -0.6534 % | 3,773.3 |
| Floater | 3.36 % | 3.57 % | 56,571 | 18.37 | 4 | -0.6534 % | 2,294.2 |
| OpRet | 4.43 % | -1.55 % | 40,480 | 0.10 | 2 | -0.0197 % | 2,762.1 |
| SplitShare | 4.57 % | 4.61 % | 66,590 | 3.39 | 3 | 0.0267 % | 3,224.6 |
| Interest-Bearing | 0.00 % | 0.00 % | 0 | 0.00 | 0 | -0.0197 % | 2,525.6 |
| Perpetual-Premium | 5.34 % | 3.25 % | 65,701 | 0.09 | 25 | -0.0539 % | 2,513.6 |
| Perpetual-Discount | 5.13 % | 5.10 % | 139,637 | 15.00 | 9 | -0.3251 % | 2,782.2 |
| FixedReset | 4.55 % | 3.89 % | 299,839 | 16.48 | 86 | 0.8061 % | 2,342.6 |
| Deemed-Retractible | 4.92 % | 3.46 % | 111,549 | 0.82 | 36 | -0.0365 % | 2,646.3 |
| FloatingReset | 2.58 % | 2.94 % | 72,209 | 6.22 | 8 | -0.1121 % | 2,347.5 |
| Performance Highlights | |||
| Issue | Index | Change | Notes |
| BAM.PR.K | Floater | -1.72 % | YTW SCENARIO Maturity Type : Limit Maturity Maturity Date : 2045-04-24 Maturity Price : 13.74 Evaluated at bid price : 13.74 Bid-YTW : 3.65 % |
| PWF.PR.T | FixedReset | 1.06 % | YTW SCENARIO Maturity Type : Limit Maturity Maturity Date : 2045-04-24 Maturity Price : 23.23 Evaluated at bid price : 24.87 Bid-YTW : 3.32 % |
| IFC.PR.A | FixedReset | 1.08 % | YTW SCENARIO Maturity Type : Hard Maturity Maturity Date : 2025-01-31 Maturity Price : 25.00 Evaluated at bid price : 19.71 Bid-YTW : 6.05 % |
| ENB.PR.Y | FixedReset | 1.10 % | YTW SCENARIO Maturity Type : Limit Maturity Maturity Date : 2045-04-24 Maturity Price : 19.30 Evaluated at bid price : 19.30 Bid-YTW : 4.50 % |
| ENB.PR.P | FixedReset | 1.12 % | YTW SCENARIO Maturity Type : Limit Maturity Maturity Date : 2045-04-24 Maturity Price : 19.92 Evaluated at bid price : 19.92 Bid-YTW : 4.46 % |
| FTS.PR.H | FixedReset | 1.20 % | YTW SCENARIO Maturity Type : Limit Maturity Maturity Date : 2045-04-24 Maturity Price : 16.00 Evaluated at bid price : 16.00 Bid-YTW : 3.68 % |
| ENB.PF.A | FixedReset | 1.23 % | YTW SCENARIO Maturity Type : Limit Maturity Maturity Date : 2045-04-24 Maturity Price : 20.65 Evaluated at bid price : 20.65 Bid-YTW : 4.60 % |
| ENB.PR.J | FixedReset | 1.29 % | YTW SCENARIO Maturity Type : Limit Maturity Maturity Date : 2045-04-24 Maturity Price : 20.37 Evaluated at bid price : 20.37 Bid-YTW : 4.54 % |
| ENB.PF.C | FixedReset | 1.32 % | YTW SCENARIO Maturity Type : Limit Maturity Maturity Date : 2045-04-24 Maturity Price : 20.65 Evaluated at bid price : 20.65 Bid-YTW : 4.60 % |
| TRP.PR.E | FixedReset | 1.33 % | YTW SCENARIO Maturity Type : Limit Maturity Maturity Date : 2045-04-24 Maturity Price : 22.19 Evaluated at bid price : 22.81 Bid-YTW : 3.74 % |
| CIU.PR.C | FixedReset | 1.40 % | YTW SCENARIO Maturity Type : Limit Maturity Maturity Date : 2045-04-24 Maturity Price : 15.93 Evaluated at bid price : 15.93 Bid-YTW : 3.68 % |
| TD.PF.A | FixedReset | 1.40 % | YTW SCENARIO Maturity Type : Limit Maturity Maturity Date : 2045-04-24 Maturity Price : 22.73 Evaluated at bid price : 23.83 Bid-YTW : 3.37 % |
| BAM.PF.A | FixedReset | 1.41 % | YTW SCENARIO Maturity Type : Limit Maturity Maturity Date : 2045-04-24 Maturity Price : 22.78 Evaluated at bid price : 23.72 Bid-YTW : 4.08 % |
| ENB.PR.F | FixedReset | 1.41 % | YTW SCENARIO Maturity Type : Limit Maturity Maturity Date : 2045-04-24 Maturity Price : 19.40 Evaluated at bid price : 19.40 Bid-YTW : 4.56 % |
| PWF.PR.P | FixedReset | 1.42 % | YTW SCENARIO Maturity Type : Limit Maturity Maturity Date : 2045-04-24 Maturity Price : 17.90 Evaluated at bid price : 17.90 Bid-YTW : 3.58 % |
| FTS.PR.G | FixedReset | 1.43 % | YTW SCENARIO Maturity Type : Limit Maturity Maturity Date : 2045-04-24 Maturity Price : 21.32 Evaluated at bid price : 21.32 Bid-YTW : 3.74 % |
| TD.PF.C | FixedReset | 1.51 % | YTW SCENARIO Maturity Type : Limit Maturity Maturity Date : 2045-04-24 Maturity Price : 22.56 Evaluated at bid price : 23.50 Bid-YTW : 3.41 % |
| ENB.PR.D | FixedReset | 1.53 % | YTW SCENARIO Maturity Type : Limit Maturity Maturity Date : 2045-04-24 Maturity Price : 19.20 Evaluated at bid price : 19.20 Bid-YTW : 4.44 % |
| MFC.PR.N | FixedReset | 1.54 % | YTW SCENARIO Maturity Type : Hard Maturity Maturity Date : 2025-01-31 Maturity Price : 25.00 Evaluated at bid price : 23.10 Bid-YTW : 4.55 % |
| BAM.PF.G | FixedReset | 1.61 % | YTW SCENARIO Maturity Type : Limit Maturity Maturity Date : 2045-04-24 Maturity Price : 22.79 Evaluated at bid price : 24.05 Bid-YTW : 4.01 % |
| CM.PR.P | FixedReset | 1.62 % | YTW SCENARIO Maturity Type : Limit Maturity Maturity Date : 2045-04-24 Maturity Price : 22.75 Evaluated at bid price : 23.90 Bid-YTW : 3.33 % |
| MFC.PR.K | FixedReset | 1.64 % | YTW SCENARIO Maturity Type : Hard Maturity Maturity Date : 2025-01-31 Maturity Price : 25.00 Evaluated at bid price : 21.75 Bid-YTW : 5.14 % |
| TRP.PR.B | FixedReset | 1.66 % | YTW SCENARIO Maturity Type : Limit Maturity Maturity Date : 2045-04-24 Maturity Price : 14.69 Evaluated at bid price : 14.69 Bid-YTW : 3.69 % |
| BAM.PF.E | FixedReset | 1.70 % | YTW SCENARIO Maturity Type : Limit Maturity Maturity Date : 2045-04-24 Maturity Price : 22.09 Evaluated at bid price : 22.68 Bid-YTW : 4.03 % |
| FTS.PR.K | FixedReset | 1.86 % | YTW SCENARIO Maturity Type : Limit Maturity Maturity Date : 2045-04-24 Maturity Price : 21.40 Evaluated at bid price : 21.40 Bid-YTW : 3.70 % |
| BAM.PF.F | FixedReset | 2.24 % | YTW SCENARIO Maturity Type : Limit Maturity Maturity Date : 2045-04-24 Maturity Price : 22.91 Evaluated at bid price : 24.21 Bid-YTW : 3.97 % |
| HSE.PR.A | FixedReset | 2.25 % | YTW SCENARIO Maturity Type : Limit Maturity Maturity Date : 2045-04-24 Maturity Price : 15.90 Evaluated at bid price : 15.90 Bid-YTW : 4.26 % |
| BAM.PR.R | FixedReset | 2.38 % | YTW SCENARIO Maturity Type : Limit Maturity Maturity Date : 2045-04-24 Maturity Price : 19.76 Evaluated at bid price : 19.76 Bid-YTW : 4.21 % |
| ENB.PR.H | FixedReset | 2.63 % | YTW SCENARIO Maturity Type : Limit Maturity Maturity Date : 2045-04-24 Maturity Price : 17.92 Evaluated at bid price : 17.92 Bid-YTW : 4.50 % |
| BAM.PR.T | FixedReset | 2.90 % | YTW SCENARIO Maturity Type : Limit Maturity Maturity Date : 2045-04-24 Maturity Price : 20.22 Evaluated at bid price : 20.22 Bid-YTW : 4.13 % |
| BAM.PR.Z | FixedReset | 3.21 % | YTW SCENARIO Maturity Type : Limit Maturity Maturity Date : 2045-04-24 Maturity Price : 23.07 Evaluated at bid price : 24.10 Bid-YTW : 4.07 % |
| BAM.PF.B | FixedReset | 3.50 % | YTW SCENARIO Maturity Type : Limit Maturity Maturity Date : 2045-04-24 Maturity Price : 21.80 Evaluated at bid price : 22.16 Bid-YTW : 4.12 % |
| TRP.PR.C | FixedReset | 3.80 % | YTW SCENARIO Maturity Type : Limit Maturity Maturity Date : 2045-04-24 Maturity Price : 17.23 Evaluated at bid price : 17.23 Bid-YTW : 3.60 % |
| MFC.PR.F | FixedReset | 4.29 % | YTW SCENARIO Maturity Type : Hard Maturity Maturity Date : 2025-01-31 Maturity Price : 25.00 Evaluated at bid price : 18.25 Bid-YTW : 6.35 % |
| Volume Highlights | |||
| Issue | Index | Shares Traded |
Notes |
| TD.PF.E | FixedReset | 547,300 | New issue settled today. YTW SCENARIO Maturity Type : Limit Maturity Maturity Date : 2045-04-24 Maturity Price : 23.10 Evaluated at bid price : 24.91 Bid-YTW : 3.62 % |
| FTS.PR.H | FixedReset | 498,240 | RBC crossed blocks of 244,400 and 244,200, both at 15.96. YTW SCENARIO Maturity Type : Limit Maturity Maturity Date : 2045-04-24 Maturity Price : 16.00 Evaluated at bid price : 16.00 Bid-YTW : 3.68 % |
| TRP.PR.B | FixedReset | 169,011 | TD crossed two blocks of 80,000 each, both at 14.72. YTW SCENARIO Maturity Type : Limit Maturity Maturity Date : 2045-04-24 Maturity Price : 14.69 Evaluated at bid price : 14.69 Bid-YTW : 3.69 % |
| TRP.PR.C | FixedReset | 127,500 | TD crossed two blocks of 52,200 each, both at 16.80. YTW SCENARIO Maturity Type : Limit Maturity Maturity Date : 2045-04-24 Maturity Price : 17.23 Evaluated at bid price : 17.23 Bid-YTW : 3.60 % |
| SLF.PR.G | FixedReset | 83,050 | Desjardins crossed 48,100 at 16.45. YTW SCENARIO Maturity Type : Hard Maturity Maturity Date : 2025-01-31 Maturity Price : 25.00 Evaluated at bid price : 16.50 Bid-YTW : 7.25 % |
| TRP.PR.D | FixedReset | 74,275 | Desjardins crossed 65,000 at 22.95. YTW SCENARIO Maturity Type : Limit Maturity Maturity Date : 2045-04-24 Maturity Price : 22.13 Evaluated at bid price : 22.65 Bid-YTW : 3.72 % |
| There were 36 other index-included issues trading in excess of 10,000 shares. | |||
| Wide Spread Highlights | ||
| Issue | Index | Quote Data and Yield Notes |
| PWF.PR.A | Floater | Quote: 17.55 – 18.34 Spot Rate : 0.7900 Average : 0.6129 YTW SCENARIO |
| BAM.PF.E | FixedReset | Quote: 22.68 – 23.13 Spot Rate : 0.4500 Average : 0.2955 YTW SCENARIO |
| ENB.PR.F | FixedReset | Quote: 19.40 – 19.87 Spot Rate : 0.4700 Average : 0.3210 YTW SCENARIO |
| CU.PR.C | FixedReset | Quote: 24.50 – 24.93 Spot Rate : 0.4300 Average : 0.2812 YTW SCENARIO |
| IFC.PR.C | FixedReset | Quote: 24.10 – 24.47 Spot Rate : 0.3700 Average : 0.2304 YTW SCENARIO |
| MFC.PR.H | FixedReset | Quote: 25.34 – 25.78 Spot Rate : 0.4400 Average : 0.3065 YTW SCENARIO |