Yessir, one has to admire all those hard-nosed market timers who positioned themselves for “rising interest rates”:
Treasury 30-year bonds yields are tumbling to record lows as the collapse in oil and commodity prices smothers inflation and hampers global economic growth.
Global sovereign yields fell to records in the U.K., France, Canada and Japan as a report showed retail sales in the U.S. slumped in December by the most in almost a year, reflecting a broad-based retreat that may prompt economists to cut growth forecasts. The slide prompted traders to push back expectations for the timing of the first Federal Reserve interest-rate increase into December less than a month after speculating that rates could rise as soon as April.
…
Even at the record low yield of 2.39 percent reached today, 30-year Treasuries are attractive to global investors looking at negative returns on the sovereign debt of nations including German with the European Central Bank expected to add to its bond-buying program as policy makers seek to avert deflation.The Treasury sold $13 billion of 30-year bonds at an auction-record-low yield of 2.430 percent.
Thirty-year bond yields dropped five basis points, or 0.05 percentage point, to 2.45 percent as of 2:31 p.m. in New York, according to Bloomberg Bond Trader data. The momentum that caused the previous record low of 2.44 percent set on July 26, 2012, to be eclipsed is being driven by the following factors.
- GLOBAL SLOWDOWN THREAT …
- LOW INFLATION …
- RELATIVE RETURNS…
- FED TIMING …
Larry Berman of the Globe passes on chief markets economist at Capital Economics John Higgins’ reasons, one of which was missed in the above:
Two, financial institutions are adapting to stricter regulations regarding leverage and assets, creating more demand for safe government bonds.
JPMorgan’s Jamie Dimon is complaining about the regulatory three-ring circus:
Jamie Dimon, grappling with multibillion-dollar legal costs and rising capital requirements at JPMorgan Chase & Co. (JPM), said overlapping efforts by U.S. regulators place banks “under assault.”
“We have five or six regulators or people coming after us on every different issue,” Dimon, 58, said today on a call with reporters after New York-based JPMorgan reported fourth-quarter results. “It’s a hard thing to deal with.”
JPMorgan, the largest U.S. bank by assets, posted a drop in fourth-quarter profit amid $990 million of legal expenses, about double what some analysts predicted. The legal costs, mostly tied to probes into currency rate-rigging, follow even bigger payments in 2013 related to mortgage bonds sold before the 2008 crisis by JPMorgan and firms it acquired.
…
Dimon, who was lauded during the crisis for JPMorgan’s role in buying Bear Stearns Cos. and Washington Mutual Inc.’s banking operations, has criticized the government for penalizing JPMorgan for those firms’ actions.
…
“In the old days, you dealt with one regulator when you had an issue, maybe two,” said Dimon, 58. “Now it’s five or six. It makes it very difficult and very complicated. You all should ask the question about how American that is. And how fair that is. And how complex that is for companies.”
Another hilarious spoofing case in US markets:
And then there is Aleksander Milrud, who allegedly built his spoofing robot out of lots of human traders in China and Korea and maybe elsewhere. Milrud was charged with spoofing today by federal prosecutors and the Securities and Exchange Commission, making him by my count only the second person to be charged with criminal spoofing. The claim is that Milrud recruited lots of traders in China and Korea, and then assigned them to spoof stocks from two accounts each. In the “dirty” account, a trader would enter lots of spoof orders to move the market. In the “clean” account, he’d enter a few orders the other way, to take advantage of the market move. The connections between those accounts, and between them and Milrud, were then further obscured by a series of tubes or whatever. 2 The traders could move fast because “Milrud worked with a gaming software company to develop ‘hot keys’ that allowed his traders to quickly place and cancel multiple orders via their computers with only a few strokes of their keyboards.” Because the next best thing to being an algorithm is being a human with a really fancy keyboard.
I see no reason that spoofing should be a crime. To the extent that it causes additional limit orders to be on the board, spoofing is good! I’m not concerned about the spoofees, because they’re just traders, playing a traders’ games. A fundamental investor can only be helped by spoofing.
One argument that can be made in favour of outlawing spoofing is that the ‘bad’ orders will drive out the ‘good’ – i.e., that legitimate speculative market makers will exit the market because they don’t understand it any more. I’m not so sure that this will be the case; I haven’t seen any evidence to support this view, although if may very well be that lots exists.
It was another poor day for the Canadian preferred share market, with PerpetualDiscounts down 7bp, FixedResets losing 22bp and DeemedRetractibles off 3bp. There is another lengthy Performance Highlights table, dominated by losing FixedResets. Volume was low.
PerpetualDiscounts now yield 5.00%, equivalent to 6.50% interest at the standard equivalency factor of 1.3x. Long corporates now yield about 3.85% so the pre-tax interest-equivalent spread (in this context, the “Seniority Spread”) is now about 265bp, unchanged from January 7.
For as long as the FixedReset market is so violently unsettled, I’ll keep publishing updates of the more interesting and meaningful series of FixedResets’ Implied Volatilities. This doesn’t include Enbridge because although Enbridge has a large number of issues outstanding, all of which are quite liquid, the range of Issue Reset Spreads is too small for decent conclusions. The low is 212bp (ENB.PR.H; second-lowest is ENB.PR.D at 237bp) and the high is a mere 268 for ENB.PF.G.
Remember that all rich /cheap assessments are:
- based on Implied Volatility Theory only
- are relative only to other FixedResets from the same issuer
- assume constant GOC-5 yield
- assume constant Implied Volatility
- assume constant spread
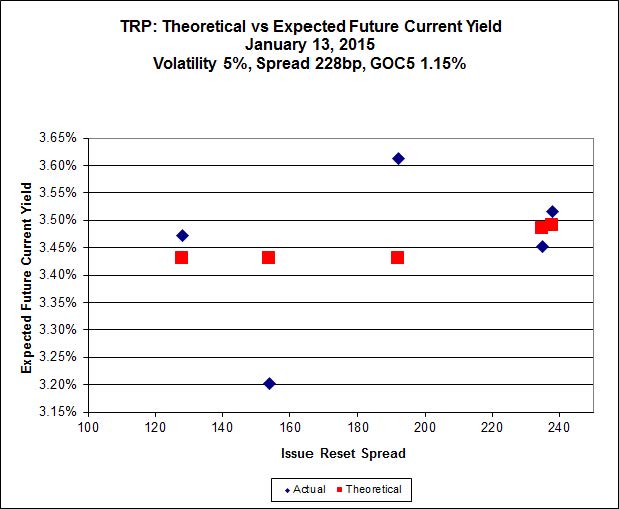
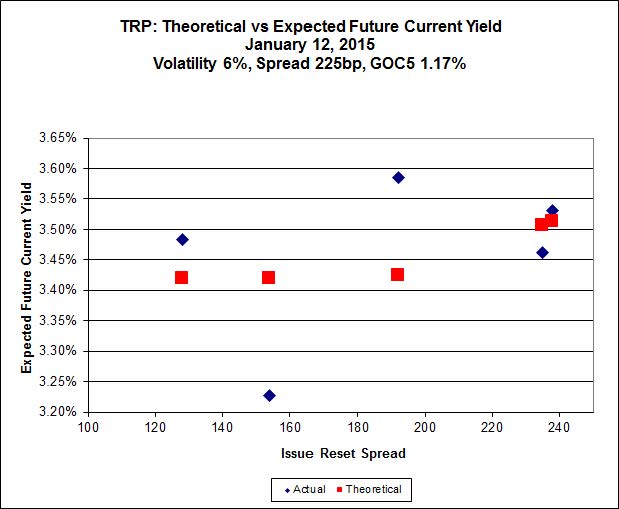
Here’s TRP:

Click for Big
So according to this, TRP.PR.A, bid at 21.23, is $0.92 cheap, but it has already reset (at +192). TRP.PR.C, bid at 20.47 and resetting at +154bp on 2016-1-30 is $1.08 rich.
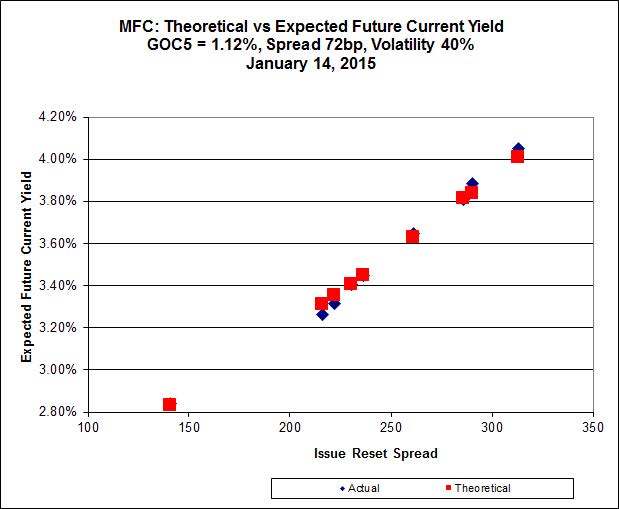
Click for Big
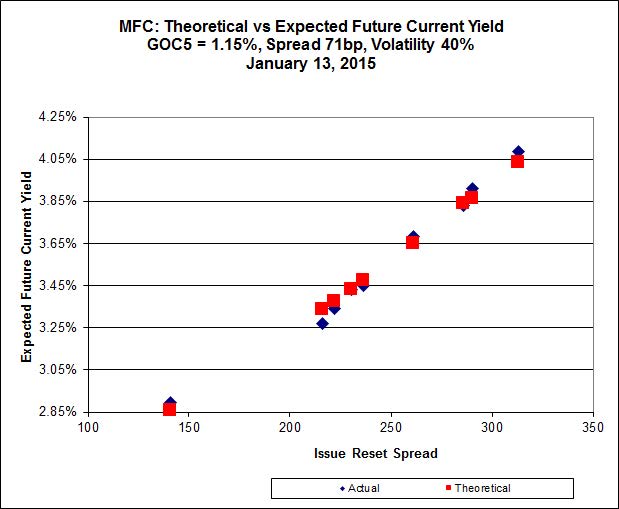
MFC.PR.F continues to be on the line defined by its peers. Implied Volatility continues to be a conundrum. It is far too high if we consider that NVCC rules will never apply to these issues; it is still too low if we consider them to be NVCC non-compliant issues (and therefore with Deemed Maturities in the call schedule).
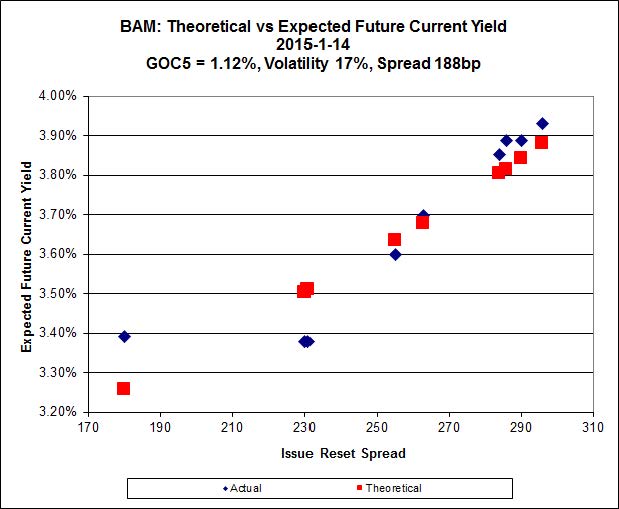
Click for Big
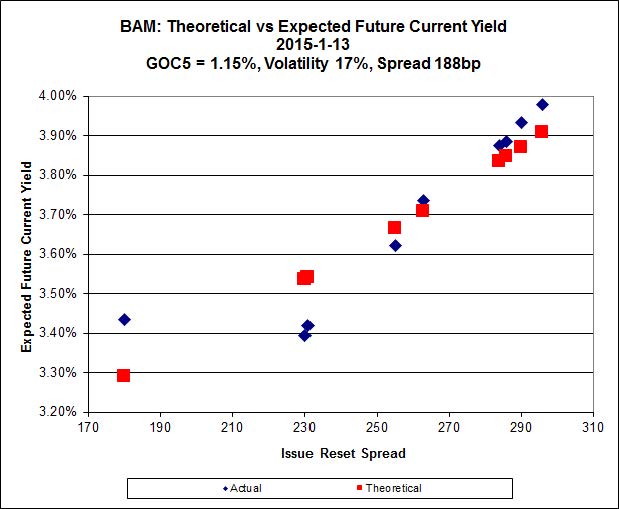
There continues to be cheapness in the lowest-spread issue, BAM.PR.X, resetting at +180bp on 2017-6-30, which is bid at 21.53 and appears to be $0.88 cheap, while BAM.PR.R, resetting at +230bp 2016-6-30 is bid at 25.30 and appears to be $0.89 rich.
It seems clear that the higher-spread issues define a curve with significantly more Implied Volatility than is calculated when the low-spread outlier is included.
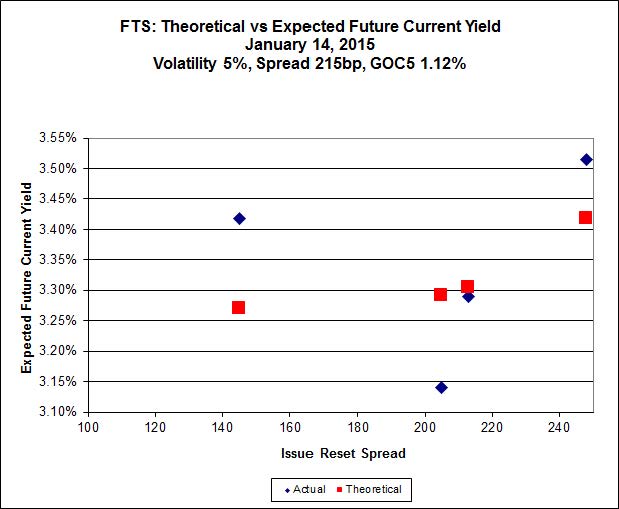
Click for Big
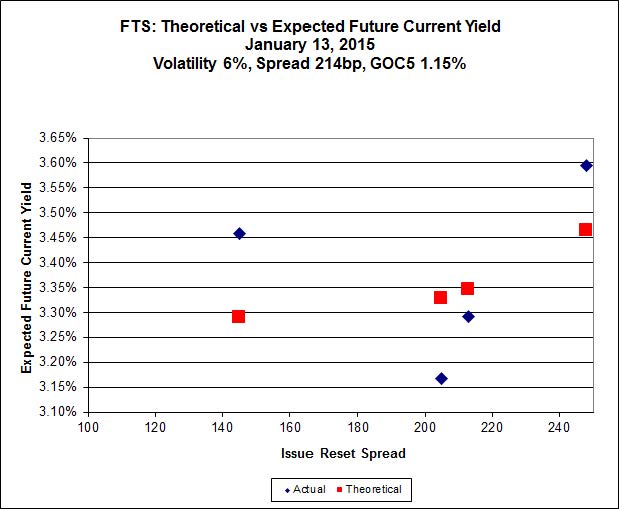
This is just weird because the middle is expensive and the ends are cheap but anyway … FTS.PR.H, with a spread of +145bp, and bid at 18.80, looks $0.85 cheap and resets 2015-6-1. FTS.PR.K, with a spread of +205bp, and bid at 25.24, looks $1.16 expensive and resets 2019-3-1
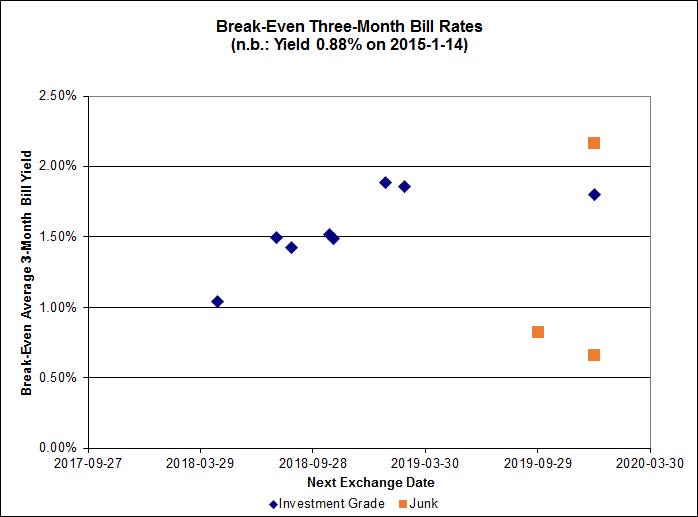
Click for Big
Pairs equivalence is all over the map.
And, yeah, Bell is still having network problems, and I am still using my ‘phone as a Wi-Fi hotspot. But don’t worry! Our beloved government will continue to protect us from the evils of American competition, so nobody will lose his job over this fiasco.
| HIMIPref™ Preferred Indices These values reflect the December 2008 revision of the HIMIPref™ Indices Values are provisional and are finalized monthly |
|||||||
| Index | Mean Current Yield (at bid) |
Median YTW |
Median Average Trading Value |
Median Mod Dur (YTW) |
Issues | Day’s Perf. | Index Value |
| Ratchet | 0.00 % | 0.00 % | 0 | 0.00 | 0 | -0.3238 % | 2,553.6 |
| FixedFloater | 4.42 % | 3.60 % | 20,887 | 18.30 | 1 | 0.4671 % | 4,001.9 |
| Floater | 2.97 % | 3.07 % | 55,289 | 19.57 | 4 | -0.3238 % | 2,714.7 |
| OpRet | 4.04 % | 1.44 % | 95,937 | 0.42 | 1 | 0.0000 % | 2,755.3 |
| SplitShare | 4.26 % | 3.96 % | 35,237 | 3.63 | 5 | -0.0473 % | 3,211.3 |
| Interest-Bearing | 0.00 % | 0.00 % | 0 | 0.00 | 0 | 0.0000 % | 2,519.4 |
| Perpetual-Premium | 5.44 % | -5.17 % | 57,116 | 0.08 | 19 | 0.0433 % | 2,499.6 |
| Perpetual-Discount | 5.16 % | 5.00 % | 100,957 | 15.39 | 16 | -0.0713 % | 2,688.0 |
| FixedReset | 4.20 % | 3.47 % | 205,816 | 16.71 | 77 | -0.2204 % | 2,543.6 |
| Deemed-Retractible | 4.95 % | 1.05 % | 100,114 | 0.21 | 39 | -0.0335 % | 2,619.6 |
| FloatingReset | 2.70 % | 2.20 % | 60,973 | 3.43 | 7 | -0.2990 % | 2,479.2 |
| Performance Highlights | |||
| Issue | Index | Change | Notes |
| PWF.PR.P | FixedReset | -2.83 % | YTW SCENARIO Maturity Type : Limit Maturity Maturity Date : 2045-01-14 Maturity Price : 20.63 Evaluated at bid price : 20.63 Bid-YTW : 3.51 % |
| TRP.PR.C | FixedReset | -2.52 % | YTW SCENARIO Maturity Type : Limit Maturity Maturity Date : 2045-01-14 Maturity Price : 20.47 Evaluated at bid price : 20.47 Bid-YTW : 3.46 % |
| FTS.PR.J | Perpetual-Discount | -1.63 % | YTW SCENARIO Maturity Type : Limit Maturity Maturity Date : 2045-01-14 Maturity Price : 23.76 Evaluated at bid price : 24.15 Bid-YTW : 4.96 % |
| NA.PR.Q | FixedReset | -1.50 % | YTW SCENARIO Maturity Type : Call Maturity Date : 2017-11-15 Maturity Price : 25.00 Evaluated at bid price : 25.63 Bid-YTW : 2.77 % |
| BNS.PR.Z | FixedReset | -1.42 % | YTW SCENARIO Maturity Type : Hard Maturity Maturity Date : 2022-01-31 Maturity Price : 25.00 Evaluated at bid price : 24.25 Bid-YTW : 3.20 % |
| PWF.PR.A | Floater | -1.32 % | YTW SCENARIO Maturity Type : Limit Maturity Maturity Date : 2045-01-14 Maturity Price : 19.50 Evaluated at bid price : 19.50 Bid-YTW : 2.71 % |
| GWO.PR.N | FixedReset | -1.19 % | YTW SCENARIO Maturity Type : Hard Maturity Maturity Date : 2025-01-31 Maturity Price : 25.00 Evaluated at bid price : 20.75 Bid-YTW : 4.81 % |
| PWF.PR.T | FixedReset | -1.19 % | YTW SCENARIO Maturity Type : Call Maturity Date : 2019-01-31 Maturity Price : 25.00 Evaluated at bid price : 25.82 Bid-YTW : 3.29 % |
| TD.PR.Y | FixedReset | -1.01 % | YTW SCENARIO Maturity Type : Hard Maturity Maturity Date : 2022-01-31 Maturity Price : 25.00 Evaluated at bid price : 25.46 Bid-YTW : 2.96 % |
| FTS.PR.M | FixedReset | 1.43 % | YTW SCENARIO Maturity Type : Limit Maturity Maturity Date : 2045-01-14 Maturity Price : 23.36 Evaluated at bid price : 25.61 Bid-YTW : 3.58 % |
| ENB.PR.Y | FixedReset | 1.54 % | YTW SCENARIO Maturity Type : Limit Maturity Maturity Date : 2045-01-14 Maturity Price : 21.90 Evaluated at bid price : 22.36 Bid-YTW : 4.15 % |
| MFC.PR.B | Deemed-Retractible | 1.76 % | YTW SCENARIO Maturity Type : Hard Maturity Maturity Date : 2025-01-31 Maturity Price : 25.00 Evaluated at bid price : 24.26 Bid-YTW : 5.10 % |
| BNS.PR.Y | FixedReset | 3.11 % | YTW SCENARIO Maturity Type : Hard Maturity Maturity Date : 2022-01-31 Maturity Price : 25.00 Evaluated at bid price : 23.20 Bid-YTW : 3.42 % |
| Volume Highlights | |||
| Issue | Index | Shares Traded |
Notes |
| FTS.PR.H | FixedReset | 204,551 | RBC crossed 191,800 at 18.64. YTW SCENARIO Maturity Type : Limit Maturity Maturity Date : 2045-01-14 Maturity Price : 18.80 Evaluated at bid price : 18.80 Bid-YTW : 3.62 % |
| BAM.PF.G | FixedReset | 155,828 | RBC crossed 149,400 at 25.76. YTW SCENARIO Maturity Type : Limit Maturity Maturity Date : 2045-01-14 Maturity Price : 23.35 Evaluated at bid price : 25.70 Bid-YTW : 3.93 % |
| CM.PR.P | FixedReset | 110,897 | Recent new issue. YTW SCENARIO Maturity Type : Limit Maturity Maturity Date : 2045-01-14 Maturity Price : 23.18 Evaluated at bid price : 25.07 Bid-YTW : 3.41 % |
| TD.PF.C | FixedReset | 107,610 | Recent new issue. YTW SCENARIO Maturity Type : Limit Maturity Maturity Date : 2045-01-14 Maturity Price : 23.18 Evaluated at bid price : 25.06 Bid-YTW : 3.42 % |
| HSE.PR.A | FixedReset | 52,404 | Nesbitt crossed 13,800 at 20.90, then sold 10,000 to anonymous at the same price. TD crossed 21,900 at 20.90. YTW SCENARIO Maturity Type : Limit Maturity Maturity Date : 2045-01-14 Maturity Price : 20.87 Evaluated at bid price : 20.87 Bid-YTW : 3.66 % |
| BNS.PR.N | Deemed-Retractible | 37,395 | TD crossed 35,000 at 25.79. YTW SCENARIO Maturity Type : Call Maturity Date : 2015-02-27 Maturity Price : 25.50 Evaluated at bid price : 25.75 Bid-YTW : -5.00 % |
| There were 22 other index-included issues trading in excess of 10,000 shares. | |||
| Wide Spread Highlights | ||
| Issue | Index | Quote Data and Yield Notes |
| PWF.PR.P | FixedReset | Quote: 20.63 – 21.31 Spot Rate : 0.6800 Average : 0.4723 YTW SCENARIO |
| NA.PR.Q | FixedReset | Quote: 25.63 – 26.23 Spot Rate : 0.6000 Average : 0.4084 YTW SCENARIO |
| PWF.PR.A | Floater | Quote: 19.50 – 20.65 Spot Rate : 1.1500 Average : 0.9951 YTW SCENARIO |
| BNS.PR.Z | FixedReset | Quote: 24.25 – 24.67 Spot Rate : 0.4200 Average : 0.2771 YTW SCENARIO |
| FTS.PR.J | Perpetual-Discount | Quote: 24.15 – 24.68 Spot Rate : 0.5300 Average : 0.3924 YTW SCENARIO |
| BMO.PR.R | FloatingReset | Quote: 25.37 – 25.70 Spot Rate : 0.3300 Average : 0.2066 YTW SCENARIO |