Category: Market Action

Market Action

July 24, 2014

A paper by Nicholas Labelle, Varya Taylor titled Removal of the Unwinding Provisions in the Automated Clearing Settlement System: A Risk Assessment is interesting:

A default in the Automated Clearing Settlement System (ACSS) occurs when a Direct Clearer is unable to settle its final obligation. In August 2012, the Canadian Payments Association amended the ACSS by-law and rules to repeal the unwinding provisions from the ACSS default framework. Without unwinding, payment items are no longer returned by the defaulter to the other participants as a means of reducing the defaulter’s final obligation. Instead, the other Direct Clearers (survivors) pay only additional settlement obligations to cover the defaulter’s shortfall. To assess the potential exposures of an ACSS default without unwinding, we use simulations to estimate the value of additional settlement obligations for each survivor and compare these exposures to their capital and liquid assets. Results indicate that these exposures are indeed manageable by survivors and, therefore, that the ACSS does not pose systemic risk.

The global economy still looks lousy:

Today’s report from the IMF highlights, in particular, the struggles of the euro zone and the still-uneven recovery in the United States after a brutal winter, as well as the troubles in emerging markets.

In the update to its earlier world economic outlook, released in Mexico City, the IMF now forecasts that Canada’s economy will grow by 2.2 per cent this year, down marginally from its April forecast of 2.3 per cent. It held its 2015 outlook for Canada steady at 2.4 per cent.

Despite the trim, Canada’s economy will be outpaced this year among the G7 nations only by Britain, at 3.2 per cent. Next year, according to the forecast both Britain and the United States will outstrip Canada, at 2.7 per cent and 3 per cent, respectively.

The IMF forecast puts the spotlight on the euro zone, where Germany’s economy is projected to grow by 1.9 per cent this and 1.7 per cent in 2015, France by 0.7 per cent and 1.4 per cent, and Italy, by 0.3 per cent and 1.1 per cent.

Japan will also lag, at 1.6 per cent and 1.1 per cent.

Well, it looks like we have a winner for Quote of the Day!

BAMPRG_140724
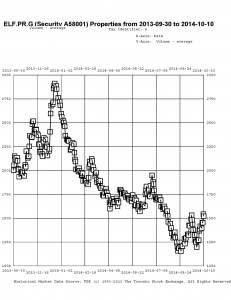
Click for Big

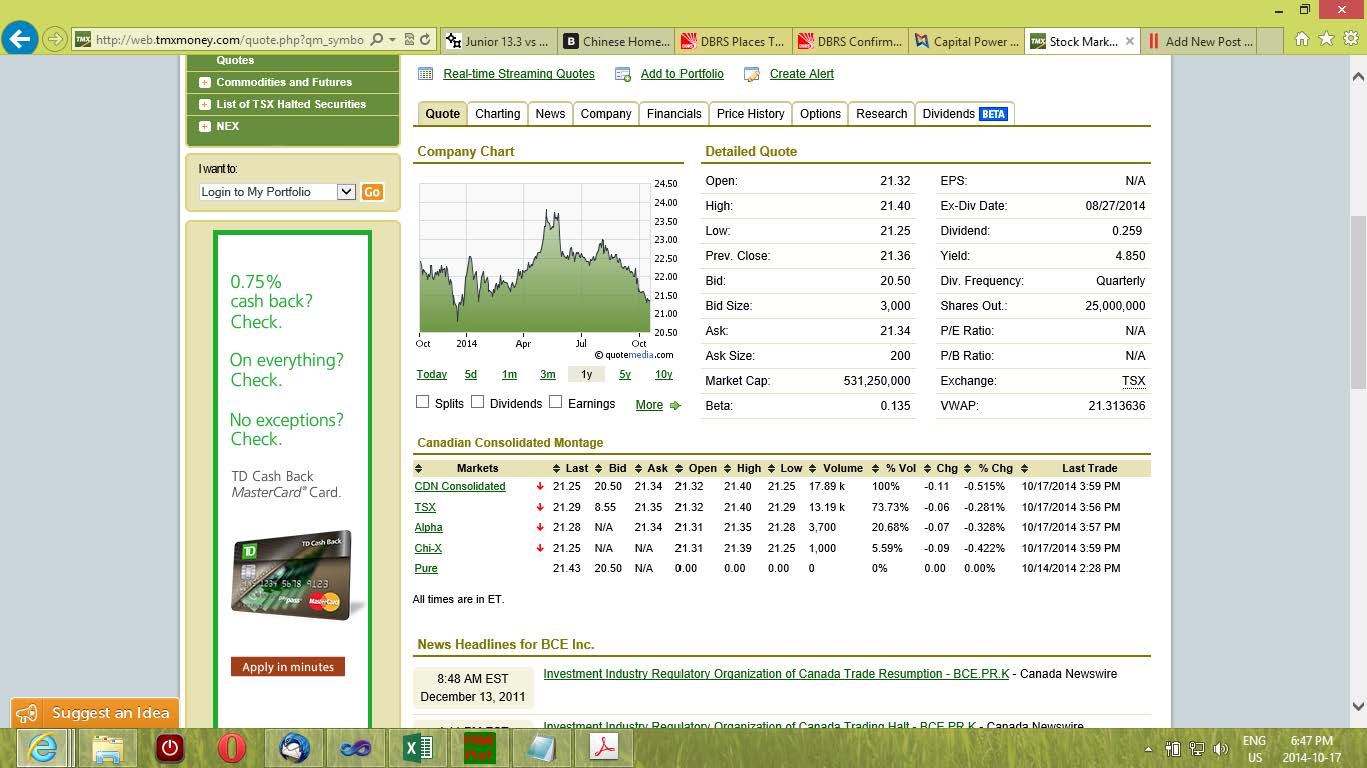
Yes, that’s right, BAM.PR.G is quoted at 22.81-500.00, 1×9. Timestamped details are not yet available from the Toronto Stock Exchange, so it’s not clear whether this is due to a moronic market-maker, or to the TMX’s moronic practice of reporting the ‘last’ quote rather than the closing quote. I have followed my usual practice in such cases and reset the ask price used by HIMIPref™ to $1 above the bid.

Update: I’ve checked it out, buying all ‘Trades and Quotes’ between 3:55pm and 4:00pm. The only entry in the file is a quote timestamped 15:59:45, 22.81-500.00, 1×1. So what we have here, people, is a lackadaisical market-maker

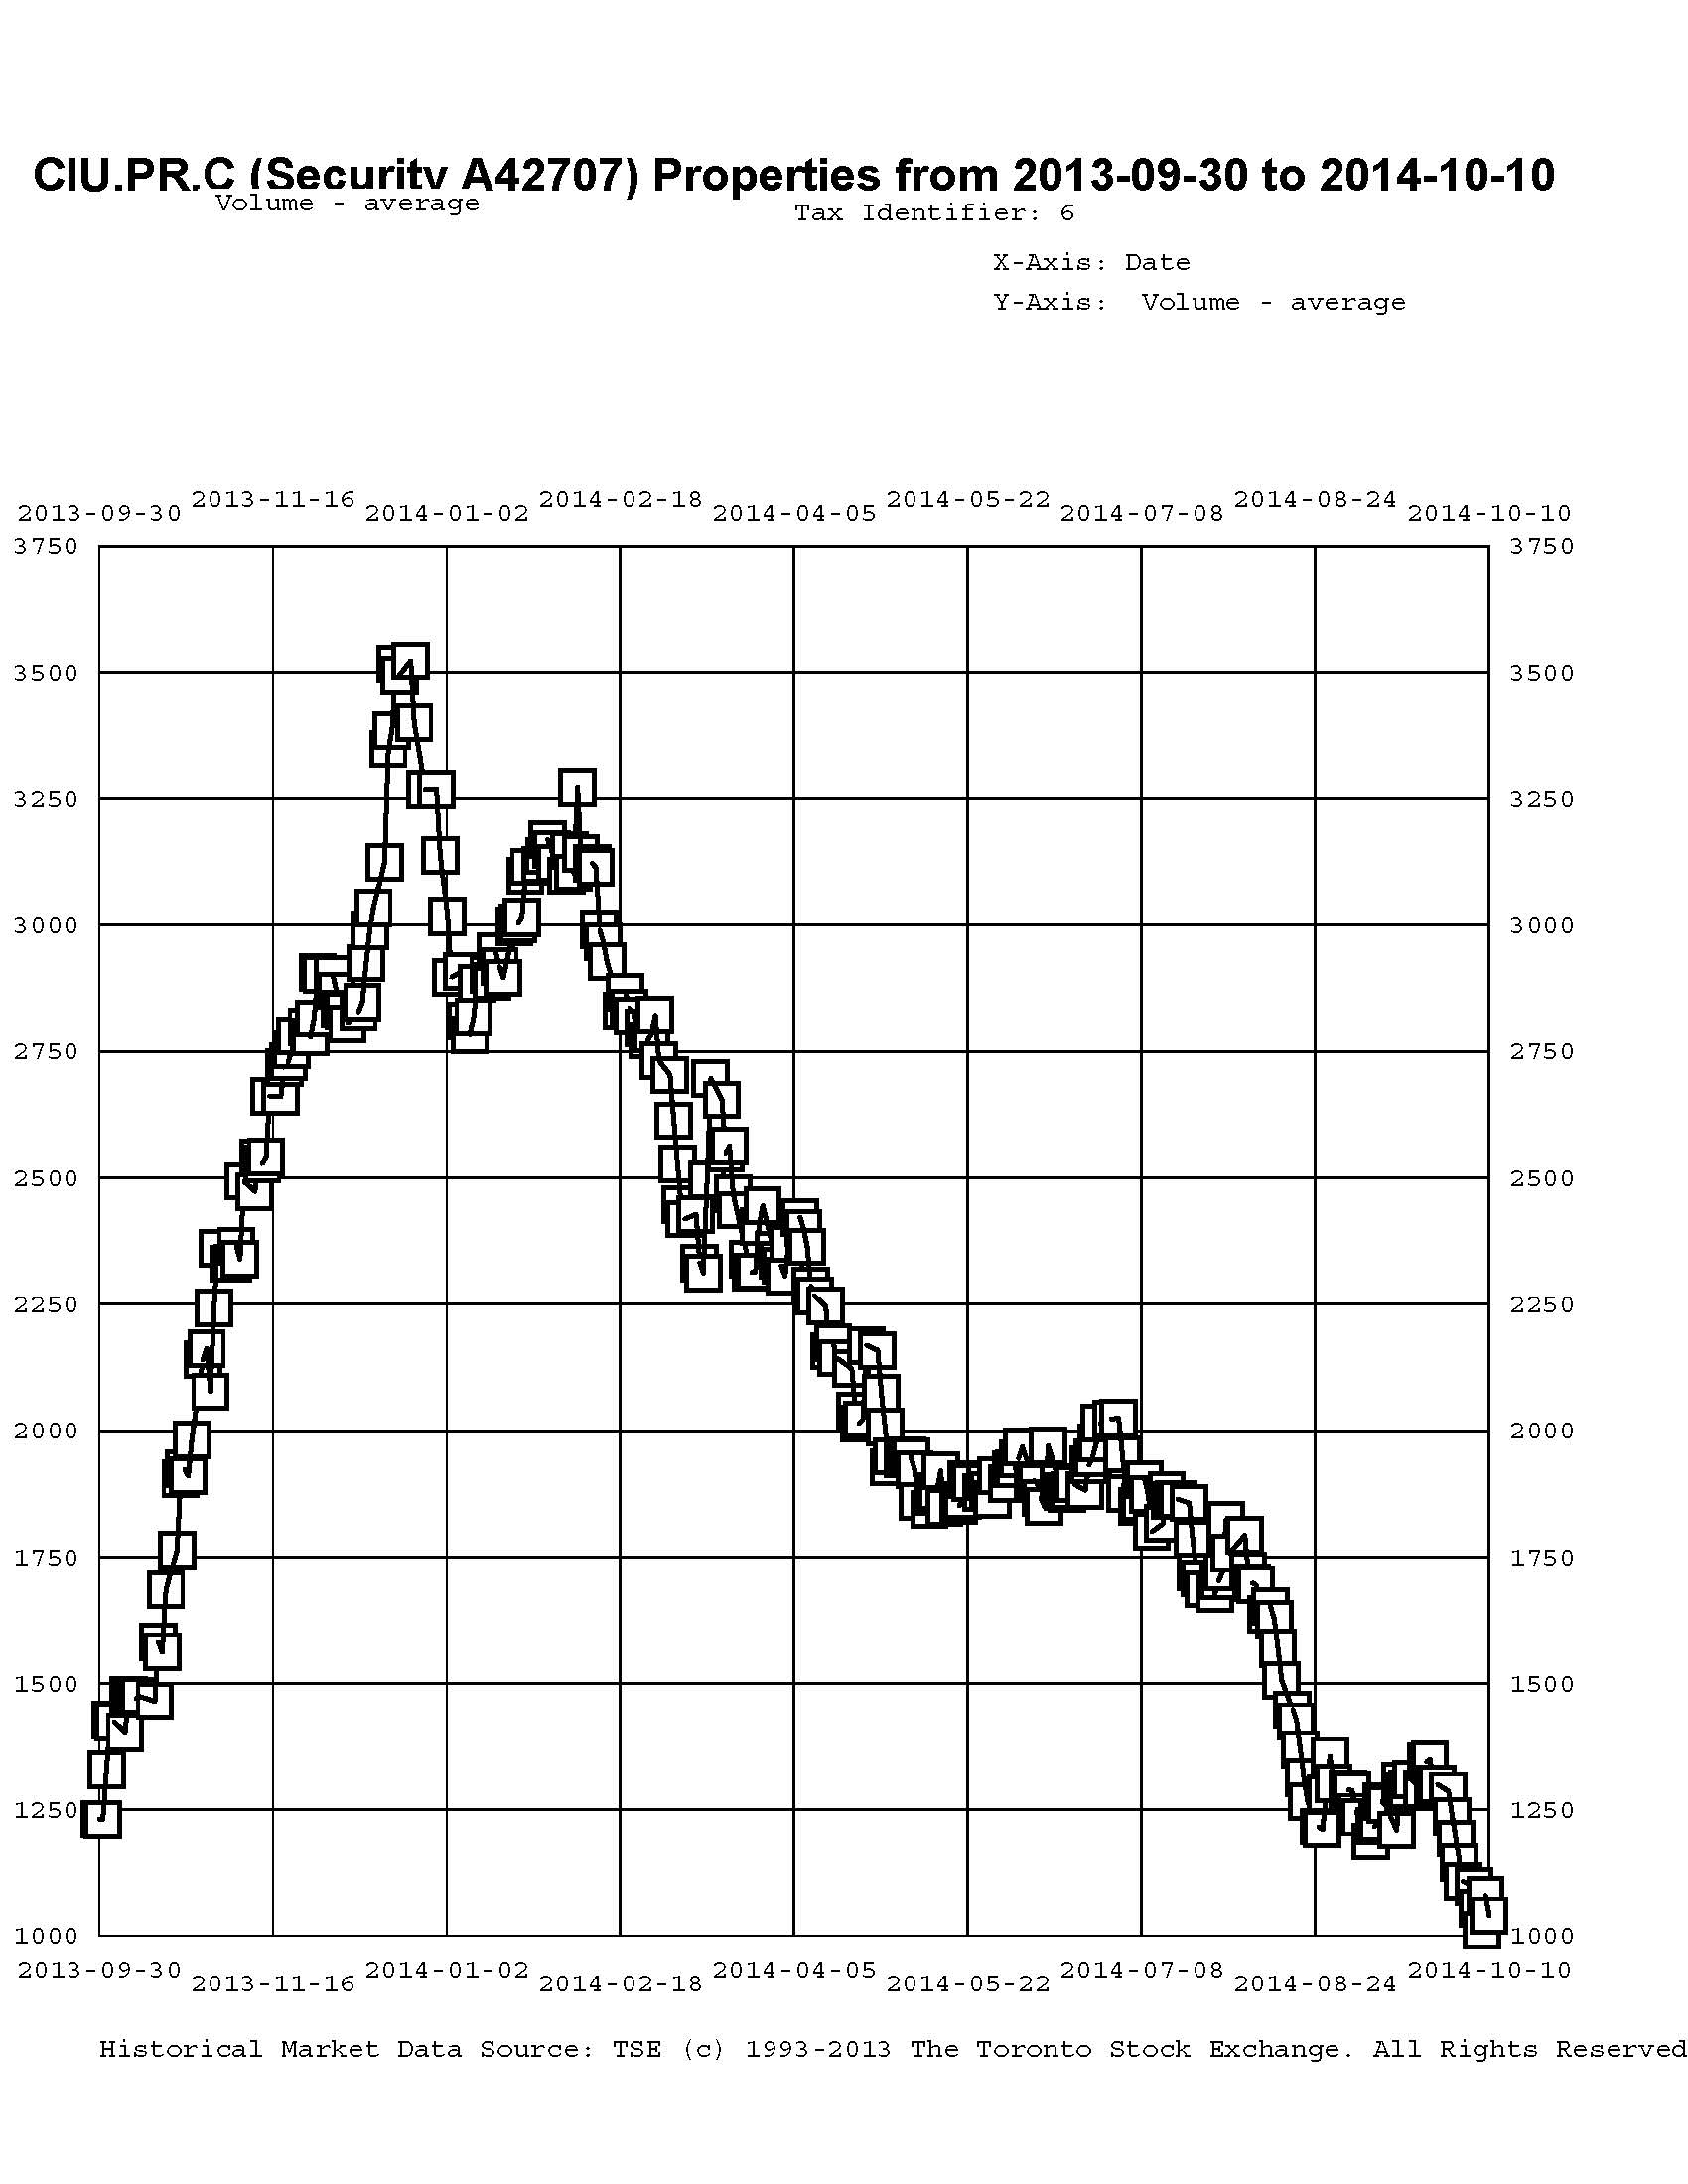
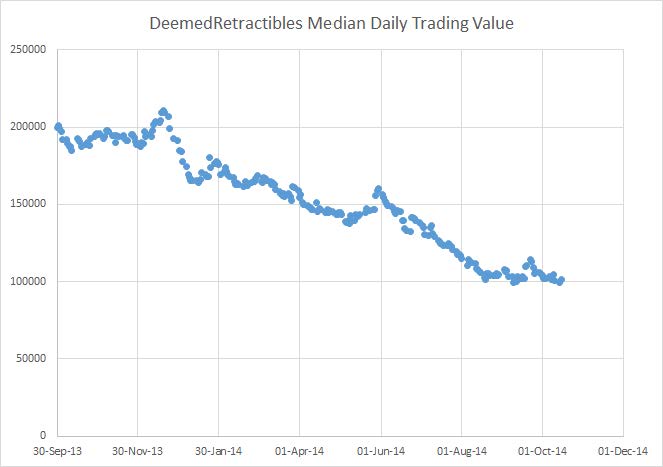
It was a modestly negative day for the Canadian preferred share market, with PerpetualDiscounts flat, FixedResets down 8bp and DeemedRetractibles off 3bp. Volatility was negligible. Volume was average.

HIMIPref™ Preferred Indices
These values reflect the December 2008 revision of the HIMIPref™ Indices

Values are provisional and are finalized monthly
Index Mean
Current
Yield
(at bid)
Median
YTW
Median
Average
Trading
Value
Median
Mod Dur
(YTW)
Issues Day’s Perf. Index Value
Ratchet 3.09 % 3.07 % 19,802 19.49 1 -0.4098 % 2,574.3
FixedFloater 4.16 % 3.40 % 29,083 18.65 1 0.4846 % 4,165.7
Floater 2.86 % 2.95 % 46,302 19.85 4 -0.3118 % 2,776.8
OpRet 4.02 % -2.74 % 79,535 0.08 1 -0.5462 % 2,719.0
SplitShare 4.25 % 3.86 % 52,079 4.01 6 0.0398 % 3,121.7
Interest-Bearing 0.00 % 0.00 % 0 0.00 0 -0.5462 % 2,486.2
Perpetual-Premium 5.52 % -5.27 % 82,840 0.09 17 0.0878 % 2,432.0
Perpetual-Discount 5.23 % 5.09 % 109,492 15.24 20 0.0000 % 2,584.9
FixedReset 4.40 % 3.59 % 199,507 8.60 77 -0.0843 % 2,557.4
Deemed-Retractible 4.98 % 0.08 % 122,672 0.09 43 -0.0333 % 2,553.4
FloatingReset 2.66 % 2.13 % 94,093 3.82 6 -0.0787 % 2,518.8
Performance Highlights
Issue Index Change Notes
BAM.PF.A FixedReset -1.08 % YTW SCENARIO
Maturity Type : Call
Maturity Date : 2018-09-30
Maturity Price : 25.00
Evaluated at bid price : 25.53
Bid-YTW : 4.04 %
BMO.PR.S FixedReset -1.01 % YTW SCENARIO
Maturity Type : Limit Maturity
Maturity Date : 2044-07-24
Maturity Price : 23.30
Evaluated at bid price : 25.41
Bid-YTW : 3.70 %
Volume Highlights
Issue Index Shares
Traded
Notes
GWO.PR.Q Deemed-Retractible 303,100 Scotia crossed 298,800 at 24.95.
YTW SCENARIO
Maturity Type : Hard Maturity
Maturity Date : 2025-01-31
Maturity Price : 25.00
Evaluated at bid price : 24.95
Bid-YTW : 5.25 %
RY.PR.H FixedReset 268,050 Nesbitt crossed 153,100 and two blocks of 50,000 each, all at 25.26.
YTW SCENARIO
Maturity Type : Limit Maturity
Maturity Date : 2044-07-24
Maturity Price : 23.22
Evaluated at bid price : 25.20
Bid-YTW : 3.59 %
ELF.PR.H Perpetual-Discount 202,900 Nesbitt crossed 200,000 at 24.85.
YTW SCENARIO
Maturity Type : Limit Maturity
Maturity Date : 2044-07-24
Maturity Price : 24.38
Evaluated at bid price : 24.81
Bid-YTW : 5.56 %
GWO.PR.P Deemed-Retractible 199,660 TD crossed blocks of 75,000 shares, 35,000 and 85,000, all at 25.80.
YTW SCENARIO
Maturity Type : Call
Maturity Date : 2020-03-31
Maturity Price : 25.25
Evaluated at bid price : 25.80
Bid-YTW : 5.01 %
BAM.PF.F FixedReset 136,300 Nesbitt crossed 125,000 at 25.45.
YTW SCENARIO
Maturity Type : Limit Maturity
Maturity Date : 2044-07-24
Maturity Price : 23.29
Evaluated at bid price : 25.45
Bid-YTW : 4.21 %
GWO.PR.S Deemed-Retractible 90,600 RBC crossed 84,700 at 25.60.
YTW SCENARIO
Maturity Type : Hard Maturity
Maturity Date : 2025-01-31
Maturity Price : 25.00
Evaluated at bid price : 25.56
Bid-YTW : 5.12 %
There were 30 other index-included issues trading in excess of 10,000 shares.
Wide Spread Highlights
Issue Index Quote Data and Yield Notes
MFC.PR.C Deemed-Retractible Quote: 22.89 – 23.30
Spot Rate : 0.4100
Average : 0.2493

YTW SCENARIO
Maturity Type : Hard Maturity
Maturity Date : 2025-01-31
Maturity Price : 25.00
Evaluated at bid price : 22.89
Bid-YTW : 5.66 %

BAM.PR.G FixedFloater Quote: 22.81 – 23.81
Spot Rate : 1.0000
Average : 0.8542

YTW SCENARIO
Maturity Type : Limit Maturity
Maturity Date : 2044-07-24
Maturity Price : 22.86
Evaluated at bid price : 22.81
Bid-YTW : 3.40 %

IAG.PR.A Deemed-Retractible Quote: 23.20 – 23.68
Spot Rate : 0.4800
Average : 0.3518

YTW SCENARIO
Maturity Type : Hard Maturity
Maturity Date : 2025-01-31
Maturity Price : 25.00
Evaluated at bid price : 23.20
Bid-YTW : 5.58 %

BNS.PR.B FloatingReset Quote: 25.37 – 25.62
Spot Rate : 0.2500
Average : 0.1463

YTW SCENARIO
Maturity Type : Call
Maturity Date : 2018-10-25
Maturity Price : 25.00
Evaluated at bid price : 25.37
Bid-YTW : 2.13 %

VNR.PR.A FixedReset Quote: 25.33 – 25.68
Spot Rate : 0.3500
Average : 0.2571

YTW SCENARIO
Maturity Type : Call
Maturity Date : 2017-10-15
Maturity Price : 25.00
Evaluated at bid price : 25.33
Bid-YTW : 3.97 %

MFC.PR.B Deemed-Retractible Quote: 23.40 – 23.70
Spot Rate : 0.3000
Average : 0.2073

YTW SCENARIO
Maturity Type : Hard Maturity
Maturity Date : 2025-01-31
Maturity Price : 25.00
Evaluated at bid price : 23.40
Bid-YTW : 5.55 %

Market Action

July 23, 2014

The SEC has announced:

The Securities and Exchange Commission today adopted amendments to the rules that govern money market mutual funds.

The new rules require a floating net asset value (NAV) for institutional prime money market funds, which allows the daily share prices of these funds to fluctuate along with changes in the market-based value of fund assets and provide non-government money market fund boards new tools – liquidity fees and redemption gates – to address runs.

With a floating NAV, institutional prime money market funds (including institutional municipal money market funds) are required to value their portfolio securities using market-based factors and sell and redeem shares based on a floating NAV. These funds no longer will be allowed to use the special pricing and valuation conventions that currently permit them to maintain a constant share price of $1.00. With liquidity fees and redemption gates, money market fund boards have the ability to impose fees and gates during periods of stress. The final rules also include enhanced diversification, disclosure and stress testing requirements, as well as updated reporting by money market funds and private funds that operate like money market funds.

  • Liquidity Fees – Under the rules, if a money market fund’s level of “weekly liquid assets” falls below 30 percent of its total assets (the regulatory minimum), the money market fund’s board would be allowed to impose a liquidity fee of up to two percent on all redemptions. Such a fee could be imposed only if the money market fund’s board of directors determines that such a fee is in the best interests of the fund. If a money market fund’s level of weekly liquid assets falls below 10 percent, the money market fund would be required to impose a liquidity fee of one percent on all redemptions. However, such a fee would not be imposed if the fund’s board of directors determines that such a fee is not in the best interests of the fund or that a lower or higher (up to two percent) liquidity fee is in the best interests of the fund. Weekly liquid assets generally include cash, U.S. Treasury securities, certain other government securities with remaining maturities of 60 days or less, and securities that convert into cash within one week.
  • Redemption Gates – Under the rules, if a money market fund’s level of weekly liquid assets falls below 30 percent, a money market fund’s board could in its discretion temporarily suspend redemptions (gate). To impose a gate, the board of directors would find that imposing a gate is in the money market fund’s best interests. A money market fund that imposes a gate would be required to lift that gate within 10 business days, although the board of directors could determine to lift the gate earlier. Money market funds would not be able to impose a gate for more than 10 business days in any 90-day period.

SEC Chair Mary Jo White’s statement inadvertently explains why these measures won’t work:

During the last financial crisis, institutional prime money market funds experienced an unprecedented run when the Reserve Primary Fund “broke the buck” and declared it would no longer redeem investors’ shares dollar-for-dollar. In one week, investors pulled approximately $300 billion from prime money market funds, or 14 percent of the assets in those funds. This phenomenon, together with other events in the fall of 2008, caused the short-term financing markets to dry up, severely limiting the ability of companies to borrow funds, manage cash, and continue fueling the American economy. As part of a program of extraordinary support across the financial system, a temporary guarantee program was provided through Treasury to stop the run on institutional prime funds, and the Federal Reserve established liquidity facilities.

OK, so you’ve got a tense situation and suddenly BANG! A blue-chip company defaults leading to a run on the entire industry. But this run is actually worse than was experienced before, because not only are corporate treasurers worried about whether or not there will be default in the fund(s) that they own, but they will also be worried that the run itself will trigger redemption gates and fees on their fund – and you don’t put your corporate cash assets in MMFs so that you can pay fees and be subject to gates.

Ms. White counters this with the party line:

While many strongly favor this reform, others have expressed a concern that it could do harm by potentially triggering destructive “pre-emptive” runs. This concern is important, but addressing it need not — and should not — mean foregoing an important reform. What we have done in response to this concern is to make significant modifications to the original proposal that, while preserving the fundamental utility of fees and gates, mitigate the pre-emptive run risk and dampen the effects if they were to occur.

  • The recommendation, among other measures, increases the thresholds for imposing a fee or gate to a higher level of remaining liquid assets. A money market fund that imposes a fee or gate with substantial remaining internal liquidity is in a better position to bear those redemptions without a broader market impact because it can satisfy those redemption requests with cash, without selling assets, and this is less likely to generate a run in other funds.
  • The recommendation makes the imposition of a fee or gate more discretionary, rather than the result of strict triggers. The absence of such triggers make it less likely that informed investors will be able to “front run” the exercise of a fee or gate, thereby precipitating a run.
  • And the recommendation lessens the liquidity impact for investors of a fee or gate by, among other things, permitting only a short maximum gate. This change will also diminish the incentive of an investor to run in order to preserve liquidity.

Well, I guess we’ll just have to wait for the next crisis to see who’s right on this one. They come along every twenty years or so; it will give some interest to the twilight of my career. Until then I will argue that the only thing that has proved to be effective against a bank run is solvency backed up by central bank lending. And solvency in a crisis, when a certain proportion of holdings has either defaulting or is trading at stressed levels, requires capital. And these new rules ain’t got no capital.

Commissioner Kara M. Stein explained in her statement how solvency and liquidity were attained last time:

The Federal Reserve created several programs to support the liquidity of financial institutions, borrowers, and investors.[3] And the Treasury Department guaranteed nearly $2.4 trillion in money market fund assets through its Temporary Guarantee Program.[4]

[3] See, e.g., Commercial Paper Funding Facility (CPFF), Asset-Backed Commercial Paper Money Market Mutual Fund Liquidity Facility (AMLF), Money Market Investor Funding Facility (MMIF), and the Term Asset-Backed Securities Loan Facility (TALF). For descriptions of these programs, see http://www.federalreserve.gov/newsevents/reform_cpff.htm (reflecting $739 billion in CPFF loans and $738 billion in purchases of commercial paper), http://www.federalreserve.gov/newsevents/reform_amlf.htm (reflecting $217 billion in AMLF loans), http://www.federalreserve.gov/newsevents/reform_mmiff.htm (reflecting $0 in total loans as the MMIF facility was never used), and http://www.federalreserve.gov/newsevents/reform_talf.htm (reflecting $71.1 billion in TALF loans).

[4] See Press Release, Treasury Announces Temporary Guarantee Program for Money Market Funds (Sept. 29, 2008), available at http://www.treasury.gov/press-center/press-releases/Pages/hp1161.aspx.

Footnote [3] addresses liquidity, is an entirely normal feature of central bank crisis management and requires no apology or correction. Footnote [4] addresses solvency, is an unpleasant and unwelcome crisis measure by the government and reflects a situation that certainly should be corrected with new procedures and attitudes, but which is unaddressed by the new rules.

However, Ms. Stein makes some effort to redeem herself (at par):

However, after careful study, I am concerned that gates are the wrong tool to address this risk. As the chance that a gate will be imposed increases, investors will have a strong incentive to rush to redeem ahead of others to avoid the uncertainty of losing access to their capital. More importantly, a run in one fund could incite a system-wide run because investors in other funds likely will fear that they also will impose gates. I share the concerns of many commenters and economists that while a gate may be good for one fund because it stops a run in that fund, it could be very damaging to the financial system as a whole.[7]

Even further, while a run by investors in one fund may be halted when the gate for that fund is used, that does not mean the impact on the wholesale funding markets will stop. To the contrary, a fund that drops a gate likely would need to build liquidity to meet redemption requests when the gate is lifted. This means the fund is likely to stop re-investing maturing securities during the gated period, or will invest primarily in government securities, thereby cutting off funding to issuers. This effect could be amplified by investors, who likely will redeem assets from other funds if one fund imposes a gate. And if investors are not able to redeem before the gate comes down, they will be harmed as they are deprived of access to their capital.[8] Ultimately, this contagion could freeze the wholesale funding markets in much the same way as occurred during the recent financial crisis.

[7] See, e.g., Comment Letters from the Federal Reserve Bank of Boston (Sept. 12, 2013), The Systemic Risk Council (Sept. 16, 2013), Samuel Hanson, David Scharfstein, and Adi Sunderman (Sept. 16, 2013), Goldman Sachs Asset Management (Sept. 17, 2013 and July 21, 2014), Deutsche Investment Management Americas (Sept. 17, 2013), Committee on Capital Markets Regulation (Sept. 17, 2013), The Squam Lake Group (Sept. 17, 2013), and Americans for Financial Reform (Sept. 17, 2013). See also Federal Reserve Bank of New York, Staff Report No. 670, Gates, Fees, and Preemptive Runs (Apr. 2014).

See Kevin McCoy, Primary Fund Shareholders Put in a Bind, USA Today, Nov. 11, 2008 (discussing hardships faced by Reserve Primary Fund shareholders due to having their shareholdings frozen); John G. Taft, STEWARDSHIP: LESSONS LEARNED FROM THE LOST CULTURE OF WALL STREET (2012), at 2 (“Now that the Reserve Primary Fund had suspended redemptions of Fund shares for cash, our clients had no access to their cash. This meant, in many cases, that they had no way to settle pending securities purchases and therefore no way to trade their portfolios at a time of historic market volatility. No way to make minimum required distributions from retirement plans. No way to pay property taxes. No way to pay college tuition. It meant bounced checks and, for retirees, interruption of the cash flow distributions they were counting on to pay their day-to-day living expenses.”).

… and I will award Ms. Stein full marks for:

I also am not sufficiently persuaded by the argument that many investors with a low tolerance for gates will seek alternative financial products that are better aligned with their risk-return preferences. While this could happen, it seems just as likely that those same investors will continue to invest in money market funds because they believe they will be able to redeem before a gate is imposed, or that sponsor support will prevent the gate from ever being used. While the rule requires disclosure of sponsor support, it unfortunately does little to address the moral hazard that is created by it.

In addition to which, Ms. Stein is a whole lot younger and better looking than the average SEC commissioner. I wonder if she’s married, and if she’d like to meet a nice Canadian preferred share specialist.

Commissioner Michael S. Piwowar makes an argument I don’t buy:

As a threshold matter, there is no evidence that money market funds themselves pose any threat to the stability of the U.S. financial system. Rather, if there were any systemic risk related to the money markets, it would be over-reliance by financial institutions, particularly banks, on the money markets for short-term funding. In fact, it has been argued that the reason Treasury instituted the guarantee program in 2008 was to reduce financial pressure on banks that had guaranteed the commercial paper of off-balance sheet conduits established by the banks with the approval of the Federal Reserve.[5] As I have said before, if the banking regulators are concerned by banks’ over-reliance on short-term funding from money market funds, then they have the authority to address this bank regulatory shortcoming directly. Nothing in the Dodd-Frank Act weakened or repealed this authority.

[5] See Peter Wallison, Money Market Funds Were a Victim, Not a Cause, Of the Financial Crisis (May 2, 2014) available at [LINK]

Wallison’s linked article states:

It was always a bit implausible that Treasury would set up an insurance system just to protect the shareholders of MMFs against what many were calling a “run.” What interest could Treasury possibly have in whether MMF shareholders suffer losses?

But there’s another and more plausible reason for what Treasury did. By the mid-2000s, MMFs were a major financing source for $1.3 trillion in commercial paper that had been issued by off-balance sheet entities established and guaranteed by the largest U.S. banks. These entities, known as asset backed commercial paper conduits (ABCP conduits) had been set up with the approval of the Fed and had invested in prime and subprime mortgage-backed securities. Supporting long term assets like mortgages with short term commercial paper is profitable, but risky. If the mortgages begin to lose value, the financing sources may not roll over, and what would the banks do then?

These facts provide a completely different perspective than the conventional view of the of the Treasury’s action. It was not to save the shareholders of the MMFs — there was literally no reason for the Treasury to do that — but to ease the financial pressures on the banks that had guaranteed the commercial paper of their off-balance sheet conduits. It follows that in any future crisis — unless the banks are again allowed by the Fed to establish ABCP conduits — there is no likelihood that the Treasury will seek to use taxpayer funds to protect the shareholders of MMFs, even if one or more of those MMFs break the buck.

I don’t buy it. There’s been considerable commentary – reported at various times on PrefBlog, like f’rinstance in the post BIS Releases March 2009 Quarterly Review – that it was the European banks that were put at risk by a US MMF collapse, which in turn could have fed into global systemic collapse; or, if not collapse, then perhaps something even worse than what actually happened. So let’s just ignore Piwowar and his threshold matters.

And even PrefBlog’s favourite whipping boy, Commissioner Luis A. Aguilar, had a useful link, although I can’t say he actually proved his point:

Some observers, including staff at the Federal Reserve Bank of New York, have suggested the possibility that fees and gates may themselves cause pre-emptive runs, by encouraging investors to redeem their shares before fees and gates are imposed.[29] However, as discussed at length in today’s release, the Federal Reserve staff’s conclusion that fees and gates may cause pre-emptive runs is based on a model whose assumptions and features are different than the reforms we are adopting today.[30] Accordingly, as noted in the release, the Federal Reserve paper’s findings regarding the risks of pre-emptive redemptions are not likely to apply.[31]

[29] See, e.g., Federal Reserve Bank of New York Staff Report, Gates, Fees, and Preemptive Runs (Apr. 2014), available at http://www.newyorkfed.org/research/staff_reports/sr670.html.

[30] Id. For example, the Federal Reserve Bank of New York Staff Report relies upon a model that assumes that fees or gates are imposed only when a fund’s liquid assets are fully depleted. In contrast, under today’s reforms, fees or gates may be imposed while the fund still has substantial liquid assets, and thus investors may be dissuaded from pre-emptively redeeming from funds with substantial internal liquidity because the fund is more likely to be able to readily satisfy redemptions without adversely impacting the fund’s pricing. Adopting Release, supra note 1, at 63-66. Another important difference is that our reforms include a floating NAV for a significant portion of money market funds, which may have the effect of altering the behavior of investors under a model that took such a combination of effects into account. Id. at 65. Another significant difference is that our reforms include a floating NAV for institutional prime money market funds, which constitute a sizeable portion of all money market funds, but the model assumes a stable NAV. The floating NAV requirement may encourage those investors who are least able to bear risk of loss to redirect their investments to other investment opportunities (e.g., government money market funds), and this may have the secondary effect of removing from the funds those investors most prone to redeem should a liquidity event occur for which fees or gates could be imposed.

[31] Adopting Release, supra note 1, at 65-66.

Isn’t the US system great? You never see anything like this in Canadian regulatory discussion. The banks wouldn’t approve.

There has been a mass rebranding of the DEX bond indices to FTSE TMX Canada bond indices.

Has anyone here ever seen anything like this? Concrete paviors with a 3:1 plan ratio. I took this picture on Yorkville Avenue between Yonge and Bay.

All the stuff I can find on the internet merely talks about the aspect ratio – that is, the longest dimension divided by the vertical length, what I would call the depth, but what they call the thickness, noting only that 3:1 or less is required for vehicular traffic.

All I can find regarding the plan ratio simply notes that 2:1 or 3:1 can be set in an interlocking herringbone pattern … fine, but why not a 4:1 plan ratio? Would that make the aspect ratio silly, or unsafe, or uneconomic, or what? Certainly if a plan ratio of 4:1 was to be used for vehicular traffic, and therefore requiring a maximum 3:1 aspect ratio, then the depth would be greater than width and the installers would feel pretty silly. But are there other reasons?

And are there any advantages or disadvantages to a 3:1 plan ratio relative to a 2:1 plan ratio?

2014-07-23 18.00.19
Click for Big

It was a good day for the Canadian preferred share market, with PerpetualDiscounts up 10bp and both FixedResets and DeemedRetractibles gaining 7bp. Volatility was anemic. Volume was average.

PerpetualDiscounts now yield 5.09%, equivalent to 6.62% interest at the standard equivalency factor of 1.3x. Long corporates now yield about 4.2%, so the pre-tax interest-equivalent spread is now about 240bp, unchanged from July 9.

HIMIPref™ Preferred Indices
These values reflect the December 2008 revision of the HIMIPref™ Indices

Values are provisional and are finalized monthly
Index Mean
Current
Yield
(at bid)
Median
YTW
Median
Average
Trading
Value
Median
Mod Dur
(YTW)
Issues Day’s Perf. Index Value
Ratchet 3.07 % 3.06 % 19,911 19.52 1 0.0000 % 2,584.9
FixedFloater 4.19 % 3.41 % 30,232 18.61 1 1.4752 % 4,145.6
Floater 2.85 % 2.94 % 46,485 19.87 4 0.3412 % 2,785.5
OpRet 4.00 % -9.33 % 80,344 0.08 1 0.0000 % 2,733.9
SplitShare 4.25 % 4.00 % 48,216 4.01 6 0.1197 % 3,120.5
Interest-Bearing 0.00 % 0.00 % 0 0.00 0 0.0000 % 2,499.9
Perpetual-Premium 5.52 % -4.81 % 83,982 0.09 17 -0.0139 % 2,429.9
Perpetual-Discount 5.23 % 5.09 % 109,792 15.21 20 0.0958 % 2,584.9
FixedReset 4.40 % 3.59 % 203,446 8.57 77 0.0702 % 2,559.6
Deemed-Retractible 4.98 % -0.29 % 123,904 0.09 43 0.0713 % 2,554.3
FloatingReset 2.66 % 2.12 % 95,384 3.82 6 -0.1834 % 2,520.8
Performance Highlights
Issue Index Change Notes
MFC.PR.F FixedReset 1.17 % YTW SCENARIO
Maturity Type : Hard Maturity
Maturity Date : 2025-01-31
Maturity Price : 25.00
Evaluated at bid price : 23.29
Bid-YTW : 4.00 %
BAM.PR.G FixedFloater 1.48 % YTW SCENARIO
Maturity Type : Limit Maturity
Maturity Date : 2044-07-23
Maturity Price : 22.78
Evaluated at bid price : 22.70
Bid-YTW : 3.41 %
Volume Highlights
Issue Index Shares
Traded
Notes
TD.PF.A FixedReset 97,601 RBC crossed 25,000 at 25.36. Nesbitt bought 10,000 from TD at 25.30.
YTW SCENARIO
Maturity Type : Limit Maturity
Maturity Date : 2044-07-23
Maturity Price : 23.24
Evaluated at bid price : 25.30
Bid-YTW : 3.61 %
ENB.PF.E FixedReset 57,200 Recent new issue.
YTW SCENARIO
Maturity Type : Limit Maturity
Maturity Date : 2044-07-23
Maturity Price : 23.10
Evaluated at bid price : 24.97
Bid-YTW : 4.11 %
GWO.PR.P Deemed-Retractible 53,510 TD crossed 50,000 at 25.80.
YTW SCENARIO
Maturity Type : Call
Maturity Date : 2020-03-31
Maturity Price : 25.25
Evaluated at bid price : 25.72
Bid-YTW : 5.07 %
BNS.PR.Q FixedReset 47,000 RBC crossed 29,900 at 25.45. Desjardins crossed 15,000 at the same price.
YTW SCENARIO
Maturity Type : Call
Maturity Date : 2018-10-25
Maturity Price : 25.00
Evaluated at bid price : 25.43
Bid-YTW : 3.17 %
PVS.PR.D SplitShare 35,234 Recent new issue and ticker change.
YTW SCENARIO
Maturity Type : Hard Maturity
Maturity Date : 2021-10-08
Maturity Price : 25.00
Evaluated at bid price : 24.40
Bid-YTW : 4.95 %
BNS.PR.P FixedReset 33,400 RBC crossed 30,000 at 25.48.
YTW SCENARIO
Maturity Type : Call
Maturity Date : 2018-04-25
Maturity Price : 25.00
Evaluated at bid price : 25.45
Bid-YTW : 2.83 %
There were 30 other index-included issues trading in excess of 10,000 shares.
Wide Spread Highlights
Issue Index Quote Data and Yield Notes
BAM.PR.G FixedFloater Quote: 22.70 – 23.70
Spot Rate : 1.0000
Average : 0.6944

YTW SCENARIO
Maturity Type : Limit Maturity
Maturity Date : 2044-07-23
Maturity Price : 22.78
Evaluated at bid price : 22.70
Bid-YTW : 3.41 %

FTS.PR.F Perpetual-Discount Quote: 24.52 – 24.82
Spot Rate : 0.3000
Average : 0.2092

YTW SCENARIO
Maturity Type : Limit Maturity
Maturity Date : 2044-07-23
Maturity Price : 24.23
Evaluated at bid price : 24.52
Bid-YTW : 5.06 %

FTS.PR.H FixedReset Quote: 21.45 – 21.82
Spot Rate : 0.3700
Average : 0.2874

YTW SCENARIO
Maturity Type : Limit Maturity
Maturity Date : 2044-07-23
Maturity Price : 21.45
Evaluated at bid price : 21.45
Bid-YTW : 3.51 %

GWO.PR.H Deemed-Retractible Quote: 24.10 – 24.40
Spot Rate : 0.3000
Average : 0.2263

YTW SCENARIO
Maturity Type : Hard Maturity
Maturity Date : 2025-01-31
Maturity Price : 25.00
Evaluated at bid price : 24.10
Bid-YTW : 5.37 %

PWF.PR.G Perpetual-Premium Quote: 25.40 – 25.58
Spot Rate : 0.1800
Average : 0.1132

YTW SCENARIO
Maturity Type : Call
Maturity Date : 2014-08-22
Maturity Price : 25.00
Evaluated at bid price : 25.40
Bid-YTW : -14.46 %

IFC.PR.C FixedReset Quote: 25.77 – 25.94
Spot Rate : 0.1700
Average : 0.1103

YTW SCENARIO
Maturity Type : Call
Maturity Date : 2016-09-30
Maturity Price : 25.00
Evaluated at bid price : 25.77
Bid-YTW : 2.88 %

Market Action

July 22, 2014

There are musings about a possible drop in Canadian policy rates:

The Bank of Canada says it’s just going with the flow: If economic data in the months ahead get stronger than currently expected, it will ready for higher interest rates; if economic conditions unexpectedly worsen, the central bank says it is prepared to cut its benchmark interest rate from its already ultra-low setting of 1 per cent. For now, the central bank is totally neutral.

Craig Alexander, chief economist at Toronto-Dominion Bank, doesn’t really believe it. His latest commentary is inspired by a question about whether the central bank really could surprise and cut interest rates. Mr. Alexander politely considers the question, saying the possibility “is not ridiculous given some of the recent economic developments.” Then he goes about demolishing the idea almost entirely.

Mr. Alexander’s report sets the backdrop:

The Bank of Canada has been on hold for an unprecedented 45 months, and TD Economics expects the overnight rate to remain unchanged for at least another year. Futures markets are in agreement, as they anticipate the next move in rates will be a hike, but not until the fourth quarter of 2015. This consensus view is predicated on the belief that the economy will deliver only moderate growth, gradually eating up the available economic slack and closing the output gap in early 2016. The economic backdrop augurs that inflation will remain close to the Bank’s 2% target, implying no rush to reduce the degree of monetary stimulus, but also no need to lower rates.

There’s not much action in the US bond market:

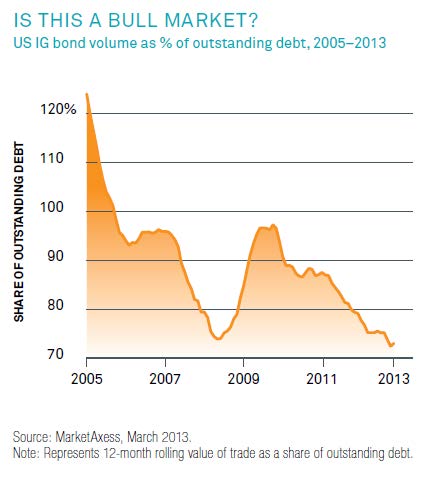
Trading in U.S. government bonds has dropped 25 percent in the past few weeks from the comparable period last year, according to Federal Reserve data. Investment-grade (NTMBIV) and junk-bond trading have plunged 17 percent and 8 percent, respectively, since the end of the second quarter, according to Financial Industry Regulatory Authority data.

This means that, for one, it’s harder for investors to shuffle their portfolios even if they want to because there are fewer people out there looking to sell or buy. And, two, this eats into bond dealers’ already waning trading revenues.

Adding to the summer doldrums is a declining volume of corporate-debt sales. Companies have sold an average $22.7 billion of dollar-denominated bonds each week this month, compared with an average $36.2 billion per week in June, according to data compiled by Bloomberg. Investors typically transact more frequently in bonds that have been sold within the prior few months.

How much of this is economics and how much is regulation? What are the implications for capital markets if liquidity remains low for an extended period? Does anybody know? Does anybody care?

Meanwhile, there is politics being played with the Jackson Hole guest list:

As the Federal Reserve Bank of Kansas City prepares to host next month’s annual gathering of central bankers in Wyoming, seasoned Fed watchers from the financial markets, including the chief U.S. economists of the biggest American banks, aren’t being invited, according to past participants.

The exclusion of Wall Street may reflect a dispute between some regional Fed bank presidents who are more worried by loose monetary policy than Fed governors in Washington including Yellen, said Pippa Malmgren, founder of DRPM Group in London and another frequent delegate who won’t be attending this year.

“I fully support disinviting the chief economists of the largest beneficiaries of quantitative easing,” Malmgren said, referring to the Fed’s program of monthly bond purchases, which is on course to end this year.

“This weakens the support for the Yellen camp and gives her opponents more chance to make their case” during the meeting, said Malmgren, a former adviser to U.S. President George W. Bush.

It seems very odd to me that the Fed isn’t inviting its best salesmen to their trade show.

I moaned yesterday about an incomprehensible tax dodge being controversially used by Renaissance Capital. Matt Levine explains it.

DBRS has confirmed W.PR.H and W.PR.J at Pfd-2(low):

Westcoast is expected to continue its significant expansion projects in the medium term to take advantage of the strong exploration and unconventional drilling activity in Western Canada. The Company invested $946 million in capex in 2013, including $528 million of expansion capital, with an additional $950 million in capex planned for 2014. Increasing earnings and cash flow from expansions placed into service to date have resulted in relatively strong credit ratios. Although a major portion of capital spending is expected to be funded through the Company’s operating cash flow, incremental financing is likely from increased long-term debt issuance. While the capex program is substantial, spending is allocated to low-risk gathering and processing (G&P) and pipeline segments, and underpinned by long-term contractual commitments, which will continue to support Westcoast’s relatively strong business risk profile. DBRS expects the Company to fund its capital expenditure prudently and maintain credit metrics in line with the current rating category.

It was a negative day for the Canadian preferred share market, with PerpetualDiscounts flat, FixedResets down 22bp and DeemedRetractibles off 6bp. Volatility was average. Volume was quite high, probably due to portfolio shuffling after the new issue announcements from BMO, FixedReset, 3.80%+222 and TD, FixedReset, 3.80%+227.

HIMIPref™ Preferred Indices
These values reflect the December 2008 revision of the HIMIPref™ Indices

Values are provisional and are finalized monthly
Index Mean
Current
Yield
(at bid)
Median
YTW
Median
Average
Trading
Value
Median
Mod Dur
(YTW)
Issues Day’s Perf. Index Value
Ratchet 3.07 % 3.06 % 20,715 19.53 1 0.4115 % 2,584.9
FixedFloater 4.25 % 3.47 % 29,444 18.50 1 -1.8860 % 4,085.3
Floater 2.85 % 2.94 % 46,229 19.89 4 -0.2709 % 2,776.0
OpRet 4.00 % -9.46 % 81,590 0.08 1 0.4704 % 2,733.9
SplitShare 4.26 % 3.99 % 44,640 4.02 6 0.0000 % 3,116.7
Interest-Bearing 0.00 % 0.00 % 0 0.00 0 0.4704 % 2,499.9
Perpetual-Premium 5.52 % -3.41 % 84,586 0.08 17 -0.0193 % 2,430.2
Perpetual-Discount 5.23 % 5.15 % 110,342 15.21 20 0.0043 % 2,582.5
FixedReset 4.40 % 3.59 % 201,271 8.57 77 -0.2235 % 2,557.8
Deemed-Retractible 4.98 % -1.15 % 124,714 0.09 43 -0.0572 % 2,552.4
FloatingReset 2.65 % 0.72 % 98,833 0.16 6 -0.1308 % 2,525.4
Performance Highlights
Issue Index Change Notes
MFC.PR.F FixedReset -2.33 % YTW SCENARIO
Maturity Type : Hard Maturity
Maturity Date : 2025-01-31
Maturity Price : 25.00
Evaluated at bid price : 23.02
Bid-YTW : 4.13 %
BAM.PR.G FixedFloater -1.89 % YTW SCENARIO
Maturity Type : Limit Maturity
Maturity Date : 2044-07-22
Maturity Price : 22.54
Evaluated at bid price : 22.37
Bid-YTW : 3.47 %
ENB.PR.Y FixedReset -1.03 % YTW SCENARIO
Maturity Type : Limit Maturity
Maturity Date : 2044-07-22
Maturity Price : 22.78
Evaluated at bid price : 24.02
Bid-YTW : 4.01 %
CIU.PR.C FixedReset 1.19 % YTW SCENARIO
Maturity Type : Limit Maturity
Maturity Date : 2044-07-22
Maturity Price : 21.64
Evaluated at bid price : 22.06
Bid-YTW : 3.31 %
Volume Highlights
Issue Index Shares
Traded
Notes
BMO.PR.S FixedReset 427,622 RBC bought 13,300 from anonymous at 25.73. Desjardins crossed 85,000 at 25.75. Nesbitt crossed 50,000 at 25.75; Scotia crossed 200,000 at 25.75.
YTW SCENARIO
Maturity Type : Limit Maturity
Maturity Date : 2044-07-22
Maturity Price : 23.36
Evaluated at bid price : 25.62
Bid-YTW : 3.66 %
CM.PR.K FixedReset 327,845 Called for redemption July 31.
YTW SCENARIO
Maturity Type : Hard Maturity
Maturity Date : 2022-01-31
Maturity Price : 25.00
Evaluated at bid price : 24.98
Bid-YTW : 3.67 %
CM.PR.O FixedReset 161,825 Scotia crossed 20,000 at 25.48. Desjardins crossed 30,000 at 25.50. RBC crossed 50,000 at 25.50 and 13,400 at 25.46.
YTW SCENARIO
Maturity Type : Limit Maturity
Maturity Date : 2044-07-22
Maturity Price : 23.29
Evaluated at bid price : 25.40
Bid-YTW : 3.65 %
TD.PR.Y FixedReset 143,000 TD crossed 69,700 at 25.40.
YTW SCENARIO
Maturity Type : Call
Maturity Date : 2018-10-31
Maturity Price : 25.00
Evaluated at bid price : 25.40
Bid-YTW : 3.15 %
TD.PR.I FixedReset 126,172 Called for redemption July 31.
YTW SCENARIO
Maturity Type : Call
Maturity Date : 2014-08-30
Maturity Price : 25.00
Evaluated at bid price : 24.98
Bid-YTW : 5.62 %
ENB.PF.E FixedReset 103,688 Recent new issue.
YTW SCENARIO
Maturity Type : Limit Maturity
Maturity Date : 2044-07-22
Maturity Price : 23.10
Evaluated at bid price : 24.96
Bid-YTW : 4.11 %
CM.PR.M FixedReset 101,649 Called for redemption July 31.
YTW SCENARIO
Maturity Type : Hard Maturity
Maturity Date : 2022-01-31
Maturity Price : 25.00
Evaluated at bid price : 24.98
Bid-YTW : 5.83 %
There were 44 other index-included issues trading in excess of 10,000 shares.
Wide Spread Highlights
Issue Index Quote Data and Yield Notes
PWF.PR.I Perpetual-Premium Quote: 25.37 – 25.60
Spot Rate : 0.2300
Average : 0.1518

YTW SCENARIO
Maturity Type : Call
Maturity Date : 2014-08-21
Maturity Price : 25.00
Evaluated at bid price : 25.37
Bid-YTW : -13.24 %

GWO.PR.P Deemed-Retractible Quote: 25.65 – 25.89
Spot Rate : 0.2400
Average : 0.1619

YTW SCENARIO
Maturity Type : Call
Maturity Date : 2020-03-31
Maturity Price : 25.25
Evaluated at bid price : 25.65
Bid-YTW : 5.12 %

RY.PR.T FixedReset Quote: 24.97 – 25.19
Spot Rate : 0.2200
Average : 0.1430

YTW SCENARIO
Maturity Type : Call
Maturity Date : 2014-08-24
Maturity Price : 25.00
Evaluated at bid price : 24.97
Bid-YTW : 1.33 %

CM.PR.G Perpetual-Premium Quote: 25.46 – 25.72
Spot Rate : 0.2600
Average : 0.1837

YTW SCENARIO
Maturity Type : Call
Maturity Date : 2014-08-21
Maturity Price : 25.00
Evaluated at bid price : 25.46
Bid-YTW : -17.44 %

MFC.PR.F FixedReset Quote: 23.02 – 23.41
Spot Rate : 0.3900
Average : 0.3188

YTW SCENARIO
Maturity Type : Hard Maturity
Maturity Date : 2025-01-31
Maturity Price : 25.00
Evaluated at bid price : 23.02
Bid-YTW : 4.13 %

GWO.PR.Q Deemed-Retractible Quote: 24.85 – 25.05
Spot Rate : 0.2000
Average : 0.1289

YTW SCENARIO
Maturity Type : Hard Maturity
Maturity Date : 2025-01-31
Maturity Price : 25.00
Evaluated at bid price : 24.85
Bid-YTW : 5.30 %

Market Action

July 21, 2014

Matt Levine of Bloomberg has some sensible things to say about institutions victimized by evil derivatives:

This is a general rule to keep in mind when reading about governments and companies that were victimized by swaps that they didn’t understand: Governments and companies don’t understand anything. Governments and companies don’t have brains. Governments and companies do have human agents, and those human agents have brains, and they are capable of understanding many things. Different agents might or might not be capable of understanding the particular formulas at issue here. But most agents are capable of understanding (1) that getting a low low teaser rate now probably means paying a high high rate later, (2) that there are ways of saying that that don’t sound like that, (3) that their interests and the interests of the government or company they work for are not perfectly aligned, and (4) that those interests are likely to drift further apart over time.

A story about an incomprehensible tax dodge is noteworthy for two things:

Executives from Renaissance, founded by billionaire mathematician James Simons, are scheduled to testify about the transactions tomorrow in Washington, as are representatives of Barclays and Deutsche Bank.

Renaissance, based in East Setauket, New York, compiled one of the best records in investing history by using advanced mathematics and computer algorithms to identify mispriced securities. Its Medallion fund, open almost exclusively to Renaissance employees, returned more than 35 percent annualized over more than two decades.

“billionaire mathematician”. You don’t hear those two words together very often! The other point is that they’ve been able to do so well – outperformance is entirely possible for those who know what they’re doing.

It was a good day for the Canadian preferred share market, with PerpetualDiscounts up 7bp, FixedResets gaining 5bp and DeemedRetractibles winning 10bp. Volatility was almost non-existent. Volume was extremely low.

HIMIPref™ Preferred Indices
These values reflect the December 2008 revision of the HIMIPref™ Indices

Values are provisional and are finalized monthly
Index Mean
Current
Yield
(at bid)
Median
YTW
Median
Average
Trading
Value
Median
Mod Dur
(YTW)
Issues Day’s Perf. Index Value
Ratchet 3.09 % 3.07 % 20,709 19.50 1 0.0000 % 2,574.3
FixedFloater 4.17 % 3.40 % 28,801 18.65 1 -0.0876 % 4,163.9
Floater 2.84 % 2.92 % 45,010 19.92 4 -0.2162 % 2,783.5
OpRet 4.02 % -4.07 % 78,744 0.08 1 -0.0783 % 2,721.1
SplitShare 4.26 % 3.95 % 44,048 4.02 6 0.3336 % 3,116.7
Interest-Bearing 0.00 % 0.00 % 0 0.00 0 -0.0783 % 2,488.2
Perpetual-Premium 5.52 % -5.34 % 82,168 0.09 17 0.0300 % 2,430.7
Perpetual-Discount 5.23 % 5.13 % 111,916 15.24 20 0.0703 % 2,582.4
FixedReset 4.38 % 3.54 % 200,305 6.57 77 0.0522 % 2,563.5
Deemed-Retractible 4.97 % 0.36 % 123,261 0.10 43 0.1027 % 2,553.9
FloatingReset 2.65 % 0.72 % 98,280 0.16 6 0.0131 % 2,528.7
Performance Highlights
Issue Index Change Notes
PVS.PR.B SplitShare 1.30 % YTW SCENARIO
Maturity Type : Hard Maturity
Maturity Date : 2019-01-10
Maturity Price : 25.00
Evaluated at bid price : 24.90
Bid-YTW : 4.60 %
Volume Highlights
Issue Index Shares
Traded
Notes
TD.PR.K FixedReset 203,248 Called for redemption July 31.
YTW SCENARIO
Maturity Type : Call
Maturity Date : 2014-08-30
Maturity Price : 25.00
Evaluated at bid price : 24.98
Bid-YTW : 5.48 %
ENB.PF.E FixedReset 104,420 Recent new issue.
YTW SCENARIO
Maturity Type : Limit Maturity
Maturity Date : 2044-07-21
Maturity Price : 23.10
Evaluated at bid price : 24.95
Bid-YTW : 4.11 %
BMO.PR.S FixedReset 84,556 Nesbitt crossed 25,000 at 25.76; RBC bought 10,000 from Scotia at 25.79.
YTW SCENARIO
Maturity Type : Call
Maturity Date : 2019-05-25
Maturity Price : 25.00
Evaluated at bid price : 25.73
Bid-YTW : 3.27 %
TD.PF.A FixedReset 74,550 Desjardins crossed 58,600 at 25.50.
YTW SCENARIO
Maturity Type : Limit Maturity
Maturity Date : 2044-07-21
Maturity Price : 23.30
Evaluated at bid price : 25.50
Bid-YTW : 3.56 %
CM.PR.K FixedReset 65,000 Called for redemption July 31.
YTW SCENARIO
Maturity Type : Hard Maturity
Maturity Date : 2022-01-31
Maturity Price : 25.00
Evaluated at bid price : 24.98
Bid-YTW : 3.66 %
ENB.PF.C FixedReset 54,685 TD crossed 10,000 at 25.12.
YTW SCENARIO
Maturity Type : Limit Maturity
Maturity Date : 2044-07-21
Maturity Price : 23.17
Evaluated at bid price : 25.15
Bid-YTW : 4.09 %
There were 16 other index-included issues trading in excess of 10,000 shares.
Wide Spread Highlights
Issue Index Quote Data and Yield Notes
CIU.PR.C FixedReset Quote: 21.80 – 22.51
Spot Rate : 0.7100
Average : 0.5664

YTW SCENARIO
Maturity Type : Limit Maturity
Maturity Date : 2044-07-21
Maturity Price : 21.45
Evaluated at bid price : 21.80
Bid-YTW : 3.35 %

IAG.PR.F Deemed-Retractible Quote: 26.02 – 26.41
Spot Rate : 0.3900
Average : 0.2665

YTW SCENARIO
Maturity Type : Call
Maturity Date : 2018-03-31
Maturity Price : 25.25
Evaluated at bid price : 26.02
Bid-YTW : 5.07 %

BAM.PR.E Ratchet Quote: 24.30 – 24.60
Spot Rate : 0.3000
Average : 0.2191

YTW SCENARIO
Maturity Type : Limit Maturity
Maturity Date : 2044-07-21
Maturity Price : 23.86
Evaluated at bid price : 24.30
Bid-YTW : 3.07 %

PWF.PR.A Floater Quote: 20.00 – 20.30
Spot Rate : 0.3000
Average : 0.2266

YTW SCENARIO
Maturity Type : Limit Maturity
Maturity Date : 2044-07-21
Maturity Price : 20.00
Evaluated at bid price : 20.00
Bid-YTW : 2.65 %

BAM.PR.M Perpetual-Discount Quote: 21.36 – 21.51
Spot Rate : 0.1500
Average : 0.0903

YTW SCENARIO
Maturity Type : Limit Maturity
Maturity Date : 2044-07-21
Maturity Price : 21.36
Evaluated at bid price : 21.36
Bid-YTW : 5.62 %

IAG.PR.A Deemed-Retractible Quote: 23.14 – 23.47
Spot Rate : 0.3300
Average : 0.2736

YTW SCENARIO
Maturity Type : Hard Maturity
Maturity Date : 2025-01-31
Maturity Price : 25.00
Evaluated at bid price : 23.14
Bid-YTW : 5.61 %

Market Action

July 18, 2014

It seems that the Canadian economy is picking up a bit:

Consumers are still driving growth in Canada’s economy, with indicators showing faster inflation led by higher food and clothing costs and increased auto wholesales adding to recent housing-market strength.

The consumer price index quickened to a two-year high of 2.4 percent in June, and a 13.3 percent jump in automobile receipts led a 2.2 percent rise in wholesale sales, according to reports today from Ottawa-based Statistics Canada. A July 15 realtor report showed home resales reached a four-year high with prices up 6.9 percent from a year earlier.

The figures suggest indebted consumers are continuing to shoulder the burden of growth as policy makers such as Bank of Canada Governor Stephen Poloz await a rebound in business investment to bring the economy to full output. Poloz kept his key lending at 1 percent two days ago and stressed weak exports and slack in the economy will hold down inflation through a temporary price surge.

Canada’s ratio of household debt to disposable income rose to a record last year before two quarterly declines through March. Credit-market debt such as mortgages fell to 163.2 percent of disposable income, compared with a revised 163.9 percent in the fourth quarter and a record 164.1 percent in the third quarter of last year, Statistics Canada said June 19.

Perhaps it’s due to the idea that our houses will make us all rich?

Meanwhile, the Bloomberg Nanos Canadian Confidence Index, which measures the economic mood of Canadians through a weekly survey, shows that people in this country have become upbeat – especially when they think about their property values. It found that perceptions related to the value of real estate in people’s neighbourhoods are 10 percentage points above the six-year average and seven points above the 2014 average.

“Consumer confidence in Canada is noticeably propelled by views on real estate,” Nanos Research Group chairman Nik Nanos observes.

And we’ll get even richer from our condominium rentals!

Toronto condominium sales jumped in the second quarter, as investors in Canada’s biggest city soaked up a wave of supply to feed demand for rentals.

Unit sales rose 10 percent to 6,553 in the three months ended in June from the same period a year ago, according to figures from the Toronto Real Estate Board. That follows a 9 percent annual gain in the first quarter.

The average selling price rose 5.5 percent to a record C$367,010 ($342,000), after a 5.6 percent advance in the first quarter.

“Many of these are bought by investors to rent out and there’s just not enough rental supply,” Paul Etherington, president of the board, said by phone today.“The prices will continue to go up in the future but I don’t see them going up as dramatically.”

About a quarter of new condominiums are purchased by investors who rent the units to residents in a city where the supply of purpose-built rentals is limited, he said.

Groupthink, and its perceived desirability among bond pseudo-managers, has reached global proportions:

Junk bond investors have had enough of borrowers in Europe eroding safeguards as sales of the high-yield, high-risk debt surge to a record $110 billion.

Representatives from at least six firms met in London last week with the Association for Financial Markets in Europe to discuss reinforcing language in documents governing bond sales that protect investors, according to Gary Simmons, director of the group’s high-yield division. Legal & General Investment Management, Castle Hill Asset Management and Pioneer Investments are among money managers listed as members, according to AFME.

Bondholders are seeking to challenge private-equity firms and bankers who arrange debt sales about changes to terms, including shortening the time during which securities can’t be repaid and diluting change of control clauses protecting bondholders in a takeover. The weakening of covenants has drawn warnings from policy makers, with Federal Reserve Chair Janet Yellen saying last month she was concerned about “reach-for-yield behavior.”

“In a hot market, pricing can get tighter but safeguards such as call protection and change of control should stay the same,” said Henry Craik-White, a senior investment analyst at ECM Asset Management who attended AFME’s meeting. “The correct approach is to reach out to the wider investor community and highlight the issues before they ruin the market for everybody.”

Well, golly, we wouldn’t want anybody to ruin the market for everybody, would we? That might mean that long-term performance for some firms might exceed the long-term performance of other firms, which would be disastrous. What would be the point of networking?

Brazil’s Caixa bank might be giving us a foretaste of the next crisis:

As Brazilian state-owned bank Caixa Economica Federal prepared to sell bonds this month, Marco Aurelio de Sa, the head of trading at Credit Agricole SA, told his clients to stay away.

The securities are too risky because Caixa is the lender most vulnerable to losses after a court ruling against the nation’s banks in May fueled concern they may also lose related lawsuits that would put them on the hook for an estimated 341.5 billion reais ($151 billion). The costs could force the government to re-capitalize Caixa, causing the bank to exercise a clause in the bonds to write off the principal and interest.

“Caixa could have serious capitalization issues if the Supreme Court rules against the banks, and then there’s a big risk the bond is written off,” de Sa, a 20-year emerging-market veteran, said in an e-mail. “Even if it’s a quasi-sovereign, the clauses are very clear on what could lead to a write-off. The returns aren’t enough to compensate for the risk. We didn’t recommend it to clients.”

But American investment grade credit remains popular:

They piled back into benchmark U.S. Treasuries (USGG10YR) yesterday after a civilian plane got shot down in eastern Ukraine and as Israeli troops entered Gaza. They accelerated withdrawals from the riskiest debt in the past week, yanking $2.3 billion from high-yield bond funds, the biggest outflow since June 2013, according to a Wells Fargo & Co. (WFC) report.

Wall Street’s largest bond dealers cut their net junk-bond holdings to $4.8 billion in the week ended July 9, the lowest level since the Federal Reserve began reporting the data in April 2013.

Buyers funneled $2.4 billion into investment-grade corporate debt funds, the 30th consecutive week of deposits, the Wells Fargo report shows. Money is flowing in even though analysts predict a rise in benchmark yields by year-end, which would eat into the notes’ returns.

It was a modestly negative day for the Canadian preferred share market, with PerpetualDiscounts off 2bp, FixedResets losing 5bp and DeemedRetractibles down 3bp. Volatility was negligible. Volume was average.

HIMIPref™ Preferred Indices
These values reflect the December 2008 revision of the HIMIPref™ Indices

Values are provisional and are finalized monthly
Index Mean
Current
Yield
(at bid)
Median
YTW
Median
Average
Trading
Value
Median
Mod Dur
(YTW)
Issues Day’s Perf. Index Value
Ratchet 3.09 % 3.07 % 21,546 19.50 1 1.5886 % 2,574.3
FixedFloater 4.16 % 3.39 % 28,200 18.66 1 0.0877 % 4,167.5
Floater 2.84 % 2.92 % 45,489 19.94 4 -0.0810 % 2,789.6
OpRet 4.01 % -5.40 % 76,891 0.08 1 -0.2345 % 2,723.2
SplitShare 4.27 % 3.98 % 44,234 4.02 6 -0.1665 % 3,106.4
Interest-Bearing 0.00 % 0.00 % 0 0.00 0 -0.2345 % 2,490.1
Perpetual-Premium 5.52 % -4.47 % 81,926 0.09 17 0.0023 % 2,429.9
Perpetual-Discount 5.23 % 5.14 % 115,766 15.19 20 -0.0192 % 2,580.5
FixedReset 4.39 % 3.58 % 202,893 4.60 77 -0.0485 % 2,562.2
Deemed-Retractible 4.98 % 0.41 % 123,249 0.10 43 -0.0296 % 2,551.3
FloatingReset 2.66 % 0.72 % 93,766 0.16 6 -0.0262 % 2,528.4
Performance Highlights
Issue Index Change Notes
BAM.PR.E Ratchet 1.59 % YTW SCENARIO
Maturity Type : Limit Maturity
Maturity Date : 2044-07-18
Maturity Price : 23.86
Evaluated at bid price : 24.30
Bid-YTW : 3.07 %
Volume Highlights
Issue Index Shares
Traded
Notes
BMO.PR.K Deemed-Retractible 394,115 Scotia crossed 160,000 at 26.10. TD crossed two blocks of 40,000 each, both at the same price. RBC crossed 73,500 and 75,000, both at the same price again.
YTW SCENARIO
Maturity Type : Call
Maturity Date : 2014-08-17
Maturity Price : 25.75
Evaluated at bid price : 26.10
Bid-YTW : -2.24 %
BNS.PR.O Deemed-Retractible 280,388 Scotia crossed blocks of 80,000 and 50,000, both at 26.25; RBC crossed blocks of 74,800 and 75,000, both at the same price.
YTW SCENARIO
Maturity Type : Call
Maturity Date : 2014-08-17
Maturity Price : 25.75
Evaluated at bid price : 26.20
Bid-YTW : -17.23 %
HSB.PR.D Deemed-Retractible 277,787 Scotia crossed blocks of 108,900 and 100,000, both at 25.43. RBC crossed 40,000 at 25.43; TD crossed 25,000 at 25.43.
YTW SCENARIO
Maturity Type : Call
Maturity Date : 2014-08-17
Maturity Price : 25.25
Evaluated at bid price : 25.43
Bid-YTW : -0.75 %
CM.PR.O FixedReset 163,415 Scotia crossed 40,000 at 25.49. RBC crossed blocks of 50,000 and 25,000 at the same price; Nesbitt crossed 40,000 at the same price again.
YTW SCENARIO
Maturity Type : Call
Maturity Date : 2019-07-31
Maturity Price : 25.00
Evaluated at bid price : 25.47
Bid-YTW : 3.60 %
ENB.PF.E FixedReset 123,673 Recent new issue.
YTW SCENARIO
Maturity Type : Limit Maturity
Maturity Date : 2044-07-18
Maturity Price : 23.10
Evaluated at bid price : 24.97
Bid-YTW : 4.15 %
RY.PR.H FixedReset 89,273 RBC bought 19,400 from Nesbitt at 25.55, then crossed 24,000 at the same price.
YTW SCENARIO
Maturity Type : Limit Maturity
Maturity Date : 2044-07-18
Maturity Price : 23.28
Evaluated at bid price : 25.39
Bid-YTW : 3.65 %
There were 35 other index-included issues trading in excess of 10,000 shares.
Wide Spread Highlights
Issue Index Quote Data and Yield Notes
PVS.PR.B SplitShare Quote: 24.58 – 24.90
Spot Rate : 0.3200
Average : 0.1967

YTW SCENARIO
Maturity Type : Hard Maturity
Maturity Date : 2019-01-10
Maturity Price : 25.00
Evaluated at bid price : 24.58
Bid-YTW : 4.92 %

BAM.PR.G FixedFloater Quote: 22.82 – 23.25
Spot Rate : 0.4300
Average : 0.3188

YTW SCENARIO
Maturity Type : Limit Maturity
Maturity Date : 2044-07-18
Maturity Price : 22.87
Evaluated at bid price : 22.82
Bid-YTW : 3.39 %

MFC.PR.F FixedReset Quote: 23.50 – 23.83
Spot Rate : 0.3300
Average : 0.2308

YTW SCENARIO
Maturity Type : Hard Maturity
Maturity Date : 2025-01-31
Maturity Price : 25.00
Evaluated at bid price : 23.50
Bid-YTW : 3.94 %

NEW.PR.D SplitShare Quote: 32.40 – 32.69
Spot Rate : 0.2900
Average : 0.1995

YTW SCENARIO
Maturity Type : Call
Maturity Date : 2015-06-26
Maturity Price : 32.07
Evaluated at bid price : 32.40
Bid-YTW : 3.33 %

PVS.PR.D SplitShare Quote: 24.13 – 24.38
Spot Rate : 0.2500
Average : 0.1616

YTW SCENARIO
Maturity Type : Hard Maturity
Maturity Date : 2021-10-08
Maturity Price : 25.00
Evaluated at bid price : 24.13
Bid-YTW : 5.13 %

RY.PR.H FixedReset Quote: 25.39 – 25.69
Spot Rate : 0.3000
Average : 0.2386

YTW SCENARIO
Maturity Type : Limit Maturity
Maturity Date : 2044-07-18
Maturity Price : 23.28
Evaluated at bid price : 25.39
Bid-YTW : 3.65 %

Market Action

July 17, 2014

The Canadian Bond Investors Association has been mocked on PrefBlog on March 10 – at that time I said:

Yes, it will be a better world, as soon as there are more rules, more red tape, more regulators and more lawyers. It never occurs to any of these clowns that they have a choice regarding what to buy; if big enough, they can even approach issuers themselves with a proposal for a private placement.

… and again on March 14 (it was a good week):

Assiduous Readers will recognize that these are the same box-tickers who want bond covenants standardized in order to reduce the chance they might have to read a term sheet and, even worse, have to take a view on the value difference between slightly different covenants, as discussed on March 10.

… and now they are back in the news with more pathetic whimpering:

Royal Bank provided investors with insufficient information on short notice before its July 11 sale of C$1 billion ($930 million) in subordinated notes that can convert to equity, the first in Canada to comply with new international banking rules, The Canadian Bond Investors Association said in a letter yesterday to provincial securities regulators. Toronto-based Royal Bank said it met all requirements.

This time, however, there was an immediate rejoinder:

“The buyers could have gone on strike and not bought this,” said David Beattie, senior credit officer at Moody’s Investors Service, said by phone from Toronto.

Royal Bank “met all legal and regulatory requirements in issuing this transaction,” Sandra Nunes, a spokeswoman for the company, said in an e-mail yesterday. “The deal was well oversubscribed, and it has performed well in the secondary market.”

Since the July 11 sale at a yield of 152 basis points, or 1.52 percentage points, more than Canadian government debt, the spread on the Royal Bank bonds has narrowed to about 146 basis points, according to data compiled by Bloomberg.

My Lord. The fact that the obvious was pointed out (by David Beattie) is almost as astonishing as the fact that Bloomberg – which covers the world – did a better job than the Globe and Mail on reporting the issue. However, the Bloomberg / G&M comparison is old news. However, the G&M article is enhanced by a comment from “ontario7”, who must be some kind of genius:

If you don’t like the way bond is structured, then don’t buy it.

And look as the quoted spread! The issue has an initial coupon of 3.04%, so the spread is being quoted over five-year Canadas. Like I said, the sub-debt market consists of the sleazy selling to the stupid, so it’s no wonder the CBIA is confused.

So anyway, I looked up the CBIA admission of incompetence (bolding added):

In order to foster robust capital markets, the CBIA strongly advocates that issuers follow best practices, especially when marketing new issuers and new structures. Best practices for new debt structures include furnishing all material documents on a timely basis and with a minimum of three business days before pricing. They also include providing public investor calls with a scheduled opportunity for questions and answers and allowing rating agencies to provide preliminary reports. We believe these best practices are important for institutional investors to meet their fiduciary duty to clients. We believe that securities regulators share this view, and in fact demand this of investment managers they register.

The RBC NVCC issue of July 11, 2014 fell short of a number of these best practices. The syndicate provided only a brief, pre-recorded net roadshow to investors less than two days ahead of the deal and provided no opportunity to ask questions on the public call. When the deal came to market, no final rating agency comments were available to potential investors and only “expected” ratings were listed on the term sheet. The CBIA believes this is not in line with best practices when a deal of this significance is in the market involving an instrument that is new to institutional investors.

In our April 8, 2013 letter, the CBIA requested improved disclosure procedures during the new issue process. In our letter we wrote:

“Investors are often afforded insufficient time to review key terms and conditions of bond indentures when an issue comes to market.”

Further, we offered:

“As a minimum more time is required for review of indentures. For new issuers we believe that a minimum of three working days should be allowed for investors to review final form indentures and prospectus supplements and to disclose concerns with legal counsel.”

In summary, we ask that the Canadian securities regulators look at the new issue process for this security and whether it was appropriate in the circumstances.

So, in other words, the CBIA is able to chant the slogan “We believe these best practices are important for institutional investors to meet their fiduciary duty to clients”, but is unable to make the giant leap to the awesome concept that if you don’t feel you have enough information regarding a security to meet your fiduciary duty to clients YOU DON’T FUCKEN BUY THE SECURITY. The new issue was discussed on PrefBlog.

To be fair however, they did write an entirely sensible letter addressed to the Ministry of Finance, Bank of Canada and OSFI regarding bail-in debt:

We are writing to respectfully urge the Department of Finance to expedite the process for providing clarity on the “Bail-In” framework.

The CBIA formally commented to the Office of the Superintendent of Financial Institutions in a letter dated January 23, 2012 (attached). We stated that clarity on a regulatory regime guiding the “bail-in” of senior unsecured bank instruments and a full picture of the regulatory landscape are important to have in place ahead of NVCC issuance to allow proper risk assessment and pricing considerations. While there has been progress on some areas addressed in our letter, the critical issue of bail-in debt has not been addressed, thus leaving institutional fixed income investors in an uncomfortable position when evaluating NVCC instruments.

A worthy effort, but good luck with that. OSFI has been dragging its heels on the Life Insurance Regulatory Framework for literally years now, and Assiduous Readers will be well aware of how that has distorted pricing of preferred shares amongst Bank issues, insurance issues and unregulated issues.

There’s an interesting discussion of Maple bonds and liquidity from 2010:

EUROWEEK: How much of a concern is the lack of liquidity in the secondary market?

Lumb, CBA: You need to have at least three managers to make sure investors are confident of being able to trade some of their positions. Historically, the Maple market has always needed more managers than most. Having one just would not work.

DeRosa, MetLife: We see the liquidity in the bond market becoming increasingly more robust. Our efforts to augment our relationships with investors and dealers will help somewhat, as will our outreach to investors on the merits of our programme.

Costanzo, TD Securities: Secondary liquidity is key to any market’s success. If no one needed a secondary market, issuers would simply call investors directly and do a trade between themselves. But banks are involved in the process to commit balance sheet and provide a secondary market. That’s one of our core roles. What will be key to the continued development of the Maple market will be getting more international investors on board. This will provide an increased flow in the bonds as international investors will have different motivations to buy/sell — i.e. currency fluctuations — and therefore further the diversification and depth of the market. For this to happen, international investors need to have a reason to be involved. Canada is already very highly regarded by the global investment community. The currency story continues to be an attractive one. It would prove an even more attractive investment if yields were higher and more like the levels attainable in the Kangaroo market, which are currently about 300bp higher.

Marjaee, MFC Global: Secondary liquidity is a big issue. It was much better for some issues last year. There is still illiquidity when it comes to some subordinated bonds, especially when there is uncertainty about whether something will be called or extended. The recent deals have had hard maturities. We like that. It leaves no options on the table for the issuer, especially if the issue is priced to the shorter date and expectations have been created for the deal to be called. Liquidity has been good with the CBA issue.

Regrettably, the Maple bond market remains tiny. Even more regrettably, the regulatory push to reduce liquidity is succeeding:

CanPX, Canada’s government-mandated bond-market information service, will make trade prices freely available on its website amid a review by regulators concerned that smaller investors don’t have access to the data.

The for-profit joint venture of Canada’s major bond dealers and interdealer brokers has begun posting the previous day’s price and yield highs, lows and closing levels for all 340 corporate securities it tracks, CanPX said in a statement.

The move follows the Canadian Securities Administrators’ announcement last month it would review transparency in the C$390 billion ($363 billion) corporate bond market. The group, a coalition of Canada’s provincial and territorial securities regulators, questioned whether the private-sector model led by CanPX was working, and if more active regulation is needed.

A good chunk of government bonds have gone abroad:

Foreigners made their largest purchase of Canadian securities in two years in May, led by demand for provincial and federal government bonds.

The net purchases worth C$21.4 billion ($19.9 billion) in May included C$15.9 billion of bonds, and were more than double the April total, Statistics Canada said today in Ottawa.

Demand for bonds was led by a net C$6.3 billion purchase of provincial debt, the biggest since April 2009. Non-Canadian investors also bought C$6.9 billion of federal government debt, the most since May 2012 after sales of C$15.4 billion over the five prior months.

But government bonds did very well today:

Treasury (USGG2YR) 10-year notes rallied the most since March as reports of a Malaysian plane being shot down in eastern Ukraine and Israel’s military starting ground operations in the Gaza strip boosted refuge demand.

Thirty-year bond yields fell to the lowest level in more than a year after a Malaysian Boeing 777 with 295 aboard crashed near the Russian-Ukraine border added to to haven appeal linked to expanded sanctions against Russia for support of separatist rebels. The difference between five- and 30-year yields narrowed to the least since 2009 a day after Federal Reserve Chair Janet Yellen told lawmakers monetary stimulus is still needed, while increases in interest rates may occur sooner if the economy accelerates.

The 10-year yield dropped eight basis points, or 0.08 percentage point, to 2.45 percent at 4:59 p.m. New York time, according to Bloomberg Bond Trader Prices. The 2.5 percent notes maturing in May 2024 added 22/32, or $6.88 percent $1,000 face amount, to 100 15/32. The yield fell as much as nine basis points, the most since March 13.

U.S. 30-year yield fell seven basis points to 3.27 percent, touching the lowest level since June 2013.

According to CBid, closed at a startling 1.48% today.

Parakeet Poluz is hinting that low rates may be here to stay:

Bank of Canada Governor Stephen Poloz says the central bank may discuss the interest rate that would keep the economy at full output, a rate he said has been lowered following the global recession.

The central bank is researching what economists call a neutral interest rate, and will discuss the issue in the next quarterly economic forecast paper due in October, Poloz said in an interview aired today on CBC Radio’s “The Current” program.

Despite the fireworks in the government bond market, it was a relatively poor day for the Canadian preferred share market, with PerpetualDiscounts down 9bp, FixedResets flat and DeemedRetractibles off 4bp. Volatility was good. Volume was average.

HIMIPref™ Preferred Indices
These values reflect the December 2008 revision of the HIMIPref™ Indices

Values are provisional and are finalized monthly
Index Mean
Current
Yield
(at bid)
Median
YTW
Median
Average
Trading
Value
Median
Mod Dur
(YTW)
Issues Day’s Perf. Index Value
Ratchet 3.14 % 3.14 % 21,072 19.40 1 0.7158 % 2,534.0
FixedFloater 4.17 % 3.39 % 29,131 18.66 1 0.0000 % 4,163.9
Floater 2.84 % 2.93 % 45,730 19.92 4 0.1352 % 2,791.8
OpRet 4.01 % -8.29 % 79,620 0.08 1 0.2350 % 2,729.6
SplitShare 4.26 % 3.97 % 46,056 4.03 6 -0.0266 % 3,111.6
Interest-Bearing 0.00 % 0.00 % 0 0.00 0 0.2350 % 2,496.0
Perpetual-Premium 5.52 % -3.71 % 80,166 0.09 17 0.0069 % 2,429.9
Perpetual-Discount 5.23 % 5.16 % 107,143 15.22 20 -0.0851 % 2,581.0
FixedReset 4.38 % 3.59 % 199,468 4.60 77 0.0000 % 2,563.4
Deemed-Retractible 4.98 % 0.21 % 123,742 0.11 43 -0.0360 % 2,552.0
FloatingReset 2.66 % 2.08 % 103,091 3.84 6 0.0065 % 2,529.0
Performance Highlights
Issue Index Change Notes
CIU.PR.C FixedReset -1.27 % YTW SCENARIO
Maturity Type : Limit Maturity
Maturity Date : 2044-07-17
Maturity Price : 21.47
Evaluated at bid price : 21.82
Bid-YTW : 3.41 %
TD.PR.P Deemed-Retractible 1.08 % YTW SCENARIO
Maturity Type : Call
Maturity Date : 2014-08-16
Maturity Price : 25.75
Evaluated at bid price : 26.21
Bid-YTW : -17.99 %
BAM.PR.R FixedReset 1.37 % YTW SCENARIO
Maturity Type : Call
Maturity Date : 2016-06-30
Maturity Price : 25.00
Evaluated at bid price : 25.91
Bid-YTW : 3.61 %
FTS.PR.H FixedReset 2.01 % YTW SCENARIO
Maturity Type : Limit Maturity
Maturity Date : 2044-07-17
Maturity Price : 21.47
Evaluated at bid price : 21.80
Bid-YTW : 3.49 %
Volume Highlights
Issue Index Shares
Traded
Notes
ENB.PF.E FixedReset 839,123 New issue settled today.
YTW SCENARIO
Maturity Type : Limit Maturity
Maturity Date : 2044-07-17
Maturity Price : 23.10
Evaluated at bid price : 24.95
Bid-YTW : 4.16 %
CM.PR.M FixedReset 302,941 Called for redemption July 31.
YTW SCENARIO
Maturity Type : Call
Maturity Date : 2014-08-30
Maturity Price : 25.00
Evaluated at bid price : 24.98
Bid-YTW : 5.30 %
TD.PR.I FixedReset 241,143 Called for redemption July 31.
YTW SCENARIO
Maturity Type : Call
Maturity Date : 2014-08-30
Maturity Price : 25.00
Evaluated at bid price : 24.99
Bid-YTW : 4.63 %
TD.PR.K FixedReset 188,914 Called for redemption July 31.
YTW SCENARIO
Maturity Type : Call
Maturity Date : 2014-08-30
Maturity Price : 25.00
Evaluated at bid price : 24.98
Bid-YTW : 4.97 %
ENB.PF.C FixedReset 159,117 TD crossed 115,600 at 25.09.
YTW SCENARIO
Maturity Type : Limit Maturity
Maturity Date : 2044-07-17
Maturity Price : 23.18
Evaluated at bid price : 25.16
Bid-YTW : 4.13 %
BNS.PR.M Deemed-Retractible 111,653 Nesbitt crossed 109,200 at 25.88.
YTW SCENARIO
Maturity Type : Call
Maturity Date : 2014-08-26
Maturity Price : 25.50
Evaluated at bid price : 25.83
Bid-YTW : -8.69 %
There were 31 other index-included issues trading in excess of 10,000 shares.
Wide Spread Highlights
Issue Index Quote Data and Yield Notes
SLF.PR.H FixedReset Quote: 25.70 – 26.10
Spot Rate : 0.4000
Average : 0.2685

YTW SCENARIO
Maturity Type : Call
Maturity Date : 2016-09-30
Maturity Price : 25.00
Evaluated at bid price : 25.70
Bid-YTW : 2.68 %

BNS.PR.B FloatingReset Quote: 25.41 – 25.60
Spot Rate : 0.1900
Average : 0.1176

YTW SCENARIO
Maturity Type : Call
Maturity Date : 2018-10-25
Maturity Price : 25.00
Evaluated at bid price : 25.41
Bid-YTW : 2.09 %

TD.PF.A FixedReset Quote: 25.35 – 25.53
Spot Rate : 0.1800
Average : 0.1098

YTW SCENARIO
Maturity Type : Limit Maturity
Maturity Date : 2044-07-17
Maturity Price : 23.25
Evaluated at bid price : 25.35
Bid-YTW : 3.64 %

CU.PR.C FixedReset Quote: 26.00 – 26.24
Spot Rate : 0.2400
Average : 0.1847

YTW SCENARIO
Maturity Type : Call
Maturity Date : 2017-06-01
Maturity Price : 25.00
Evaluated at bid price : 26.00
Bid-YTW : 2.74 %

VNR.PR.A FixedReset Quote: 25.64 – 25.91
Spot Rate : 0.2700
Average : 0.2154

YTW SCENARIO
Maturity Type : Call
Maturity Date : 2017-10-15
Maturity Price : 25.00
Evaluated at bid price : 25.64
Bid-YTW : 3.53 %

GWO.PR.N FixedReset Quote: 21.37 – 21.55
Spot Rate : 0.1800
Average : 0.1255

YTW SCENARIO
Maturity Type : Hard Maturity
Maturity Date : 2025-01-31
Maturity Price : 25.00
Evaluated at bid price : 21.37
Bid-YTW : 4.78 %

Market Action

July 16, 2014

The regulators’ crack-down on European banks is having the intended effect:

Ignoring the rules has never been so pricey for European lenders, spurring them to hire more people to ferret out wrongdoing and offer salaries more in line with the bankers they police.

“It’s actually a very hot market right now,” said Mike Roemer, who became head of compliance at London-based Barclays Plc (BARC) in January. Today the role is seen “as an integral part of how companies manage the overall risk of the organization,” he said.

After the U.S. extracted almost $12 billion in fines in settlements with France’s BNP Paribas SA (BNP) and Zurich-based Credit Suisse Group AG (CSGN) since May, European firms say they’re overhauling culture and boosting pay for compliance staff faster than for revenue-earning bankers.

The average annual salary for a compliance employee in London rose 12.9 percent to 80,538 pounds ($138,000) in 2013, according to a survey by London-based recruitment firm Astbury Marsden & Partners Ltd. That compares with a 6.1 percent increase to 90,669 pounds for a revenue-generating banker.

No real surprises in the BoC rate announcement:

Total CPI inflation has moved up to around the 2 per cent target in recent months, sooner than expected. Core inflation has also increased but remains below 2 per cent. Recent higher inflation is attributable to the temporary effects of higher energy prices, exchange rate pass-through and other sector-specific shocks, rather than to any change in domestic economic fundamentals.

Given the downgrade to the global outlook, economic activity in Canada is now projected to be a little weaker than previously forecast.

For the inflation target to be achieved on a sustained basis in 2016, the economy must reach and remain at full capacity. Closing the output gap over the time frame described above is reliant on continued stimulative monetary policy and hinges critically on stronger exports and business investment. Meanwhile, the risks associated with household imbalances, while evolving in a constructive way, are still elevated. Weighing these considerations within the Bank’s risk-management framework, the monetary policy stance remains appropriate and the target for the overnight rate remains at 1 per cent. The Bank is neutral with respect to the timing and direction of the next change to the policy rate, which will depend on how new information influences the outlook and assessment of risks.

Today’s PrefBlog Wingnut of the Day Award goes to the authors of a new book:

In their new book, House of Debt, Atif Mian and Amir Sufi argue that out-of-control housing prices tend to inflict long-lasting pain on a country’s economy, but much of that distress can be avoided. The key? Forcing banks and other lenders to share in the ups-and-downs of the real estate cycle by requiring them to bear part of the cost if a housing boom implodes.

The authors, who teach at Princeton and the University of Chicago, respectively, are mostly concerned with the U.S. housing debacle, but their work deserves attention in any country that suspects it, too, may be suffering from real estate dementia.

The two professors propose an idea with far more teeth. They suggest rewriting mortgage contracts so that a homeowner’s payments and principal shrink if an index of local home prices declines. In effect, their system would shove part of the losses onto the shoulders of the mortgage holder. (Yes, in Canada that would be mostly you, Big Six banks.) In return, the lender would get a 5-per-cent slice of any capital gains on the house when it is sold or refinanced.

Wondderful. So my mortgage rate will go up if the bank figures the market will go down, and vice versa. Classic negative convexity, just for starters. I continue to advocate a gradual withdrawal of the government from mortgage insurance and countercyclical capital requirements when the proportion of mortgage assets to financial system assets deviates significantly from historical norms.

There’s some cheerful news for those in the investment management business:

Net flows into U.S. investment accounts were just 1 percent last year. That could create problems when, inevitably, stocks cool off. And if a bear market comes along, managers of funds may face a true reckoning.

The hardest hit will likely be traditional active money managers. They’re being underpriced by cheap passive strategies that hold stocks and bonds based on indexes in mutual funds or exchange-traded funds. Managers of mutual funds are also getting squeezed by a variety of new, more sophisticated strategies, which BCG calls “solutions.” These are options like target-date funds, income funds and global asset allocation funds that operate pretty much on autopilot.

The result is that an elite group of big asset managers, who provide such alternatives, are winning the lion’s share of new dollars. In the U.S., Vanguard Group, famous for its cheap index funds and ETFs, and BlackRock, the world’s largest money manager, together get two of every five new dollars that get invested in the U.S. BCG says the top 10 asset managers make up almost three-quarters of new investment flows.

Short selling is a dangerous game:

A Wall Street trader said Cynk Technology Corp.’s (CYNK) 36,000 percent stock surge cost him his job, and he blames a short squeeze and regulators who didn’t halt the shares before the company’s value shot past $6 billion.

Tom Laresca, a market-maker at Buckman Buckman & Reid Inc., said he was among traders who thought they spotted a scam as the shares jumped to $2.25 last month from pennies. He sold it short last week around $6 — which means selling stock you don’t own with a plan to buy it cheaper soon, pocketing the difference. Laresca figured the Securities and Exchange Commission would suspend trading, sending the price toward zero. Cynk has said it’s a social-network service with no revenue and one employee.

“The stock looked worthless, if there’s even a company behind it,” Laresca said. “My 10-year-old knew it was a scam. It was a complete joke.”

Instead of falling, the price more than doubled the next day, July 9, starting the squeeze. Market-makers who had sold the shares short got nervous and scrambled to buy them to close their positions, driving the price even higher, Laresca said. The SEC stopped trading two days later, citing concerns about the accuracy of information in the marketplace and “potentially manipulative transactions.” That was too late, Laresca said.

Only 500,000 of those shares were authorized to trade publicly, according to Cynk’s transfer agent, Pacific Stock Transfer. About $12 million of stock changed hands during the past month, according to data compiled by Bloomberg. The low volume meant that market-makers couldn’t find shares to cover their short positions, Laresca said.

Kevin Kelly, chief investment officer at Recon Capital Partners LLC, which manages about $150 million and issues exchange-traded funds, said Laresca took a risk by shorting Cynk even if he thought it was sketchy.

“He should know that markets can stay irrational longer than you can stay solvent,” Kelly said. “He’s a professional.”

The video interview makes one thing clear: he’s got a great accent!

It was a mixed day for the Canadian preferred share market, with PerpetualDiscounts up 14bp, FixedResets off 11bp and DeemedRetractibles gaining 4bp. Volatility was nothing special, but comprised entirely of FixedReset losers. Volume was below average.

HIMIPref™ Preferred Indices
These values reflect the December 2008 revision of the HIMIPref™ Indices

Values are provisional and are finalized monthly
Index Mean
Current
Yield
(at bid)
Median
YTW
Median
Average
Trading
Value
Median
Mod Dur
(YTW)
Issues Day’s Perf. Index Value
Ratchet 3.16 % 3.15 % 21,887 19.34 1 0.0000 % 2,516.0
FixedFloater 4.17 % 3.39 % 29,402 18.66 1 0.0000 % 4,163.9
Floater 2.84 % 2.93 % 45,714 19.92 4 0.1897 % 2,788.1
OpRet 4.01 % -5.66 % 79,751 0.08 1 -0.3124 % 2,723.2
SplitShare 4.26 % 3.97 % 46,694 4.03 6 -0.0067 % 3,112.4
Interest-Bearing 0.00 % 0.00 % 0 0.00 0 -0.3124 % 2,490.1
Perpetual-Premium 5.52 % -3.89 % 78,949 0.09 17 0.0462 % 2,429.7
Perpetual-Discount 5.23 % 5.07 % 109,540 15.21 20 0.1364 % 2,583.2
FixedReset 4.38 % 3.59 % 197,727 4.75 76 -0.1062 % 2,563.4
Deemed-Retractible 4.97 % 0.12 % 124,614 0.09 43 0.0407 % 2,553.0
FloatingReset 2.66 % -0.95 % 96,187 0.09 6 0.0917 % 2,528.9
Performance Highlights
Issue Index Change Notes
SLF.PR.I FixedReset -1.32 % YTW SCENARIO
Maturity Type : Call
Maturity Date : 2016-12-31
Maturity Price : 25.00
Evaluated at bid price : 26.20
Bid-YTW : 2.32 %
MFC.PR.F FixedReset -1.19 % YTW SCENARIO
Maturity Type : Hard Maturity
Maturity Date : 2025-01-31
Maturity Price : 25.00
Evaluated at bid price : 23.29
Bid-YTW : 4.04 %
BAM.PR.X FixedReset -1.12 % YTW SCENARIO
Maturity Type : Limit Maturity
Maturity Date : 2044-07-16
Maturity Price : 21.76
Evaluated at bid price : 22.01
Bid-YTW : 4.01 %
Volume Highlights
Issue Index Shares
Traded
Notes
CM.PR.M FixedReset 100,633 Called for redemption July 31.
YTW SCENARIO
Maturity Type : Call
Maturity Date : 2014-08-30
Maturity Price : 25.00
Evaluated at bid price : 24.98
Bid-YTW : 5.18 %
ENB.PR.F FixedReset 65,318 RBC crossed 55,000 at 24.70.
YTW SCENARIO
Maturity Type : Limit Maturity
Maturity Date : 2044-07-16
Maturity Price : 23.13
Evaluated at bid price : 24.63
Bid-YTW : 4.04 %
BMO.PR.S FixedReset 61,067 TD crossed 35,000 at 25.72.
YTW SCENARIO
Maturity Type : Call
Maturity Date : 2019-05-25
Maturity Price : 25.00
Evaluated at bid price : 25.72
Bid-YTW : 3.57 %
ENB.PR.Y FixedReset 55,882 Desjardins crossed blocks of 17,500 and 32,500, both at 24.27.
YTW SCENARIO
Maturity Type : Limit Maturity
Maturity Date : 2044-07-16
Maturity Price : 22.89
Evaluated at bid price : 24.28
Bid-YTW : 4.00 %
GWO.PR.S Deemed-Retractible 48,590 Scotia crossed 40,000 at 25.65.
YTW SCENARIO
Maturity Type : Hard Maturity
Maturity Date : 2025-01-31
Maturity Price : 25.00
Evaluated at bid price : 25.56
Bid-YTW : 5.10 %
BNA.PR.F SplitShare 40,027 Recent new issue.
YTW SCENARIO
Maturity Type : Hard Maturity
Maturity Date : 2021-10-08
Maturity Price : 25.00
Evaluated at bid price : 24.20
Bid-YTW : 5.07 %
There were 26 other index-included issues trading in excess of 10,000 shares.
Wide Spread Highlights
Issue Index Quote Data and Yield Notes
BAM.PR.R FixedReset Quote: 25.56 – 25.78
Spot Rate : 0.2200
Average : 0.1418

YTW SCENARIO
Maturity Type : Limit Maturity
Maturity Date : 2044-07-16
Maturity Price : 23.79
Evaluated at bid price : 25.56
Bid-YTW : 3.79 %

RY.PR.L FixedReset Quote: 26.51 – 26.75
Spot Rate : 0.2400
Average : 0.1842

YTW SCENARIO
Maturity Type : Call
Maturity Date : 2019-02-24
Maturity Price : 25.00
Evaluated at bid price : 26.51
Bid-YTW : 3.00 %

IFC.PR.A FixedReset Quote: 24.20 – 24.42
Spot Rate : 0.2200
Average : 0.1670

YTW SCENARIO
Maturity Type : Hard Maturity
Maturity Date : 2025-01-31
Maturity Price : 25.00
Evaluated at bid price : 24.20
Bid-YTW : 4.03 %

SLF.PR.I FixedReset Quote: 26.20 – 26.45
Spot Rate : 0.2500
Average : 0.2000

YTW SCENARIO
Maturity Type : Call
Maturity Date : 2016-12-31
Maturity Price : 25.00
Evaluated at bid price : 26.20
Bid-YTW : 2.32 %

RY.PR.H FixedReset Quote: 25.35 – 25.55
Spot Rate : 0.2000
Average : 0.1510

YTW SCENARIO
Maturity Type : Limit Maturity
Maturity Date : 2044-07-16
Maturity Price : 23.27
Evaluated at bid price : 25.35
Bid-YTW : 3.65 %

GWO.PR.I Deemed-Retractible Quote: 22.81 – 23.00
Spot Rate : 0.1900
Average : 0.1430

YTW SCENARIO
Maturity Type : Hard Maturity
Maturity Date : 2025-01-31
Maturity Price : 25.00
Evaluated at bid price : 22.81
Bid-YTW : 5.67 %

Market Action

July 15, 2014

I was sent a link to an article from 2007 by Keith Ambachsheer and Rob Bauer titled Losing ground: Do Canadian mutual funds produce fair value for their customers?:

The study specifically compares the net excess returns produced by a large sample of Canadian mutual funds with domestic equity mandates against the net excess returns produced by a large sample of the domestic equity components of Canadian pension funds. An important study finding is that, over the nine-year period from 1996 to 2004, the Canadian equity components of Canadian pension funds outperformed their Canadian equity market benchmark by an average +1.2% per annum, net of expenses. Over the same nine-year period, Canadian equity mutual funds with domestic mandates underperformed their Canadian equity market benchmark by an average -2.6% per annum, net of management fees, but before any applicable sales charges. Any such sales charges would reduce mutual fund net returns even further.

Very sweet, but nowhere does the article attempt to attribute reported outperformance of Canadian pension funds, which I suggest was due to enormous post-Tech-Wreck outperformance overcompensating for pre-Tech-Wreck underperformance. In addition, it does not attempt to address the outperformance itself, which any first-year B-School student will be pleased to tell you cannot be persistent.

The authors then ask:

Why would Canadian mutual fund investors subject themselves to an average wealth-loss of 3.8% per annum relative to implementing the same basic investment policy through Canadian pension funds? Or equivalently, why would Canadian mutual fund investors pay an average 2.75%(or more including sales charges)for an investment service that is available to Canadian pension fund participants for an average 0.25%, and which produced inferior investment results even before the far greater expenses?

… but of their four hypotheses, only one seems plausible:

Mutual funds are sold, not bought: the market for investment management services is highly asymmetric, with the buyers of these services knowing far less about what they are buying than the sellers know about what they are selling. Information economics predicts that in such a market buyers will pay too much for too little. Research results from the field of behavioural finance support this conclusion. This research shows people to be generally unsophisticated, inconsistent, hesitant, and even irrational regarding financial matters, which creates the opportunity for the for-profit financial services industry to proactively step in and sell their products and services at too-high prices.8 The veracity of his third explanation is supported by the findings of a recent survey of 1865 Canadian mutual fund investors. When asked why they had bought mutual funds, 85% said they were persuaded by “someone who provided me with advice and guidance.”9 In our view, it is the combined effects of informational asymmetry and behavioural dysfunction on the part of the customers, and opportunistic acuity on the part of the suppliers, that best explains the findings summarized in Table 1. Mahoney(2004)reaches similar conclusions in a paper titled “Manager-Investor Conflicts in Mutual Funds.”

This emphasis on prices is reasonable, but there is no attempt to reconcile the fees charged with the performance gap. In addition, the authors conveniently ignore the investment environment of the first half of their period: tech sold! Dividends were old-fashioned; managers had a choice between throwing a good portion of their mutual fund assets into tech or, alternatively, just stay home and catch up on sleep. Without tech on offer, nobody would come to the office and the ‘phones wouldn’t ring.

All this is meant to tout the idea of Government Investment Management:

We favour a middle way: the “paternalistic libertarian” approach currently in the process of being adopted in the UK. The basic idea is to create a number of arm’s-length, expert, pension delivery organizations, and then to automatically enroll the entire non-covered part of the workforce into one of them. People can elect to opt out if they do not wish to participate.

A key assumption in these calculations is that the pension delivery organizations operate in the sole best interests of plan participants, with expense ratios of 0.3%.

I wonder if Mr. Ambachsheer is involved with the proposed Ontario Pension Plan? It sounds rather similar …

The battle to make life easier for incompetent bond investors is heating up:

The Canadian Securities Administrators, a coalition of the country’s provincial and territorial securities regulators, announced last month it’s starting a review of transparency in the $390-billion corporate bond market. The CSA questioned whether the private sector-led transparency model currently in place is working, and if more active regulation is needed.

The move comes as bond trading falls under closer scrutiny worldwide with the top regulator in the U.S. calling for more public information on private trading, and the European Union seeking to build a system to publicly disclose prices in real time.

Unlike stocks, bonds aren’t traded on public exchanges but as private transactions with securities dealers acting as middlemen, giving the brokerages — many of whom are owned by banks — an informational advantage.
It’s historically been more profitable for firms to trade bonds than stocks because the debt markets are less transparent, making it easier for brokers to take a bigger fee for each exchange.

“We have a sort of oligopolistic banking system where the banks kind of set their own rules, and there’s been a lack of transparency in the bond market forever,” said Ed Waitzer, chairman of the Ontario Securities Commission from 1993 to 1997 and a senior partner at Toronto-based law firm Stikeman Elliot LLP. “It sounds like the commission is feeling a little bit of heat again because the rest of the world is kind of shining a light on dark markets.”

Yellen is still dovish on rates:

Federal Reserve Chair Janet Yellen told lawmakers the central bank must press on with record monetary stimulus to combat persistent job-market weakness.

“There are mixed signals concerning the economy,” Yellen said in response to questions during testimony to the Senate Banking Committee today. “We need to be careful to make sure that the economy is on a solid trajectory before we consider raising interest rates.”

While her “overall view is more positive,” Yellen said low wages are one sign of “significant slack” in labor markets, even after the jobless rate fell to an almost six-year low.

In prepared testimony, Yellen repeated that interest rates are likely to stay low for a “considerable period” after the Fed ends its asset-purchase program, which she said could happen following the October meeting.

“A high degree of monetary policy accommodation remains appropriate,” Yellen said in her semi-annual testimony. “Although the economy continues to improve, the recovery is not yet complete.”

She also commented on irrational exuberance:

Ms. Yellen delivered her observation during off-script Congressional testimony on Tuesday. Well, sort of: She was actually singling out social media and biotech stocks – along with lower-rated corporate debt – as pockets of the market that look frothy and are vulnerable to setbacks, particularly when the Fed starts raising its key interest rate.

The fact that a Fed chair would discuss stock valuations of any kind is highly unusual and should push investors into evaluating market conditions after a 190 per cent rally by the S&P 500 over the past five-and-a-half years.

Dubai’s making an effort to attract the hated hedge funds:

When Ahmad Zuaiter started a frontier-markets hedge fund, the former Soros Fund Management LLC money manager chose Dubai over New York and London.

Zuaiter’s Jadara Capital Partners LP and VY Capital Management Co. Ltd. opened in the emirate in the past year, bringing to three the number of hedge-fund firms in the Dubai International Financial Centre, according to Dechert LLP, a law firm that helped establish both companies in the sheikhdom.

“If you want to run a boutique model, the best way is to be located in a centrally positioned hub like Dubai and use it as a nexus to travel extensively and frequently to your target markets,” Zuaiter, 46, said in an interview in his office, close to celebrity chef Marco Pierre White’s Wheeler’s of St James’s restaurant.


For Dubai to rival London as a finance and hedge-fund capital, it must overcome concerns about political instability in the region and 50 degree Celsius (122 degrees Fahrenheit) temperatures that drive residents to seek refuge in Geneva and other European cities during the summer. Still, zero tax, office rents one-third the price of London’s West End and an airport that connects with 90 percent of frontier markets make it attractive to startups, Zuaiter said.

It was a good day for the Canadian preferred share market, with PerpetualDiscounts winning 19bp, FixedResets up 13bp and DeemedRetractibles gaining 8bp. Volatility was reasonable, highlighted by FixedReset winners. Volume was low.

HIMIPref™ Preferred Indices
These values reflect the December 2008 revision of the HIMIPref™ Indices

Values are provisional and are finalized monthly
Index Mean
Current
Yield
(at bid)
Median
YTW
Median
Average
Trading
Value
Median
Mod Dur
(YTW)
Issues Day’s Perf. Index Value
Ratchet 3.16 % 3.15 % 21,951 19.34 1 0.0000 % 2,516.0
FixedFloater 4.17 % 3.39 % 29,778 18.66 1 -0.2188 % 4,163.9
Floater 2.84 % 2.94 % 46,108 19.90 4 0.4627 % 2,782.8
OpRet 4.00 % -9.45 % 80,441 0.08 1 0.4708 % 2,731.8
SplitShare 4.26 % 3.98 % 48,616 4.04 6 -0.1794 % 3,112.6
Interest-Bearing 0.00 % 0.00 % 0 0.00 0 0.4708 % 2,497.9
Perpetual-Premium 5.52 % -3.72 % 79,129 0.09 17 -0.0208 % 2,428.6
Perpetual-Discount 5.24 % 5.08 % 107,470 15.23 20 0.1900 % 2,579.7
FixedReset 4.38 % 3.56 % 196,859 4.61 76 0.1275 % 2,566.2
Deemed-Retractible 4.98 % 1.49 % 126,241 0.30 43 0.0787 % 2,551.9
FloatingReset 2.66 % 1.92 % 107,335 0.16 6 0.3614 % 2,526.5
Performance Highlights
Issue Index Change Notes
CIU.PR.C FixedReset -2.89 % YTW SCENARIO
Maturity Type : Limit Maturity
Maturity Date : 2044-07-15
Maturity Price : 21.71
Evaluated at bid price : 22.17
Bid-YTW : 3.35 %
BNA.PR.F SplitShare -1.15 % YTW SCENARIO
Maturity Type : Hard Maturity
Maturity Date : 2021-10-08
Maturity Price : 25.00
Evaluated at bid price : 24.14
Bid-YTW : 5.11 %
BNS.PR.R FixedReset 1.21 % YTW SCENARIO
Maturity Type : Call
Maturity Date : 2019-01-26
Maturity Price : 25.00
Evaluated at bid price : 25.93
Bid-YTW : 2.92 %
SLF.PR.I FixedReset 1.34 % YTW SCENARIO
Maturity Type : Call
Maturity Date : 2016-12-31
Maturity Price : 25.00
Evaluated at bid price : 26.55
Bid-YTW : 1.75 %
BMO.PR.Q FixedReset 1.70 % YTW SCENARIO
Maturity Type : Hard Maturity
Maturity Date : 2022-01-31
Maturity Price : 25.00
Evaluated at bid price : 25.07
Bid-YTW : 3.08 %
Volume Highlights
Issue Index Shares
Traded
Notes
BAM.PF.F FixedReset 105,916 RBC crossed 29,100 at 25.52. TD crossed 45,000 at 25.55; Scotia sold 19,500 to Nesbitt at 25.55.
YTW SCENARIO
Maturity Type : Call
Maturity Date : 2019-09-30
Maturity Price : 25.00
Evaluated at bid price : 25.55
Bid-YTW : 4.16 %
BMO.PR.S FixedReset 92,735 Nesbitt crossed 50,000 at 25.72; TD crossed 25,000 at the same price.
YTW SCENARIO
Maturity Type : Call
Maturity Date : 2019-05-25
Maturity Price : 25.00
Evaluated at bid price : 25.70
Bid-YTW : 3.59 %
TD.PF.A FixedReset 81,916 Nesbitt crossed 30,000 at 25.52; Desjardins crossed 20,000 at 25.55.
YTW SCENARIO
Maturity Type : Call
Maturity Date : 2019-10-31
Maturity Price : 25.00
Evaluated at bid price : 25.51
Bid-YTW : 3.58 %
BNA.PR.F SplitShare 63,860 Recent new issue.
YTW SCENARIO
Maturity Type : Hard Maturity
Maturity Date : 2021-10-08
Maturity Price : 25.00
Evaluated at bid price : 24.14
Bid-YTW : 5.11 %
BNS.PR.K Deemed-Retractible 47,640 Called for redemption July 29.
YTW SCENARIO
Maturity Type : Call
Maturity Date : 2014-08-14
Maturity Price : 25.00
Evaluated at bid price : 24.98
Bid-YTW : 3.24 %
CM.PR.O FixedReset 36,835 TD crossed 10,300 at 25.55.
YTW SCENARIO
Maturity Type : Call
Maturity Date : 2019-07-31
Maturity Price : 25.00
Evaluated at bid price : 25.51
Bid-YTW : 3.56 %
There were 20 other index-included issues trading in excess of 10,000 shares.
Wide Spread Highlights
Issue Index Quote Data and Yield Notes
CIU.PR.C FixedReset Quote: 22.17 – 22.83
Spot Rate : 0.6600
Average : 0.4463

YTW SCENARIO
Maturity Type : Limit Maturity
Maturity Date : 2044-07-15
Maturity Price : 21.71
Evaluated at bid price : 22.17
Bid-YTW : 3.35 %

BAM.PR.E Ratchet Quote: 23.75 – 24.14
Spot Rate : 0.3900
Average : 0.2401

YTW SCENARIO
Maturity Type : Limit Maturity
Maturity Date : 2044-07-15
Maturity Price : 23.42
Evaluated at bid price : 23.75
Bid-YTW : 3.15 %

FTS.PR.H FixedReset Quote: 21.37 – 21.72
Spot Rate : 0.3500
Average : 0.2617

YTW SCENARIO
Maturity Type : Limit Maturity
Maturity Date : 2044-07-15
Maturity Price : 21.37
Evaluated at bid price : 21.37
Bid-YTW : 3.59 %

BAM.PF.E FixedReset Quote: 24.83 – 25.07
Spot Rate : 0.2400
Average : 0.1645

YTW SCENARIO
Maturity Type : Limit Maturity
Maturity Date : 2044-07-15
Maturity Price : 23.06
Evaluated at bid price : 24.83
Bid-YTW : 4.11 %

IGM.PR.B Perpetual-Premium Quote: 25.90 – 26.19
Spot Rate : 0.2900
Average : 0.2159

YTW SCENARIO
Maturity Type : Call
Maturity Date : 2018-12-31
Maturity Price : 25.00
Evaluated at bid price : 25.90
Bid-YTW : 4.96 %

BMO.PR.K Deemed-Retractible Quote: 26.07 – 26.24
Spot Rate : 0.1700
Average : 0.1057

YTW SCENARIO
Maturity Type : Call
Maturity Date : 2014-08-14
Maturity Price : 25.75
Evaluated at bid price : 26.07
Bid-YTW : -1.35 %

Market Action

July 14, 2014

Fitch is urging government micromanagement of housing:

Canadian home prices remain overvalued relative to historical macroeconomic fundamental drivers, Fitch Ratings says. Despite government efforts to moderate growth, home prices rose 7.1% in May (on a year-over-year basis) according to the Canadian Real Estate Association. In addition, both property sales and building permits for residential construction have picked up in recent months. Home prices also continue to be supported by historically low interest rates and a lack of supply in the major metropolitan areas; these factors have propped up affordability and drive demand. According to Fitch’s sustainable home price model, which measures home prices relative to long-term fundamentals, Canadian home prices remain approximately 20% overvalued in real terms.
We believe high household debt relative to disposable income has made the market more susceptible to market stresses like unemployment or interest rate increases. The ratio reached a high of 164.1% in third-quarter 2013 before declining slightly in the following two quarters. Fitch projects unemployment will likely remain in its current 7% range. But low interest rates are unlikely to fall further. Rising interest rates could pressure the market more than others given high borrower leverage and the short-term structure of Canadian mortgages.

Fitch believes the Canadian government has taken several proactive steps in recent years to mitigate some of the risks to the housing market. The underwriting guidelines for loans insured by the Canadian Mortgage and Housing Corporation (CMHC) have been tightened. CMHC has also pulled back on the amount of low-ratio portfolio insurance offered to lenders and limited securitization of insured mortgages to CMHC-administered programs. Furthermore, The Office of the Superintendent of Financial Institutions has issued a guideline for prudent bank underwriting that must be adhered to for bank originations as well as those purchased from nonbank lenders. However, the long-term impacts remain unclear, and policy makers may be required to take additional steps over the short term to engineer a soft landing.

Sadly, there is nothing in today’s Ontario budget about buying us all new houses. They missed that one:

Most of the budget, however, lays out long-term plans for new spending.

It provides for $29-billion in new funds for transit, roads and bridges over the next decade, plus tens of billions more for other capital costs, including schools. The budget puts more than a billion dollars into various social programs, with raises for personal support workers and more funds for programs for people with developmental disabilities.

A new $2.5-billion fund for businesses is meant to help lure corporations to the province and encourage existing operations to expand.

The plan also allocates a billion for a new road or rail link to the Ring of Fire, a Northern Ontario mineral deposit that the government estimates will yield $60-billion worth of economic activity.

The document further introduces the Ontario Retirement Pension Plan, a pension system for people who do not already have one through their employer, that aims to double the benefits of the Canada Pension Plan for retirees.

There have been an interesting couple of articles lately on US employment trends. The first approves of extreme pickiness when hiring:

Since the recession, many employers halted widely distributed cost-of-living raises. Instead, they’re giving big bonuses and salary boosts to a select few. The average pay raise might be 2 percent, but the extra cash is shared among a small group of employees who have leverage, says Thomas Gimbel, chief executive officer of Chicago-based staffing company LaSalle Network. For them, he says, “Things are better than they’ve ever been.”

These wily pay strategies may also explain why there are so many open jobs. According to data released July 8, there were 4.6 million job openings in the U.S. in May, up from 3.9 million a year before. For key positions, companies are letting job openings stay open until they find exactly the right person, Gimbel says. In the meantime, existing employees must work harder to fill the gap. Then, for the perfect job candidate, they’ll pay up, he says. For example, a job listed for a $125,000 salary might be vacant for a year but then filled by someone who demands — and receives — $140,000.

The second one blames it on algorithms (beloved of Human Resources departments):

Expanding use of technology that uses ultra-specific criteria to screen and winnow candidates may be perpetuating one of the most unusual features of the slow rebound in the U.S. labor market: Despite a steady increase in openings since the recession ended in 2009, these positions are being matched with job seekers less efficiently than in the past. For each 100,000 new openings, for example, companies have hired about 48,000 people, compared with about 54,000 following the 2001 recession.

Software provided by Taleo, a unit of Oracle Corp. (ORCL), allows recruiters to conduct “precision matching” through a “profile-based recruiting system” that uses “advanced search and artificial intelligence to find and short list top talent,” according to a brochure on Oracle’s website.

For workers and job-seekers with exactly the right skills industries need today, the software programs can be a boon, filling their e-mail with notes from recruiters, talent scouts said. There’s also a benefit for companies in lower talent-acquisition and training costs.

There are also disadvantages for other job prospects: A candidate with some, but not all, of the required attributes may be eliminated or moved down the list. This may be one reason why people out of work for 27 weeks or more still represent about a third of the total unemployed, compared with an average of 19 percent between 2004 and 2007. The share is down from about 37 percent in June 2013.

Well, the proof of the pudding is in the eating and I would be loathe to pontificate about the evils of HR algorithms. But I will bet a nickel that over the long run, it is more costly for a company to be too lean than it is for it to be slightly over-staffed, with guys who are familiar with InventoryMaster 8.0, but – critically – unfamiliar with InventoryMaster 9.1.

Housing pundit Will Dunning, who I featured in the post How to Dissect a Housing Bubble, is in the news again, criticizing government micro-management of housing:

“If and when there is a correction in the condo market, the severity will have been aggravated by the actions of the federal government, which elected to depress demand at a time when demand was already beginning to weaken organically and a wave of supply has been developing,” Mr. Dunning writes in a new research note.

He sketched out a scenario in which Toronto’s condo prices would fall by about 10 per cent, as a result of rising supply and falling demand.

“I believe that the federal mortgage insurance policy changes of the past few years will continue to weigh on demand, for both owner-occupants and investors,” Mr. Dunning writes.

His 10-per-cent-price-correction scenario also assumes that job creation does not bounce back to a healthier rate in Canada’s most populous city, and that interest rates remain constant.

“The timing of this process is highly uncertain – it probably won’t start for at least a half-year, and if there are further delays in (condo construction) completions, it could be a long way off,” he writes.

But micro-management is all the rage:

Banks shouldn’t count on a fresh round of European Central Bank cash to trade sovereign debt and reap big profits, Mario Draghi said.

“The convenience to use the ECB cheap money to buy government bonds is much less” than in a previous funding round which started in 2011, the ECB president said in testimony to the European Parliament in Strasbourg, France yesterday. “The general situation is such that these carry trades are going to be much less profitable.”

As spreads on government debt from Spain to Italy over similar German securities have fallen to record lows, a carry trade that was lucrative two years ago may now yield less, Draghi said. In a liquidity drive that pins cash to banks’ performance in extending loans to the economy, the Frankfurt-based ECB could extend as much as 1 trillion euros ($1.36 trillion) in its so-called TLTRO program starting in September.

A condition of that program is that banks have to meet a benchmark on lending to businesses and households, excluding mortgages, or else hand back the money in 2016.

“If banks don’t lend to the non-financial private sector, they’ll have to repay,” Draghi said.

It was a good day for the Canadian preferred share market, with PerpetualDiscounts winning 13bp, FixedResets up 9bp and DeemedRetractibles gaining 8bp. Volatility looks pretty good at first – until you realize it’s half Floaters, which always bounce around a lot. Still, the Performance Highlights table is comprised exclusively of winners! Volume was low.

HIMIPref™ Preferred Indices
These values reflect the December 2008 revision of the HIMIPref™ Indices

Values are provisional and are finalized monthly
Index Mean
Current
Yield
(at bid)
Median
YTW
Median
Average
Trading
Value
Median
Mod Dur
(YTW)
Issues Day’s Perf. Index Value
Ratchet 3.16 % 3.15 % 21,896 19.34 1 -0.6276 % 2,516.0
FixedFloater 4.16 % 3.38 % 28,978 18.68 1 0.3513 % 4,173.0
Floater 2.86 % 2.96 % 46,632 19.85 4 1.1842 % 2,770.0
OpRet 4.02 % -4.06 % 83,161 0.08 1 -0.1176 % 2,719.0
SplitShare 4.25 % 4.01 % 50,620 4.04 6 -0.0422 % 3,118.2
Interest-Bearing 0.00 % 0.00 % 0 0.00 0 -0.1176 % 2,486.2
Perpetual-Premium 5.52 % -2.46 % 81,951 0.09 17 0.0786 % 2,429.1
Perpetual-Discount 5.25 % 5.10 % 107,435 15.23 20 0.1304 % 2,574.8
FixedReset 4.39 % 3.58 % 196,522 4.76 76 0.0942 % 2,562.9
Deemed-Retractible 4.98 % 1.48 % 126,906 0.12 43 0.0824 % 2,549.9
FloatingReset 2.67 % 2.12 % 108,859 3.88 6 0.0526 % 2,517.4
Performance Highlights
Issue Index Change Notes
BAM.PR.C Floater 1.02 % YTW SCENARIO
Maturity Type : Limit Maturity
Maturity Date : 2044-07-14
Maturity Price : 17.83
Evaluated at bid price : 17.83
Bid-YTW : 2.96 %
SLF.PR.H FixedReset 1.03 % YTW SCENARIO
Maturity Type : Call
Maturity Date : 2016-09-30
Maturity Price : 25.00
Evaluated at bid price : 25.61
Bid-YTW : 2.84 %
CIU.PR.C FixedReset 1.20 % YTW SCENARIO
Maturity Type : Limit Maturity
Maturity Date : 2044-07-14
Maturity Price : 22.49
Evaluated at bid price : 22.83
Bid-YTW : 3.26 %
BAM.PR.B Floater 1.37 % YTW SCENARIO
Maturity Type : Limit Maturity
Maturity Date : 2044-07-14
Maturity Price : 17.78
Evaluated at bid price : 17.78
Bid-YTW : 2.97 %
CU.PR.C FixedReset 1.51 % YTW SCENARIO
Maturity Type : Call
Maturity Date : 2017-06-01
Maturity Price : 25.00
Evaluated at bid price : 26.26
Bid-YTW : 2.36 %
BAM.PR.K Floater 1.55 % YTW SCENARIO
Maturity Type : Limit Maturity
Maturity Date : 2044-07-14
Maturity Price : 17.70
Evaluated at bid price : 17.70
Bid-YTW : 2.98 %
Volume Highlights
Issue Index Shares
Traded
Notes
BNS.PR.N Deemed-Retractible 150,500 Scotia crossed 150,000 at 26.04.
YTW SCENARIO
Maturity Type : Call
Maturity Date : 2014-08-13
Maturity Price : 25.75
Evaluated at bid price : 26.01
Bid-YTW : -9.78 %
TRP.PR.A FixedReset 139,622 RBC bought two blocks of 10,000 each from anonymous at 23.29. Desjardins crossed blocks of 24,400 and 21,400, both at 23.30. RBC crossed two blocks of 20,000 each, both at 23.30.
YTW SCENARIO
Maturity Type : Limit Maturity
Maturity Date : 2044-07-14
Maturity Price : 22.42
Evaluated at bid price : 23.30
Bid-YTW : 3.69 %
TD.PF.A FixedReset 77,444 Nesbitt crossed 44,600 at 25.51.
YTW SCENARIO
Maturity Type : Call
Maturity Date : 2019-10-31
Maturity Price : 25.00
Evaluated at bid price : 25.52
Bid-YTW : 3.57 %
POW.PR.G Perpetual-Premium 63,961 Scotia crossed blocks of 19,400 and 40,000, both at 25.65.
YTW SCENARIO
Maturity Type : Call
Maturity Date : 2021-04-15
Maturity Price : 25.00
Evaluated at bid price : 25.70
Bid-YTW : 5.13 %
BMO.PR.K Deemed-Retractible 53,462 TD crossed two blocks of 25,000 each, both at 26.08.
YTW SCENARIO
Maturity Type : Call
Maturity Date : 2014-08-13
Maturity Price : 25.75
Evaluated at bid price : 26.06
Bid-YTW : -1.05 %
MFC.PR.H FixedReset 53,051 RBC crossed blocks of 23,600 and 25,000, both at 26.45.
YTW SCENARIO
Maturity Type : Call
Maturity Date : 2017-03-19
Maturity Price : 25.00
Evaluated at bid price : 26.32
Bid-YTW : 2.68 %
There were 23 other index-included issues trading in excess of 10,000 shares.
Wide Spread Highlights
Issue Index Quote Data and Yield Notes
BNS.PR.R FixedReset Quote: 25.62 – 25.94
Spot Rate : 0.3200
Average : 0.2016

YTW SCENARIO
Maturity Type : Call
Maturity Date : 2019-01-26
Maturity Price : 25.00
Evaluated at bid price : 25.62
Bid-YTW : 3.21 %

SLF.PR.G FixedReset Quote: 22.53 – 22.85
Spot Rate : 0.3200
Average : 0.2108

YTW SCENARIO
Maturity Type : Hard Maturity
Maturity Date : 2025-01-31
Maturity Price : 25.00
Evaluated at bid price : 22.53
Bid-YTW : 4.27 %

HSE.PR.A FixedReset Quote: 23.11 – 23.39
Spot Rate : 0.2800
Average : 0.1847

YTW SCENARIO
Maturity Type : Limit Maturity
Maturity Date : 2044-07-14
Maturity Price : 22.73
Evaluated at bid price : 23.11
Bid-YTW : 3.64 %

MFC.PR.L FixedReset Quote: 25.16 – 25.48
Spot Rate : 0.3200
Average : 0.2291

YTW SCENARIO
Maturity Type : Hard Maturity
Maturity Date : 2025-01-31
Maturity Price : 25.00
Evaluated at bid price : 25.16
Bid-YTW : 3.77 %

FTS.PR.G FixedReset Quote: 24.83 – 25.14
Spot Rate : 0.3100
Average : 0.2230

YTW SCENARIO
Maturity Type : Limit Maturity
Maturity Date : 2044-07-14
Maturity Price : 23.17
Evaluated at bid price : 24.83
Bid-YTW : 3.65 %

GWO.PR.S Deemed-Retractible Quote: 25.50 – 25.73
Spot Rate : 0.2300
Average : 0.1470

YTW SCENARIO
Maturity Type : Hard Maturity
Maturity Date : 2025-01-31
Maturity Price : 25.00
Evaluated at bid price : 25.50
Bid-YTW : 5.13 %

Market Action

July 11, 2014

Tammy Schirle of Wilfrid Laurier writes a good piece titled Six questions Ontario must answer before it starts a pension plan (although the headline writer confused ‘exhortations’ with ‘questions’):

  • 1. Be clear about the market failures you are trying to address.
  • 2. Be precise about the policy target.
  • 3. Be clear about any redistribution that will occur.
  • 4. Notice that low-income families won’t benefit from a simple expansion of benefits
  • 5. How are you going to deal with interprovincial migration and interprovincial employment arrangements?
  • 6. Enhancing the CPP remains the Ontario government’s preferred solution.

It was mixed day for the Canadian preferred share market, with PerpetualDiscounts gaining 1bp, FixedResets off 7bp and DeemedRetractibles up 2bp. Volatility was minimal. Volume was extremely low.

And now it’s time to start work on the July PrefLetter!

HIMIPref™ Preferred Indices
These values reflect the December 2008 revision of the HIMIPref™ Indices

Values are provisional and are finalized monthly
Index Mean
Current
Yield
(at bid)
Median
YTW
Median
Average
Trading
Value
Median
Mod Dur
(YTW)
Issues Day’s Perf. Index Value
Ratchet 3.14 % 3.13 % 21,886 19.40 1 0.0000 % 2,531.9
FixedFloater 4.17 % 3.40 % 27,277 18.66 1 0.4694 % 4,158.4
Floater 2.89 % 2.99 % 47,081 19.78 4 -0.8330 % 2,737.5
OpRet 4.02 % -5.85 % 83,269 0.08 1 0.0784 % 2,722.2
SplitShare 4.25 % 3.94 % 52,705 4.05 6 0.1397 % 3,119.5
Interest-Bearing 0.00 % 0.00 % 0 0.00 0 0.0784 % 2,489.1
Perpetual-Premium 5.53 % -4.80 % 84,342 0.09 17 0.0671 % 2,427.2
Perpetual-Discount 5.25 % 5.11 % 109,101 15.23 20 0.0086 % 2,571.5
FixedReset 4.39 % 3.58 % 193,323 4.62 76 -0.0651 % 2,560.5
Deemed-Retractible 4.98 % 1.91 % 129,476 0.12 43 0.0222 % 2,547.8
FloatingReset 2.67 % 2.12 % 107,909 3.89 6 0.0658 % 2,516.1
Performance Highlights
Issue Index Change Notes
BAM.PR.X FixedReset -1.51 % YTW SCENARIO
Maturity Type : Limit Maturity
Maturity Date : 2044-07-11
Maturity Price : 21.84
Evaluated at bid price : 22.11
Bid-YTW : 3.98 %
BAM.PR.K Floater -1.36 % YTW SCENARIO
Maturity Type : Limit Maturity
Maturity Date : 2044-07-11
Maturity Price : 17.43
Evaluated at bid price : 17.43
Bid-YTW : 3.03 %
BAM.PR.C Floater -1.12 % YTW SCENARIO
Maturity Type : Limit Maturity
Maturity Date : 2044-07-11
Maturity Price : 17.65
Evaluated at bid price : 17.65
Bid-YTW : 2.99 %
Volume Highlights
Issue Index Shares
Traded
Notes
BAM.PF.F FixedReset 76,399 Scotia crossed two blocks of 30,000 each, both at 25.55.
YTW SCENARIO
Maturity Type : Call
Maturity Date : 2019-09-30
Maturity Price : 25.00
Evaluated at bid price : 25.54
Bid-YTW : 4.16 %
RY.PR.H FixedReset 75,221 RBC bought blocks of 11,400 and 10,400 from TD, both at 25.55. Desjardins crossed 16,000 at the same price; Scotia crossed 21,600 at the same price again.
YTW SCENARIO
Maturity Type : Call
Maturity Date : 2019-08-24
Maturity Price : 25.00
Evaluated at bid price : 25.52
Bid-YTW : 3.56 %
GWO.PR.G Deemed-Retractible 56,124 RBC crossed 50,000 at 25.07.
YTW SCENARIO
Maturity Type : Hard Maturity
Maturity Date : 2025-01-31
Maturity Price : 25.00
Evaluated at bid price : 24.95
Bid-YTW : 5.28 %
BNA.PR.F SplitShare 29,738 Recent new issue.
YTW SCENARIO
Maturity Type : Hard Maturity
Maturity Date : 2021-10-08
Maturity Price : 25.00
Evaluated at bid price : 24.42
Bid-YTW : 4.91 %
CM.PR.O FixedReset 28,267 Recent new issue.
YTW SCENARIO
Maturity Type : Call
Maturity Date : 2019-07-31
Maturity Price : 25.00
Evaluated at bid price : 25.49
Bid-YTW : 3.57 %
CU.PR.G Perpetual-Discount 23,038 Nesbitt crossed 20,000 at 22.50.
YTW SCENARIO
Maturity Type : Limit Maturity
Maturity Date : 2044-07-11
Maturity Price : 22.18
Evaluated at bid price : 22.47
Bid-YTW : 5.05 %
There were 11 other index-included issues trading in excess of 10,000 shares.
Wide Spread Highlights
Issue Index Quote Data and Yield Notes
W.PR.H Perpetual-Premium Quote: 25.09 – 26.09
Spot Rate : 1.0000
Average : 0.6089

YTW SCENARIO
Maturity Type : Call
Maturity Date : 2014-08-10
Maturity Price : 25.00
Evaluated at bid price : 25.09
Bid-YTW : 0.38 %

BAM.PR.X FixedReset Quote: 22.11 – 22.51
Spot Rate : 0.4000
Average : 0.2474

YTW SCENARIO
Maturity Type : Limit Maturity
Maturity Date : 2044-07-11
Maturity Price : 21.84
Evaluated at bid price : 22.11
Bid-YTW : 3.98 %

CU.PR.C FixedReset Quote: 25.87 – 26.25
Spot Rate : 0.3800
Average : 0.2693

YTW SCENARIO
Maturity Type : Call
Maturity Date : 2017-06-01
Maturity Price : 25.00
Evaluated at bid price : 25.87
Bid-YTW : 2.91 %

VNR.PR.A FixedReset Quote: 25.52 – 25.88
Spot Rate : 0.3600
Average : 0.2688

YTW SCENARIO
Maturity Type : Call
Maturity Date : 2017-10-15
Maturity Price : 25.00
Evaluated at bid price : 25.52
Bid-YTW : 3.67 %

MFC.PR.K FixedReset Quote: 25.12 – 25.49
Spot Rate : 0.3700
Average : 0.2796

YTW SCENARIO
Maturity Type : Call
Maturity Date : 2018-09-19
Maturity Price : 25.00
Evaluated at bid price : 25.12
Bid-YTW : 3.75 %

IAG.PR.A Deemed-Retractible Quote: 23.17 – 23.45
Spot Rate : 0.2800
Average : 0.1963

YTW SCENARIO
Maturity Type : Hard Maturity
Maturity Date : 2025-01-31
Maturity Price : 25.00
Evaluated at bid price : 23.17
Bid-YTW : 5.57 %