Category: Market Action

Market Action

November 11, 2008

The Fed appears to be winning the bureaucratic turf-fight over the nascent CDS Clearinghouse industry:

The Federal Reserve is working on a plan that would give it authority to regulate the clearing of trades for the $33 trillion credit-default swap market, according to people with knowledge of the proposal.

The Fed, the U.S. Securities and Exchange Commission, the Treasury Department and the Commodity Futures Trading Commission are discussing a memorandum of understanding that lays out oversight of clearinghouses that would become the central counterparty to credit-default swap trades, said the people who asked not to be named because the discussions are private.

VoxEU has announced a new collection of essays titled “What G20 leaders must do to stabilise our economy and fix the financial system”. The article “Returning to narrow banking” by Paul De Grauwe looks most interesting, but I have not yet been able to read it:

Bubbles and crashes have been part of financial markets for centuries. Allowing banks – which inevitably borrow short and lend long – to get deeply involved in financial markets is a recipe for disaster. The solution is to restrict banks to traditional, narrow banking with traditional oversight and guarantees while requiring firms operating in financial markets to more closely match the average maturities of their assets and liabilities.

The Globe and Mail reported further evidence that Canada’s political leadership has the collective intelligence of a peanut:

The premiers also want Ottawa to delay the age at which seniors must begin taking money out of their Registered Retirement Income Funds. Several premiers expressed concern that, in the current economic climate, forcing Canadians at 71 to begin liquidating their RRIFs would cause significant losses on portions of their earnings that depend on stock holdings.

Um … bozos? Nobody says they have to sell their holdings. They just have to withdraw the holdings from the RRIF, stick them in a regular account and declare the withdrawal as income. Collapsing their RRIFs with the least amount of declared income is a Good Thing.

SunLife’s common got whacked:

Manulife Financial, Canada’s biggest insurance company, slid 3.4 percent to C$25.75. Sun Life Financial Inc., the third- largest, fell 6.7 percent to C$27.24.

Goldman Sachs Group Inc. reduced its rating on the life- insurance industry to “cautious” from “neutral,” saying investment losses may force insurers to raise more capital and threaten credit ratings.

… and their prefs were caught in the downdraft. SunLife’s 3Q08 Financials show they took a $636-million hit on credit-related and $326-million on equity-related issues. SLF does not yet know the effect of OSFI’s MCCSR Rule-Change on capital. They have $69.0-billion in segregated fund assets, compared to $16.6-billion in equity including preferred shares.

A description of the equity risk associated with policyholder obligations is included in Note 9 of the 2007 annual consolidated financial statements. The estimated impact from these obligations on the Company from an immediate 10% increase across all equity markets would be an increase in net income of $159 [-million]; conversely, the impact of an immediate 10% drop across all equity markets would be an estimated decrease in net income of $222 [-million]

Note that these indices are experimental; the absolute and relative daily values are expected to change in the final version. In this version, index values are based at 1,000.0 on 2006-6-30.
The Fixed-Reset index was added effective 2008-9-5 at that day’s closing value of 1,119.4 for the Fixed-Floater index.
Index Mean Current Yield (at bid) Mean YTW Mean Average Trading Value Mean Mod Dur (YTW) Issues Day’s Perf. Index Value
Ratchet N/A N/A N/A N/A 0 N/A N/A
Fixed-Floater 4.93% 4.89% 68,516 15.76 6 +1.5855% 1,062.4
Floater 7.00% 7.12% 51,799 12.33 2 +0.3010% 498.4
Op. Retract 5.27% 5.94% 137,052 3.97 15 -0.3439% 1,003.8
Split-Share 6.30% 10.69% 57,224 3.93 12 +0.0400% 937.8
Interest Bearing 7.98% 14.28% 57,081 3.26 3 -1.1096% 890.0
Perpetual-Premium N/A N/A N/A N/A N/A N/A N/A
Perpetual-Discount 6.85% 6.93% 176,448 12.66 71 -0.7914% 796.0
Fixed-Reset 5.36% 5.09% 962,801 15.18 12 -0.0238% 1,087.7
Major Price Changes
Issue Index Change Notes
SLF.PR.A PerpetualDiscount -5.2976% Now with a pre-tax bid-YTW of 7.61% based on a bid of 15.91 and a limitMaturity. Closing quote 15.91-30, 18×16. Day’s range 15.31-16.80.
SBN.PR.A SplitShare -4.9945% Asset coverage of 1.9+:1 as of October 31 according to Mulvihill. Now with a pre-tax bid-YTW of 8.36% based on a bid of 8.56 and a hardMaturity 2014-12-1 at 10.00. Closing quote of 8.56-04, 13×3. Three trades at 9.00 today.
PWF.PR.F PerpetualDiscount -4.6012% Now with a pre-tax bid-YTW of 7.11% based on a bid of 18.66 and a limitMaturity. Closing Quote 18.66-40, 2×5. Day’s range of 18.50-19.80.
BSD.PR.A InterestBearing -4.0323% Asset coverage of 1.0+:1 as of October 31, according to Brookfield Funds. Now with a pre-tax bid-YTW of 17.02% based on a bid of 5.95 and a hardMaturity 2015-3-31 at 10.00. Closing quote of 5.95-15, 112×1. Day’s range of 5.96-20.
BNA.PR.C SplitShare -3.9725% Asset coverage of just under 2.8:1 as of September 30 according to the company. Coverage now of 2.1-:1 based on BAM.A at 21.73 and 2.4 BAM.A held per preferred. Now with a pre-tax bid-YTW of 13.81% based on a bid of 12.57 and a hardMaturity 2019-1-10 at 25.00. Compare with BNA.PR.A (17.28% to 2010-9-30) and BNA.PR.B (9.38% to 2016-3-25). Closing quote 12.57-62, 4×27. Day’s range 12.62-45.
POW.PR.B PerpetualDiscount -3.9634% Now with a pre-tax bid-YTW of 7.18% based on a bid of 18.90 and a limitMaturity. Closing Quote 18.90-24, 2×7. Day’s range of 18.68-50.
SLF.PR.B PerpetualDiscount -3.8576% Now with a pre-tax bid-YTW of 7.55% based on a bid of 16.20 and a limitMaturity. Closing Quote 16.20-62, 13×4. Day’s range of 16.20-86.
GWO.PR.G PerpetualDiscount -3.5806% Now with a pre-tax bid-YTW of 7.02% based on a bid of 18.85 and a limitMaturity. Closing Quote 18.85-98, 4×4. Day’s range of 18.85-55.
SLF.PR.C PerpetualDiscount -3.3722% Now with a pre-tax bid-YTW of 7.61% based on a bid of 14.90 and a limitMaturity. Closing Quote 14.90-27, 2×5. Day’s range of 14.81-37.
SLF.PR.D PerpetualDiscount -2.9928% Now with a pre-tax bid-YTW of 7.60% based on a bid of 14.91 and a limitMaturity. Closing Quote 14.91-25, 4×10. Day’s range of 15.00-91.
SLF.PR.E PerpetualDiscount -2.7599% Now with a pre-tax bid-YTW of 7.57% based on a bid of 15.15 and a limitMaturity. Closing Quote 15.15-56, 3×10. Day’s range of 15.05-75.
ENB.PR.A PerpetualDiscount -2.5424% Now with a pre-tax bid-YTW of 6.09% based on a bid of 23.00 and a limitMaturity. Closing Quote 23.00-35, 11×4. Day’s range of 22.86-46.
BNS.PR.L PerpetualDiscount -2.5071% Now with a pre-tax bid-YTW of 6.64% based on a bid of 17.11 and a limitMaturity. Closing Quote 17.11-30, 12×19. Day’s range of 17.20-35.
BAM.PR.O OpRet -2.4390% Now with a pre-tax bid-YTW of 10.84% based on a bid of 20.00 and optionCertainty 2013-6-30 at 25.00. Compare with BAM.PR.H (8.69% to 2012-3-30), BAM.PR.I (9.36% to 2013-12-30) and BAM.PR.J (2018-3-30). Closing quote of 20.00-15, 9×2. Day’s range of 20.00-75.
POW.PR.A PerpetualDiscount -2.3798% Now with a pre-tax bid-YTW of 6.92% based on a bid of 20.51 and a limitMaturity. Closing Quote 20.51-99, 1×3. Day’s range of 10.51-90.
RY.PR.A PerpetualDiscount -2.3757% Now with a pre-tax bid-YTW of 6.33% based on a bid of 17.67 and a limitMaturity. Closing Quote 17.67-75, 8×23. Day’s range of 17.69-01.
IAG.PR.A PerpetualDiscount -2.2262% Now with a pre-tax bid-YTW of 7.21% based on a bid of 16.25 and a limitMaturity. Closing Quote 16.25-49, 10×8. Day’s range of 16.25-60.
MFC.PR.B PerpetualDiscount -2.0682% Now with a pre-tax bid-YTW of 6.77% based on a bid of 17.52 and a limitMaturity. Closing Quote 17.52-10, 8×3. Day’s range of 17.70-14.
CIU.PR.A PerpetualDiscount +2.3706% Now with a pre-tax bid-YTW of 7.04% based on a bid of 16.41 and a limitMaturity. Closing Quote 16.41-65, 1×10. Two trades at 16.72.
BCE.PR.R FixFloat +2.8261%  
BCE.PR.A FixFloat +3.7952%  
BCE.PR.I FixFloat +4.4444%  
BNA.PR.B SplitShare +5.0081% See BNA.PR.C, above.
Volume Highlights
Issue Index Volume Notes
IGM.PR.A OpRet 96,050 CIBC crossed 20,000 at 25.15, then another 68,000 at the same price. Now with a pre-tax bid-YTW of 5.86% based on a bid of 25.10 and a softMaturity 2013-6-29 at 25.00.
BMO.PR.I OpRet 80,100 Nesbitt crossed 80,000 at 25.00. Called for Redemption.
TD.PR.O PerpetualDiscount 76,932 Nesbitt crossed 30,000 at 18.30; CIBC crossed 33,100 at the same price. Now with a pre-tax bid-YTW of 6.68% based on a bid of 18.34 and a limitMaturity.
GWO.PR.E PerpetualDiscount 52,281 TD crossed 50,000 at 24.75. Now with a pre-tax bid-YTW of 5.19% based on a bid of 24.60 and a limitMaturity.
TD.PR.M OpRet 51,216 Nesbitt crossed 45,600 at 25.32. Now with a pre-tax bid-YTW of 4.48% based on a bid of 25.31 and a softMaturity 2013-10-30 at 25.00.

There were twenty-seven other index-included $25-pv-equivalent issues trading over 10,000 shares today.

Market Action

November 10, 2008

Today’s big news, such as it was, was the new and improved bail-out of AIG. The Fed announced:

  • Treasury will buy $40-billion more prefs
  • The rate on the Fed Loan (formerly $85-billion, now $60-billion) will be reduced to LIBOR+300 from LIBOR+850 on funds drawn, and the fee for undrawn funds will be reduced to 75bp from 850bp. Term of the facility extended from two years to five
  • Two new external companies will be created:
    • RMBS buyer, funded up to $22.5-billion by the Fed, AIG to take $1-billion first loss
    • CDO buyer/CDS unwinder, funded $30-billion by Fed, $5-billion by AIG, AIG takes first loss.

The last is kind of interesting. It would appear that AIG is unable to unwind its CDSs on CDOs at anywhere near intrinsic value. They want to get out of the CDSs, but want to retain the exposure, so this little company is going to buy the CDOs themselves while AIG buys back the CDSs; retaining exposure while neatening the books. At least, that’s how I interpret the paragraph!

The Treasury release shows how this whole process is degenerating into populist political theatre. There’s not a word about the economic terms of the $40-billion senior preferreds Treasury is buying; only executive compensation, lobbying expenses and corporate governance side-agreements are discussed.

On the unwinding front, expensive progress is being made:

The first rescue plan wasn’t sustainable, Liddy said during a conference call today. AIG’s third-quarter loss equaled $9.05 a share and compared with profit of $3.09 billion, or $1.19, a year earlier, AIG said in a statement. Losses in the past year erased profit from 14 previous quarters dating back to 2004.

The insurer guaranteed about $372 billion of fixed-income investments as of Sept. 30, compared with $441 billion three months earlier. AIG booked more than $7 billion in writedowns during the quarter on the value of the swaps.

Circuit City, parent of the 750-store The Source in Canada has petitioned for Chapter 11 bankruptcy:

“It’s very incongruent for retailers to file bankruptcy before Christmas,” Burt Flickinger, managing director of consultant Strategic Resource Group in New York, said in a Bloomberg Television interview. “You’re gong to see a record number of retailer bankruptcies and closings.”

The chain, with 721 stores in the U.S. and 770 in Canada, has said competition hurt sales, especially at older locations in lower-income neighborhoods. Amazon.com Inc. and other Web-based retailers of computers, televisions and music also have lured customers away.

Fannie Mae recorded appalling results:

Fannie Mae posted a record quarterly loss as new Chief Executive Officer Herbert Allison slashed the value of the mortgage-finance provider’s assets by at least $21.4 billion and said it may need to tap federal funds next year.

Fannie slashed its net worth, or the difference between assets and liabilities, to $9.4 billion on Sept. 30 from $44.1 billion at Dec. 31. The company said today it may fall to negative net worth by the end of next quarter, requiring it to seek government funding. Fannie said today that it hadn’t tapped any federal aid through Nov. 7.

But at least HSBC did OK:

HSBC Holdings Plc, Europe’s biggest bank, said third-quarter profit rose even as it set aside a more- than-estimated $4.3 billion to cover bad loans in the U.S. and forecast “further deterioration.”

The U.S. unit “declined markedly” because of consumer and corporate loan defaults, the London-based company said in a statement today. Pretax profit in the quarter was helped by lending in Asia, $3.4 billion in accounting gains on its debt and the sale of assets in France.

The bank takes in more customer deposits than it lends out, enabling it to avoid the funding shortages that forced Royal Bank of Scotland Group Plc, HBOS Plc and Lloyds TSB Group Plc to sell as much as 37 billion pounds of stock to the U.K. government to increase capital.

And there is a certain amount of … justified? unjustified? I don’t know … bureaucratic muscle-flexing in Sweden:

D. Carnegie & Co. AB, Sweden’s largest publicly traded investment bank, was seized by the country’s national debt office and will be sold off in parts after it took “exceptional risks” with loans.

The debt office assumed control of Carnegie Investment Bank AB and Max Matthiessen Holding AB, the two units that make up Stockholm-based Carnegie, which had been used as collateral for a 5 billion-krona ($640 million) loan made by the government last month. Carnegie will keep operating under new ownership.

Nortel got smacked:

Nortel Networks Corp., North America’s largest maker of phone equipment, posted its biggest net loss in seven years and announced plans to cut 1,300 jobs as customers scale back budgets.

The third-quarter loss was $3.4 billion, or $6.85 a share, Toronto-based Nortel said today. That included a $3.2 billion expense to write down the value of deferred tax assets and its Ethernet and enterprise businesses. Nortel also is firing at least four top executives, including its technology chief.

Note that these indices are experimental; the absolute and relative daily values are expected to change in the final version. In this version, index values are based at 1,000.0 on 2006-6-30.
The Fixed-Reset index was added effective 2008-9-5 at that day’s closing value of 1,119.4 for the Fixed-Floater index.
Index Mean Current Yield (at bid) Mean YTW Mean Average Trading Value Mean Mod Dur (YTW) Issues Day’s Perf. Index Value
Ratchet N/A N/A N/A N/A 0 N/A N/A
Fixed-Floater 5.01% 4.98% 70,071 15.64 6 +2.5896% 1,045.8
Floater 7.02% 7.14% 51,933 12.31 2 +0.2014% 496.9
Op. Retract 5.25% 5.85% 134,182 3.98 15 +0.0707% 1,007.1
Split-Share 6.30% 10.70% 57,574 3.94 12 -0.2941% 937.5
Interest Bearing 7.88% 13.49% 57,687 3.26 3 +0.8322% 900.0
Perpetual-Premium N/A N/A N/A N/A N/A N/A N/A
Perpetual-Discount 6.80% 6.87% 177,548 12.74 71 -0.3067% 802.4
Fixed-Reset 5.35% 5.09% 987,869 15.18 12 +0.3366% 1,088.0
Market Action

November 7, 2008

The Fed’s balance sheet continues to grow, with the latest H.4.1 release showing an increase of about $100-billion in Commercial Paper assets, funded by deposits – mainly from banks. However, LIBOR is now well below the Fed’s yield on paper:

The London interbank offered rate, or Libor, that banks say they charge one another for loans fell 10 basis points to 2.29 percent today, the lowest level since November 2004, the British Bankers’ Association said. The overnight rate held at a record low of 0.33 percent and the TED spread, a gauge of bank cash availability, dropped under 200 basis points for the first time since the day before Lehman Brothers Holdings Inc. collapsed.

The CPFF rate is now 1.54%, but there is a 100bp surcharge on top of that..

Today’s jobs number was icky:

The jobless rate rose to 6.5 percent in October from 6.1 percent the previous month, the Labor Department reported today in Washington. Employers cut 240,000 workers after a loss of 284,000 in September, the biggest two-month slide since 2001.

Econbrowser‘s James Hamilton provides a graph (which doesn’t look so good when re-sized for PrefBlog, so read the original post!):

The next battleground for do-over whining is GMAC SmartNotes:

Chuck Woodall, 66, who lives with his wife in Columbus, Ohio, amassed $200,000 of SmartNotes starting eight years ago, and they now equal about 25 percent of his investments. At the time, the securities were rated investment-grade and they paid more interest than government bonds or certificates of deposit. They also were backed by Detroit-based GM, the biggest U.S. automaker.

Woodall, a former owner of apparel stores and a pet-supply business, holds SmartNotes due in 2018 that he says have lost about 80 percent of their value. He said his Merrill broker told him that in more than 20 years, no client had lost money on bonds.

Sadly, the Bloomberg reporter didn’t ask ‘What the hell are you doing putting 25% of your entire portfolio in a single name?’

GM is in a bad way:

General Motors Corp., seeking federal aid to avoid collapse, said it may not have enough cash to keep operating this year and will fall “significantly short” of the amount needed by the end of June unless the auto market improves or it raises more capital.

GM’s $3 billion of 8.375 percent bonds due in 2033 tumbled about 4 cents to 24.4 cents on the dollar as of 11:46 a.m. in New York, according to Trace, the bond-price reporting system of the Financial Industry Regulatory Authority. The debt yields 34 percent, or about 30 percentage points more than similar- maturity Treasuries, Trace data show.

One-year credit-default swaps were quoted at a mid-price of 51 percentage points upfront, compared with 50 percentage points yesterday, CMA data show. That means it would cost $5.1 million initially in addition to $500,000 over one year to protect $10 million of GM bonds. The contracts reached as high as 52 percentage points upfront on Oct. 16.

I am certain that we are going to see a reprise of the Oshawa shuffle … Why should we subsidize them? Because they’re good jobs. Why are they good jobs? Because they’re subsidized.

A solid day for PerpetualDiscounts, up 20bp on the day to yield 6.85% pre-tax dividend, equivalent to 9.59% pre-tax interest at the standard 1.4x factor. Long corporates now yield about 7.55%, so the spread is 204bp.

Note that these indices are experimental; the absolute and relative daily values are expected to change in the final version. In this version, index values are based at 1,000.0 on 2006-6-30.
The Fixed-Reset index was added effective 2008-9-5 at that day’s closing value of 1,119.4 for the Fixed-Floater index.
Index Mean Current Yield (at bid) Mean YTW Mean Average Trading Value Mean Mod Dur (YTW) Issues Day’s Perf. Index Value
Ratchet N/A N/A N/A N/A 0 N/A N/A
Fixed-Floater 5.13% 5.14% 71,771 15.44 6 +1.3756% 1,019.4
Floater 7.04% 7.15% 52,580 12.30 2 +1.5326% 495.9
Op. Retract 5.25% 5.83% 135,097 3.98 15 +0.6890% 1,006.5
Split-Share 6.28% 10.65% 58,010 3.97 12 +0.5225% 940.2
Interest Bearing 7.95% 13.61% 58,857 3.25 3 +1.9680% 892.6
Perpetual-Premium N/A N/A N/A N/A N/A N/A N/A
Perpetual-Discount 6.77% 6.85% 178,352 12.77 71 +0.2014% 804.8
Fixed-Reset 5.37% 5.14% 1,013,076 15.11 12 +0.3062% 1,084.3
Major Price Changes
Issue Index Change Notes
FFN.PR.A SplitShare -5.1316% Asset coverage of 1.6-:1 as of October 31 according to the company. Now with a pre-tax bid-YTW of 11.97% based on a bid of 7.21 and a hardMaturity 2014-12-1 at 10.00. Closing quote of 7.21-69, 5×5. Day’s range of 7.05-60.
POW.PR.C PerpetualDiscount -3.7209% Now with a pre-tax bid-YTW of 7.10% based on a bid of 20.70 and a limitMaturity. Closing quote 20.70-14, 2×2. Day’s range 20.93-22.03.
PWF.PR.L PerpetualDiscount -2.8947% Now with a pre-tax bid-YTW of 6.98% based on a bid of 18.45 and a limitMaturity. Closing Quote 18.45-84, 5×4. Day’s range of 18.45-00.
SBN.PR.A SplitShare +2.5946% Asset coverage of 1.9+:1 as of October 31 according to Mulvihill. Now with a pre-tax bid-YTW of 7.40% based on a bid of 9.01 and a hardMaturity 2014-12-1 at 10.00. Closing quote of 9.01-50, 3×5. No trades today.
SLF.PR.A PerpetualDiscount -2.0000% Now with a pre-tax bid-YTW of 7.25% based on a bid of 16.66 and a limitMaturity. Closing Quote 16.66-90, 24×24. Day’s range of 16.86-14.
CM.PR.H PerpetualDiscount +2.1199% Now with a pre-tax bid-YTW of 7.20% based on a bid of 16.86 and a limitMaturity. Closing Quote 16.86-94, 4×2. Day’s range of 16.53-95.
TD.PR.N OpRet +2.4580% Now with a pre-tax bid-YTW of 4.63% based on a bid of 25.01 and a softMaturity 2014-1-30 at 25.00. Closing quote of 25.01-26.14, 3×11. No trades today.
BMO.PR.H PerpetualDiscount +2.5428% Now with a pre-tax bid-YTW of 6.73% based on a bid of 19.76 and a limitMaturity. Closing Quote 19.76-95, 3×3. Day’s range of 19.51-98.
BSD.PR.A InterestBearing +2.6891% Asset coverage of 1.0+:1 as of October 31, according to Brookfield Funds. Now with a pre-tax bid-YTW of 16.39% based on a bid of 6.11 and a hardMaturity 2015-3-31 at 10.00. Closing quote of 6.11-21, 4×23. Day’s range of 6.17-21.
FIG.PR.A InterestBearing +3.1637% Asset coverage of 1.3+:1 based on Capital Units NAV of 4.56 on November 6 and 0.71 Capital Units per Preferred. Now with a pre-tax bid-YTW of 12.44% based on a bid of 7.50 and a hardMaturity 2014-12-31 at 10.00. Closing quote of 7.50-73, 29×30. Day’s range of 7.31-51.
BCE.PR.Y FixFloat +3.2184%  
BCE.PR.A FixFloat +3.3992%  
FTN.PR.A SplitShare +3.6269% Asset coverage of 1.9-:1 as of October 31, according to the company. Now with a pre-tax bid-YTW of 9.26% based on a bid of 8.00 and a hardMaturity 2015-12-1 at 10.00. Closing quote of 8.00-13, 39×3. Day’s range of 7.70-15.
MFC.PR.C PerpetualDiscount +3.9759% Now with a pre-tax bid-YTW of 6.64% based on a bid of 17.26 and a limitMaturity. Closing Quote 17.26-40, 3×8. Day’s range of 16.60-40.
BCE.PR.R FixFloat +4.6062%  
BNA.PR.C SplitShare +7.6864% Asset coverage of just under 2.8:1 as of September 30 according to the company. Coverage now of 2.1-:1 based on BAM.A at 21.38 and 2.4 BAM.A held per preferred. Now with a pre-tax bid-YTW of 12.20% based on a bid of 14.01 and a hardMaturity 2019-1-10 at 25.00. Compare with BNA.PR.A (17.46% to 2010-9-30) and BNA.PR.B (10.08% to 2016-3-25). Closing quote 14.01-94, 2×7. Day’s range 13.20-14.49.
Volume Highlights
Issue Index Volume Notes
CM.PR.I PerpetualDiscount 168,254 Nesbitt crossed 150,000 at 16.50. Now with a pre-tax bid-YTW of 7.13% based on a bid of 16.65 and a limitMaturity.
RY.PR.L Fixed-Reset 133,900 TD bought 10,300 from anonymous at 24.93; RBC bought 11,600 from Nesbitt at 24.95; TD bought 11,500 from National at 24.99. New Issue settled Nov. 3
TD.PR.C Fixed-Reset 54,450 New issue settled Nov. 5
BCE.PR.C FixFloat 43,600 TD crossed 19,400 at 22.10; CIBC crossed 20,000 at 22.50.
BMO.PR.M Fixed-Reset 37,240 Nesbitt crossed 25,000 at 23.60.

There were twenty-nine other index-included $25-pv-equivalent issues trading over 10,000 shares today.

Market Action

November 6, 2008

There were massive rate cuts in Europe:

The Bank of England led European central banks in reducing borrowing costs to counter the worst financial crisis in almost a century, cutting its key rate by 1.5 percentage points to the lowest level since 1955.

The U.K. central bank reduced its key rate by the most since 1992, taking it to 3 percent. The European Central Bank lowered its benchmark by 50 basis points to 3.25 percent and Swiss policy makers cut their main lending rate by the same margin to 2 percent after an unscheduled meeting.

The BoE press release is unusually sombre:

Since mid-September, the global banking system has experienced its most serious disruption for almost a century. While the measures taken on bank capital, funding and liquidity in several countries, including our own, have begun to ease the situation, the availability of credit to households and businesses is likely to remain restricted for some time. As a consequence, money and credit conditions have tightened sharply. Equity prices have fallen substantially in many countries.

In the United Kingdom, output fell sharply in the third quarter. Business surveys and reports by the Bank’s regional Agents point to continued severe contraction in the near term. Consumer spending has faltered in the face of a squeeze on household budgets and tighter credit. Residential investment has fallen sharply and the prospects for business investment have weakened. Economic conditions have also deteriorated in the UK’s main export markets.

With the expansion of the Fed’s balance sheet comes an extraordinary level of Treasury issuance:

Over the October – December 2008 quarter, the Treasury expects to borrow $550 billion of marketable debt, assuming an end-of-December cash balance of $300 billion, which includes $260 billion for the Supplementary Financing Program (SFP). Without the SFP, the end-of-December cash balance is expected to be $40 billion. This borrowing estimate is $408 billion higher than announced in July 2008. The increase in borrowing is primarily due to higher outlays related to economic assistance programs, lower receipts, and lower net issuances of State and Local Government Series securities.

Over the January – March 2009 quarter, the Treasury expects to borrow $368 billion of marketable debt, assuming an end-of-March cash balance of $75 billion.

This issuance is causing dislocation in the Treasury yield curve:

One trader pointed out some amazing anomalies on the 3 year /4 year portion of the curve. For instance, one can sell the 3 3/8s of November 2012 and buy the new 3 year (November 2011) at even yield. The curve is quite steep so unless one expects dramatic flattening soon that trader is a winner,

Similarly, an investor can sell the 4 1/4s September 2012 and buy a combination of three year notes and 5 year notes and pick up 88 basis points of gross yield. That just does not make sense and anyone owning those bonds should sell them in favor of most anything else.

There are rumours GMAC will become a bank:

Cerberus is weighing a plan to distribute its GMAC stake to investors in its private-equity funds, according to the people, who declined to be identified because the deliberations aren’t public. The tactic, one of several options under discussion, may enable Detroit-based GMAC to become a bank and get funding from the U.S. Treasury and Federal Reserve without subjecting Cerberus to banking regulations.

In a bit of good news Wells Farge raised significant equity:

Wells Fargo & Co., the biggest bank on the U.S. West Coast, raised $11 billion in a stock sale to help fund its purchase of Wachovia Corp., exceeding its estimate for the offering.

The bank sold 407.5 million shares for $27 each, 6.2 percent below today’s closing price of $28.77, according to a company statement. The company may sell an additional 61 million shares if demand warrants. The San Francisco-based lender had planned to raise $10 billion.

The U.S. Treasury bought $25 billion of Wells Fargo’s preferred shares in October as part of its rescue of the banking industry. Wells Fargo is expanding its deposit base to the East Coast and creating the biggest U.S. bank by branches with its purchase of Charlotte, North Carolina-based Wachovia.

Wells Fargo joins other banks in raising capital, including JPMorgan Chase & Co’s $11.5 billion offering in September and $10 billion pulled in by Bank of America Corp. in October.

A day enlivened by news of the new GWO Fixed-Reset 6.00%+307 issue; PerpetualDiscounts gave up some of the gains they made in the first part of the week. Volume remained vigorous.

Note that these indices are experimental; the absolute and relative daily values are expected to change in the final version. In this version, index values are based at 1,000.0 on 2006-6-30.
The Fixed-Reset index was added effective 2008-9-5 at that day’s closing value of 1,119.4 for the Fixed-Floater index.
Index Mean Current Yield (at bid) Mean YTW Mean Average Trading Value Mean Mod Dur (YTW) Issues Day’s Perf. Index Value
Ratchet N/A N/A N/A N/A 0 N/A N/A
Fixed-Floater 5.20% 5.23% 69,022 15.32 6 +2.2961% 1,005.5
Floater 7.14% 7.26% 52,851 12.18 2 -3.2164% 488.4
Op. Retract 5.29% 6.03% 135,941 3.98 15 +0.0596% 999.6
Split-Share 6.31% 10.70% 58,374 3.94 12 -0.8761% 935.3
Interest Bearing 8.10% 14.17% 59,414 3.21 3 -0.5261% 875.3
Perpetual-Premium N/A N/A N/A N/A N/A N/A N/A
Perpetual-Discount 6.79% 6.86% 178,964 12.76 71 -0.9708% 803.2
Fixed-Reset 5.39% 5.16% 1,030,535 15.09 12 -0.4709% 1,081.0
Major Price Changes
Issue Index Change Notes
FTN.PR.A SplitShare -7.7658% Asset coverage of 1.9-:1 as of October 31, according to the company. Now with a pre-tax bid-YTW of 9.91% based on a bid of 7.72 and a hardMaturity 2015-12-1 at 10.00. Closing quote of 7.72-00, 5×6. Day’s range of 7.66-8.22
GWO.PR.I PerpetualDiscount -5.7382% Now with a pre-tax bid-YTW of 7.26% based on a bid of 15.77 and a limitMaturity. Closing quote 15.77-29, 3×4. Day’s range 15.76-71.
BAM.PR.B Floater -5.2684%  
MFC.PR.C PerpetualDiscount -4.4879% Now with a pre-tax bid-YTW of 6.91% based on a bid of 16.60 and a limitMaturity. Closing Quote 16.60-73, 12×3. Day’s range of 16.60-45.
PWF.PR.I PerpetualDiscount -4.3043% Now with a pre-tax bid-YTW of 6.87% based on a bid of 22.01 and a limitMaturity. Closing Quote 22.01-23.50, 8×16. Day’s range of 22.01-23.50.
RY.PR.E PerpetualDiscount -4.0437% Now with a pre-tax bid-YTW of 6.44% based on a bid of 17.56 and a limitMaturity. Closing Quote 17.56-79, 3×4. Day’s range of 17.41-18.64.
BSD.PR.A InterestBearing -4.0323% Asset coverage of 1.0+:1 as of October 31, according to Brookfield Funds. Now with a pre-tax bid-YTW of 16.97% based on a bid of 5.95 and a hardMaturity 2015-3-31 at 10.00. Closing quote of 5.95-99, 87×1. Day’s range of 5.90-15.
PWF.PR.K PerpetualDiscount -3.2520% Now with a pre-tax bid-YTW of 7.00% based on a bid of 17.85 and a limitMaturity. Closing Quote 17.85-00, 5×12. Day’s range of 17.85-45.
ELF.PR.G PerpetualDiscount -3.0243% Now with a pre-tax bid-YTW of 8.17% based on a bid of 14.75 and a limitMaturity. Closing Quote 14.75-94, 8×5. Day’s range of 14.75-50.
RY.PR.G PerpetualDiscount -2.7933% Now with a pre-tax bid-YTW of 6.50% based on a bid of 17.40 and a limitMaturity. Closing Quote 17.40-85, 10×12. Day’s range of 17.25-96.
GWO.PR.H PerpetualDiscount -2.7778% Now with a pre-tax bid-YTW of 7.05% based on a bid of 17.50 and a limitMaturity. Closing Quote 17.50-94, 2×2. Day’s range of 17.50-25.
RY.PR.A PerpetualDiscount -2.6752% Now with a pre-tax bid-YTW of 6.14% based on a bid of 18.19 and a limitMaturity. Closing Quote 18.19-52, 1×4. Day’s range of 18.00-33.
BNA.PR.B SplitShare -2.4582% Asset coverage of just under 2.8:1 as of September 30 according to the company. Coverage now of 2.0-:1 based on BAM.A at 20.80 and 2.4 BAM.A held per preferred. Now with a pre-tax bid-YTW of 10.14% based on a bid of 18.65 and a hardMaturity 2016-3-25 at 25.00. Compare with BNA.PR.A (17.29% to 2010-9-30) and BNA.PR.C (13.28% to 2019-1-10). Closing quote 18.65-96, 16×12. Day’s range 18.26-50.
POW.PR.A PerpetualDiscount -2.4085% Now with a pre-tax bid-YTW of 7.00% based on a bid of 20.26 and a limitMaturity. Closing Quote 20.26-99, 1×2. Day’s range of 20.00-99.
CIU.PR.A PerpetualDiscount -2.2005% Now with a pre-tax bid-YTW of 7.21% based on a bid of 18.50 and a limitMaturity. Closing Quote 16.00-25, 2×15. Day’s range of 16.27-50.
BAM.PR.J OpRet -2.1739% Now with a pre-tax bid-YTW of 10.28% based on a bid of 18.00 and a softMaturity 2018-3-30 at 25.00. Compare with BAM.PR.H (9.24% to 2012-3-30), BAM.PR.I (9.96% to 2013-12-30) and BAM.PR.O (10.48% to 2013-6-30) and the perpetuals at 9.44%. Closing quote of 18.00-30, 2×3. Day’s range of 18.00-50.
BCE.PR.R FixFloat +2.3091%  
SBN.PR.A SplitShare +2.6637% Asset coverage of 1.9+:1 as of October 31 according to Mulvihill. Now with a pre-tax bid-YTW of 6.87% based on a bid of 9.25 and a hardMaturity 2014-12-1 at 10.00. Closing quote of 9.25-50, 7×1. Both trades today at 9.25.
BCE.PR.I FixFloat +2.7353%  
BNA.PR.C SplitShare +4.1633% See BNA.PR.B, above. Closing quote of 13.01-40, 10×7. Day’s range of 12.60-40.
BCE.PR.Z FixFloat +4.2677%  
BCE.PR.G FixFloat +4.3333%  
Volume Highlights
Issue Index Volume Notes
GWO.PR.G PerpetualDiscount 283,039 Nesbitt crossed 250,000 at 19.70, then another 17,000 at the same price. Now with a pre-tax bid-YTW of 6.77% based on a bid of 19.51 and a limitMaturity.
TD.PR.C Fixed-Reset 147,200 New issue settled Nov. 5
TD.PR.N Fixed-Reset 85,800 CIBC crossed 33,800 at 25.00, then another 50,000 at the same price.
CM.PR.A OpRet 70,000 TD crossed 33,000 at 25.35, then another (the same?) 33,000 at the same price. Now with a pre-tax bid-YTW of 4.95% based on a bid of 25.28 and a softMaturity 2011-7-30 at 25.00.
MFC.PR.A OpRet 68,975 CIBC crossed 47,200 at 24.30. Now with a pre-tax bid-YTW of 5.02% based on a bid of 23.81 and a softMaturity 2015-12-18 at 25.00.

There were thirty-three other index-included $25-pv-equivalent issues trading over 10,000 shares today.

Market Action

November 5, 2008

Willem Buiter & Anne Sibert write a review of The collapse of Iceland’s banks: the predictable end of a non-viable business model. As an aside, they note:

In addition, outrageous bullying behaviour by the UK authorities (who invoked the 2001 Anti-Terrorism, Crime and Security Act, passed after the September 11, 2001 terrorist attacks in the USA, to justify the freezing of the UK assets of the of Landsbanki and Kaupthing) probably precipitated the collapse of Kaupthing – the last Icelandic bank still standing at the time. The official excuse of the British government for its thuggish behaviour was that the Icelandic authorities had informed it that they would not honour Iceland’s deposit guarantees for the UK subsidiaries of its banks. Transcripts of the key conversation on the issue between British and Icelandic authorities suggest that, if the story of Pinocchio is anything to go by, a lot of people in HM Treasury today have noses that are rather longer than they used to be.

This is the real danger of counter-terrorism laws … they will be twisted to justify anything the bosses want to justify. And be re-elected in a landslide by frightened sheep. Anyway, back to economics … the authors claim that Iceland’s business model was not viable due to:

the “vulnerable quartet” of (1) a small country with (2) a large banking sector, (3) its own currency and (4) limited fiscal capacity

With this in mind, they warn:

Iceland’s circumstances were extreme, but there are other countries suffering from milder versions of the same fundamental inconsistent – or at least vulnerable – quartet:

Countries that come to mind are:

Switzerland,
Denmark,
Sweden
and even to some extent the UK, although it is significantly larger than the others and has a minor-league legacy reserve currency.

Ireland, Belgium, the Netherland and Luxembourg possess the advantage of having the euro, a global reserve currency, as their national currency. Illiquidity alone should therefore not become a fatal problem for their banking sectors. But with limited fiscal spare capacity, their ability to address serious fundamental banking sector insolvency issues may well be in doubt.

Coincidentally, I’m sure, Dennis P. Quinn & Hans-Joachim Voth argue that benefits of international diversification are declining:

After Bretton Woods, it took half a century to restore the full openness of capital accounts in advanced countries. Many Eurozone countries only revoked the last restriction in the 1990s, in the run-up to the euro’s introduction.

We argue that it is no accident that the age of restrictive capital accounts also saw remarkably low equity market correlations. Cross-border diversification opportunities identified by early papers (Grubel 1968) were indeed “too good to be true.” Once investors can take advantage of low correlations elsewhere, they will rise. Initial investors may benefit since liberalisations tend to be followed by capital gains (Henry 2000). Yet risks will not fall anywhere near as much as initially hoped, as the covariance with other stock markets inevitably increases.

How tight is the bond market? The credit card companies have maxed-out:

Credit card companies were shut out of the market for bonds backed by customer payments in October for the first time in more than 15 years, as investors shunned the debt amid the global credit freeze.

It’s the first month since April 1993 that there have been no sales, according to Wachovia Corp. data. Issuers sold $17.1 billion of the debt in October 2007, the data show.

Top-rated credit card-backed securities maturing in three years traded at a gap, or spread, of 475 basis points over the London interbank offered rate, or Libor, during the week ended Oct. 30, JPMorgan Chase & Co. data show, 25 basis points higher than the previous week. The debt was trading at 50 basis points more than Libor in January.

PerpetualDiscounts eased off today, but volume was strong. There are many very strange yield relationships between issuers in the market; its hard to tell whether the degree of credit stratification is more or less surprising than the degree of credit inversion!

Note that these indices are experimental; the absolute and relative daily values are expected to change in the final version. In this version, index values are based at 1,000.0 on 2006-6-30.
The Fixed-Reset index was added effective 2008-9-5 at that day’s closing value of 1,119.4 for the Fixed-Floater index.
Index Mean Current Yield (at bid) Mean YTW Mean Average Trading Value Mean Mod Dur (YTW) Issues Day’s Perf. Index Value
Ratchet N/A N/A N/A N/A 0 N/A N/A
Fixed-Floater 5.32% 5.37% 69,368 15.13 6 +0.0602% 983.0
Floater 6.91% 7.02% 52,437 12.47 2 +1.7909% 504.7
Op. Retract 5.29% 6.08% 132,612 3.99 15 +0.0618% 999.0
Split-Share 6.25% 10.48% 58,404 3.96 12 -0.1177% 943.6
Interest Bearing 8.06% 14.12% 60,114 3.23 3 -1.4615% 880.0
Perpetual-Premium N/A N/A N/A N/A N/A N/A N/A
Perpetual-Discount 6.72% 6.79% 179,536 12.85 71 -0.2755% 811.1
Fixed-Reset 5.36% 5.13% 1,041,096 15.14 12 +0.2111% 1,086.1
Major Price Changes
Issue Index Change Notes
FIG.PR.A

InterestBearing -4.4000% Asset coverage of 1.4-:1 as of November 4, based on capital unit NAV of 5.50 and 0.71 capital units per preferred. Now with a pre-tax bid-YTW of 13.40% based on a bid of 7.17 and a hardMaturity 2014-12-31 at 10.00. Closing quote of 7.17-25, 5×17. Day’s ragne of 7.29-55.
BCE.PR.G FixFloat -3.4926%  
BNA.PR.C SplitShare -3.1783% Asset coverage of just under 2.8:1 as of September 30 according to the company. Coverage now of 2.0+:1 based on BAM.A at 21.00 and 2.4 BAM.A held per preferred. Now with a pre-tax bid-YTW of 13.88% based on a bid of 12.49 and a hardMaturity 2019-1-10 at 25.00. Compare with BNA.PR.A (17.26% to 2010-9-30) and BNA.PR.B (9.70% to 2016-3-25). Closing quote 12.49-85, 7×7. Day’s range 12.30-13.40.
LBS.PR.A SplitShare -2.7429% Asset coverage of 1.7+:1 as of October 30 according to Brompton Group. Now with a pre-tax bid-YTW of 9.12% based on a bid of 8.51 and a hardMaturity 2013-11-29 at 10.00. Closing quote of 8.51-00, 5×2. No trading.
HSB.PR.D PerpetualDiscount -2.7174% Now with a pre-tax bid-YTW of 7.10% based on a bid of 17.90 and a limitMaturity. Closing quote 17.90-29. Day’s range 17.86-69.
BNS.PR.O PerpetualDiscount -2.5991% Now with a pre-tax bid-YTW of 6.39% based on a bid of 22.11 and a limitMaturity. Closing Quote 22.11-60, 5X1. Day’s range of 22.07-89.
BAM.PR.J OpRet -2.4390% Now with a pre-tax bid-YTW of 9.94% based on a bid of 18.40 and a softMaturity 2018-3-30 at 25.00. Compare with BAM.PR.H (9.63% to 2012-3-30), BAM.PR.I (10.42% to 2013-12-30) and BAM.PR.O (10.53% to 2013-6-30). Closing quote of 18.40-50, 3×2. Day’s range of 18.42-85.
MFC.PR.C PerpetualDiscount -2.1396% Now with a pre-tax bid-YTW of 6.59% based on a bid of 17.38 and a limitMaturity. Closing Quote 17.38-84, 1×1. Day’s range of 17.36-85.
WFS.PR.A SplitShare +2.1492% Asset coverage of 1.4-:1 as of October 31 according to Mulvihill. Now with a pre-tax bid-YTW of 14.60% based on a bid of 8.08 and a hardMaturity 2011-6-30 at 10.00. Closing quote of 8.08-34, 14×15. Day’s range of 8.01-40.
BCE.PR.C FixFloat +3.5697%  
SBN.PR.A SplitShare +4.0416% Asset coverage of 1.9+:1 as of October 31 according to Mulvihill. Now with a pre-tax bid-YTW of 7.40% based on a bid of 9.01 and a hardMaturity 2014-12-1 at 10.00. Closing quote of 9.01-49, 3×10. Day’s range of 9.15-30.
Volume Highlights
Issue Index Volume Notes
TD.PR.C FixedReset 593,115 National Bank crossed 150,000 at 24.87; there were five other blocks totalling 50,900 shares. New issue settled today.
TD.PR.M OpRet 220,712 CIBC crossed three blocks of 25,000 each; Nesbitt crossed blocks totalling 100,000; all at 25.10. Now with a pre-tax bid-YTW of 4.73% based on a bid of 25.01 and a softMaturity 2013-10-30 at 25.00.
RY.PR.L FixedReset 103,925 RBC crossed 12,700 at 24.91. New issue settled Monday.
WFS.PR.A SplitShare 191,800 RBC crossed 155,500 at 8.03, then another 14,400 at 8.40. See above
BMO.PR.I OpRet 75,100 Nesbitt crossed 75,000 at 24.99. Called for redemption.

There were thirty-four other index-included $25-pv-equivalent issues trading over 10,000 shares today.

Market Action

November 4, 2008

Another good day for prefs, with the PerpetualDiscounts again up over a point for the third day in a row. Before anybody gets too excited though … we’ve not yet recovered to October 22 levels and the 6.77% yield is almost 50bp over the September 30 level of 6.29%.

The 6.77% yield is equivalent to 9.48% interest at the standard 1.4x factor, while long corporates are still chugging along in the 7.5% area … so we’re back to a spread of about 200bp. Long corporates are actually down fractionally on the month-to-day and recovery in this market should, logically, now become a major factor in preferred share performance.

On the other hand, the market hasn’t really behaved logically for over a year and a half, so who knows?

Note that these indices are experimental; the absolute and relative daily values are expected to change in the final version. In this version, index values are based at 1,000.0 on 2006-6-30.
The Fixed-Reset index was added effective 2008-9-5 at that day’s closing value of 1,119.4 for the Fixed-Floater index.
Index Mean Current Yield (at bid) Mean YTW Mean Average Trading Value Mean Mod Dur (YTW) Issues Day’s Perf. Index Value
Ratchet N/A N/A N/A N/A 0 N/A N/A
Fixed-Floater 5.32% 5.38% 70,523 15.12 6 +2.4301% 982.4
Floater 6.90% 7.01% 48,965 12.48 2 +1.8248% 505.2
Op. Retract 5.29% 6.10% 131,568 3.99 15 -0.1494% 998.4
Split-Share 6.24% 10.45% 58,457 3.97 12 +1.1492% 944.7
Interest Bearing 7.93% 13.29% 60,778 3.25 3 +2.4349% 893.0
Perpetual-Premium N/A N/A N/A N/A N/A N/A N/A
Perpetual-Discount 6.70% 6.77% 180,124 12.88 71 +1.0227% 813.3
Fixed-Reset 5.35% 5.10% 892,441 15.18 11 +0.5777% 1,083.8
Major Price Changes
Issue Index Change Notes
BAM.PR.B Floater -6.3551%  
POW.PR.B PerpetualDiscount -5.1307% Now with a pre-tax bid-YTW of 6.91% based on a bid of 19.60 and a limitMaturity. Closing quote 19.60-79, 2X3. Day’s range 19.23-20.40.
LFE.PR.A SplitShare -3.8043% Asset coverage of 1.6+:1 as of October 31, according to the company. Now with a pre-tax bid-YTW of 8.74% based on a bid of 8.85 and a hardMaturity 2012-12-1 at 10.00. Closing quote of 8.85-14, 5×5. Day’s range of 9.10-40.
W.PR.H PerpetualDiscount +3.0641% Now with a pre-tax bid-YTW of 7.54% based on a bid of 18.50 and a limitMaturity. Closing Quote 18.50-14, 5×5. Day’s range of 18.25-19.40.
MFC.PR.B PerpetualDiscount +3.1501% Now with a pre-tax bid-YTW of 6.57% based on a bid of 18.01 and a limitMaturity. Closing Quote 18.01-09, 11×1. Day’s range of 17.66-45.
BCE.PR.R FixFloat +3.2771%  
NA.PR.L PerpetualDiscount +3.3682% Now with a pre-tax bid-YTW of 6.85% based on a bid of 17.80 and a limitMaturity. Closing Quote 17.80-25, 13×5. Day’s range of 17.60-00.
CM.PR.P PerpetualDiscount +3.3916% Now with a pre-tax bid-YTW of 7.12% based on a bid of 19.51 and a limitMaturity. Closing Quote 19.51-57, 3×5. Day’s range of 18.87-47.
PWF.PR.E PerpetualDiscount +3.4269% Now with a pre-tax bid-YTW of 6.37% based on a bid of 21.73 and a limitMaturity. Closing Quote 21.73-74, 11×2. Day’s range of 21.28-73.
GWO.PR.G PerpetualDiscount +3.7190% Now with a pre-tax bid-YTW of 6.57% based on a bid of 20.08 and a limitMaturity. Closing Quote 20.08-30, 5×5. Day’s range of 19.60-50.
CM.PR.D PerpetualDiscount +3.7207% Now with a pre-tax bid-YTW of 7.14% based on a bid of 20.35 and a limitMaturity. Closing Quote 20.35-43, 5×3. Day’s range of 19.76-44.
STW.PR.A InterestBearing +4.0884% Asset coverage of 1.4+:1 as of October 30 according to Middlefield. Now with a pre-tax bid-YTW of 11.92% based on a bid of 9.42 and a hardMaturity 2009-12-31 at 10.00. Closing quote of 9.42-54, 4×2. Day’s range of 9.26-44.
BNA.PR.A SplitShare +4.3738% Asset coverage of just under 2.8:1 as of September 30 according to the company. Coverage now of 2.2-:1 based on BAM.A at 22.51 and 2.4 BAM.A held per preferred. Now with a pre-tax bid-YTW of 17.24% based on a bid of 21.00 and a hardMaturity 2010-9-30 at 25.00. Compare with BNA.PR.B (9.91% to 2016-3-25) and BNA.PR.C (13.39% to 2019-1-10). Closing quote 21.00-99, 16×7. Day’s range 20.12-65.
BCE.PR.G FixFloat +5.2138%  
MFC.PR.C PerpetualDiscount +5.9666% Now with a pre-tax bid-YTW of 6.45% based on a bid of 17.76 and a limitMaturity. Closing Quote 17.76-93, 1×1. Day’s range of 17.00-96.
Volume Highlights
Issue Index Volume Notes
CM.PR.A OpRet 89,327 Now with a pre-tax bid-YTW of 4.92% based on a bid of 25.29 and a softMaturity 2011-7-30 at 25.00.
RY.PR.L FixedReset 79,195 New issue, settled yesterday.
BMO.PR.I PerpetualDiscount 76,400 Called for redemption.
TD.PR.O PerpetualDiscount 75,850 Now with a pre-tax bid-YTW of 6.62% based on a bid of 18.49 and a limitMaturity.

There were thirty-eight other index-included $25-pv-equivalent issues trading over 10,000 shares today.

Market Action

November 3, 2008

Assiduous Readers will remember that the Fed’s balance sheet has been swollen as it has borrowed from Treasury and lent to … various third parties. The fact that Treasuries are being sold to finance the lending makes the various programmes monetarily neutral and therefore, to a first approximation, non-inflationary (inflation may still result if the process generates false signals regarding use of capital funds, but that’s a second order effect). Today the butcher’s bill came in:

The U.S. Treasury predicted it would borrow this quarter more than three times the amount initially forecast as weaker economic growth and the costs of a new bank rescue package swell the budget deficit.

Borrowing needs will rise to $550 billion in the three months to Dec. 31, compared with the $142 billion predicted in July, the Treasury said in a statement in Washington. That would be more than double the largest ever — a record $244 billion in new marketable debt in the first three months of this year.

I am an enthusiastic supporter of the Fed’s actions, but this is illustrative of the need for fiscal restraint in good times – which has been sorely lacking. At some point – as has happened in Taiwan with insurers and agency paper, as mentioned October 28 – the rest of the world will decide it has quite enough US paper, thank you very much, and then we’re all in trouble.

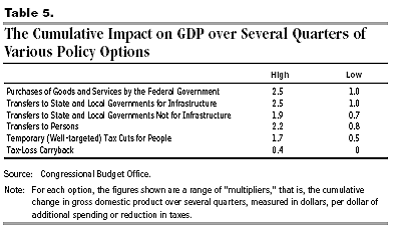
Econbrowser‘s (admittedly partisan) Menzie Chinn provides a comparison of the McCain and Obama tax ‘n’ stimulus plans:

Dr. Chinn also provides a link to the Committee for a Responsible Federal Budget’s Guide to Stimulus Proposals: The 2008 Presidential Election. I confess I have not investigated campaign or third-party reactions to this analysis – but it makes for good reading!

He also performs calculations based on analyses of the Tax Policy Centre:

I have added a bonus spreadsheet to the post regarding my essay on CPD.

A very strong day for PerpetualDiscounts, but volume returned to normal levels.

Note that these indices are experimental; the absolute and relative daily values are expected to change in the final version. In this version, index values are based at 1,000.0 on 2006-6-30.
The Fixed-Reset index was added effective 2008-9-5 at that day’s closing value of 1,119.4 for the Fixed-Floater index.
Index Mean Current Yield (at bid) Mean YTW Mean Average Trading Value Mean Mod Dur (YTW) Issues Day’s Perf. Index Value
Ratchet N/A N/A N/A N/A 0 N/A N/A
Fixed-Floater 5.45% 5.54% 71,455 14.92 6 +0.4997% 959.1
Floater 6.74% 6.84% 48,590 12.70 2 +0.9284% 516.2
Op. Retract 5.28% 6.11% 129,514 4.00 15 +0.5423% 999.9
Split-Share 6.31% 10.79% 58,350 3.96 12 +0.1262% 932.8
Interest Bearing 8.13% 14.97% 61,714 3.26 3 -3.4615% 871.8
Perpetual-Premium N/A N/A N/A N/A N/A N/A N/A
Perpetual-Discount 6.77% 6.83% 178,900 12.80 71 +1.0859% 805.1
Fixed-Reset 5.35% 5.13% 906,342 15.13 11 +0.5319% 1,077.6
Major Price Changes
Issue Index Change Notes
FIG.PR.A InterestBearing -7.4074% Asset coverage of 1.3+:1 based on Capital Unit NAV of 4.88 and 0.71 Capital Units per Preferred. Now with a pre-tax bid-YTW of 12.41% based on a bid of 7.5 and a hardMaturity 2014-12-31 at 10.00. Closing quote of 7.50-12, 5×1. Day’s range of 7.44-24.
BNA.PR.A SplitShare -6.8519% Asset coverage of just under 2.8:1 as of September 30 according to the company. Coverage now of 2.1+:1 based on BAM.A at 21.96 and 2.4 BAM.A held per preferred. Now with a pre-tax bid-YTW of 19.84% based on a bid of 20.12 and a hardMaturity 2010-9-30 at 25.00. Compare with BNA.PR.B (10.12% to 2016-3-25) and BNA.PR.C (14.16% to 2019-1-10). Closing quote 20.12-70, 1×1. Day’s range 20.06-22.00.
BAM.PR.K Floater -6.6790%  
PWF.PR.F PerpetualDiscount -3.1683% Now with a pre-tax bid-YTW of 6.77% based on a bid of 19.56 and a limitMaturity. Closing quote 19.56-97, 14X1. Day’s range 20.00-06.
MFC.PR.C PerpetualDiscount +3.0534% Now with a pre-tax bid-YTW of 6.83% based on a bid of 16.76 and a limitMaturity. Closing Quote 16.76-25, 7×2. Day’s range of 16.50-75.
GWO.PR.I PerpetualDiscount +3.2719% Now with a pre-tax bid-YTW of 6.58% based on a bid of 17.36 and a limitMaturity. Closing Quote 17.36-55, 4×1. Day’s range of 17.31-74.
BNS.PR.O PerpetualDiscount +3.4722% Now with a pre-tax bid-YTW of 6.31% based on a bid of 22.35 and a limitMaturity. Closing Quote 22.35-89, 10×5. Day’s range of 22.00-90.
PWF.PR.E PerpetualDiscount +4.0099% Now with a pre-tax bid-YTW of 6.60% based on a bid of 21.01 and a limitMaturity. Closing Quote 21.01-49, 2×1. Day’s range of 20.41-21.50.
HSB.PR.C PerpetualDiscount +4.0099% Now with a pre-tax bid-YTW of 6.60% based on a bid of 21.01 and a limitMaturity. Closing Quote 18.73-99, 22X7. Day’s range of 18.49-99.
GWO.PR.H PerpetualDiscount +4.1152% Now with a pre-tax bid-YTW of 6.96% based on a bid of 17.71 and a limitMaturity. Closing Quote 17.71-69, 11×2. Day’s range of 17.24-18.69.
TD.PR.Y FixedReset +4.3497%  
BNA.PR.B SplitShare +4.7726 See BNA.PR.A, above. Closing quote of 18.66-20.55 (!) 13×7. Day’s range of 18.50-49
W.PR.J PerpetualDiscount +4.7953% Now with a pre-tax bid-YTW of 7.92% based on a bid of 17.92 and a limitMaturity. Closing Quote 17.92-24, 3×1. Day’s range of 17.68-96.
RY.PR.A PerpetualDiscount +5.2016% Now with a pre-tax bid-YTW of 6.20% based on a bid of 18.00 and a limitMaturity. Closing Quote 18.00-18, 6×20. Day’s range of 17.15-18.50.
W.PR.H PerpetualDiscount +5.5882% Now with a pre-tax bid-YTW of 7.77% based on a bid of 17.95 and a limitMaturity. Closing Quote 17.95-73, 1×1. Day’s range of 17.75-50.
LBS.PR.A SplitShare +5.5901% Asset coverage of 1.7+:1 as of October 30 according to Brompton Group. Now with a pre-tax bid-YTW of 9.14% based on a bid of 8.50 and a hardMaturity 2013-11-29 at 10.00. Closing quote of 8.50-00, 2×1. Day’s range of 8.12-00.
BAM.PR.B Floater +8.0808%  
Volume Highlights
Issue Index Volume Notes
RY.PR.L FixedReset 418,820 National Bank crossed 175,000 at 24.70 and RBC bought three blocks of 10,000 each, from anonymous (24.74), Dundee (24.75) and CIBC (24.75). New issue, settled today.
GWO.PR.G PerpetualDiscount 75,725 Nesbitt crossed 70,000 at 19.10. Now with a pre-tax bid-YTW of 6.82% based on a bid of 19.36 and a limitMaturity.
TD.PR.O PerpetualDiscount 25,370 Now with a pre-tax bid-YTW of 6.65% based on a bid of 18.39 and a limitMaturity.
RY.PR.G PerpetualDiscount 20,332 Now with a pre-tax bid-YTW of 6.33% based on a bid of 17.85 and a limitMaturity.
RY.PR.D PerpetualDiscount 17,500 Now with a pre-tax bid-YTW of 6.41% based on a bid of 17.61 and a limitMaturity.

There were eighteen other index-included $25-pv-equivalent issues trading over 10,000 shares today.

Market Action

October 31, 2008

The Apocalyptionists will be upset! Not only did DTCC close out Lehman’s CDS book without loss:

it successfully closed out over $500 billion in market participants’ exposure from the Lehman Brothers, Inc. (Lehman) bankruptcy which occurred the week of Sept. 22. This was the largest close-out in DTCC’s history. DTCC reports it does not expect there to be any impact to its retained earnings or to market participants’ clearing fund deposits as a result of closing out these pending trade obligations.

“The liquidation of Lehman was complex, involved multiple asset classes, and required a methodical approach to mitigate potential losses from outstanding trading obligations,” said Donald F. Donahue, DTCC chairman and CEO. “Without question, our ability to manage risk and see exposure from a central vantage point was instrumental in helping us ensure that market risk – and systemic risk – was avoided.

… but settlement of CDS obligations on Lehman itself proceeded seamlessly …

On Oct. 21, DTCC also completed, without incident, the automated credit event processing of Lehman Brothers Holdings Inc. (LBHI) involving $72 billion of credit default swaps. DTCC calculated and bilaterally netted all amounts due on credit default swaps written on LBHI. This resulted in approximately US$5.2 billion owed from net sellers of protection on LBHI to net buyers of protection. The portion of this net funds settlement allocable to trades between major dealers was handled through the normal settlement procedures of CLS Bank International, DTCC’s settlement partner for the Warehouse and the world’s central settlement bank for foreign exchange.

DTCC also announced:

it will begin to publish aggregate market data from its Trade Information Warehouse (Warehouse), the worldwide central trade registry it maintains on credit derivatives. Starting Tuesday, November 4 and continuing weekly, DTCC will post on its website www.dtcc.com/derivserv the outstanding gross and net notional values (“stock” values) of credit default swap (CDS) contracts registered in the Warehouse for the top 1,000 underlying single-name reference entities and all indices, as well as certain aggregates of this data on a gross notional basis only. The data is intended to address market concerns about transparency.

According to their 2007 Annual Report:

While the total outstanding of credit default swaps (CDS) has grown to $45.5 trillion in 2007 from $3.7 trillion in 2003, our Deriv/SERV platform has been credited with significantly reducing the risk previously associated with unconfirmed trades. Today, over 90% of CDS trades are matched and confirmed through Deriv/SERV, compared with 15% late in 2003.

I have added the warehouse information address to the links, under “US Fixed Income Data”.

The Treasury guarantee of bank debt – reported on October 27 as seeming cheap – is mired in confusion:

Almost three weeks after the government threw its guarantee behind new bank bonds, no U.S. finance company has braved the market.

While Citigroup Inc., JPMorgan Chase & Co. and Bank of America Corp. were the three largest U.S. banks issuing debt last year, they haven’t sold dollar-denominated corporate bonds since August.

Banks are hamstrung because they’re waiting for the “fine print,” said Ira Jersey, an interest-rate strategist at Credit Suisse Group AG in New York. Because they don’t know if the debt will be guaranteed under all circumstances, bonds are difficult to price, he said.

Mind you, the Commercial Paper programme – that is busily grossing up the Fed’s balance sheet – is working great!

Interest rates on U.S. commercial paper fell to about the lowest in four years after the Federal Reserve said it absorbed more than 9 percent of the market.

Interest rates on the highest-ranked 30-day commercial paper dropped 39 basis points to 2.02 percent, about the lowest in four years, according to yields offered by companies and compiled by Bloomberg. Yields on overnight and seven-day paper fell to the lowest levels in at least 13 years, Bloomberg data show.

Naked Capitalism reprints a Financial Times article regarding the effect of changes in bankruptcy law on the recent investment bank collapses:

The 2005 changes made clear that certain derivatives and financial transactions were exempt from provisions in the bankruptcy code that freeze a failed company’s assets until a court decides how to apportion them among creditors.

Lawyers said under the old rules, creditors of companies facing financial difficulties were wary of settling trades or seeking extra collateral because they knew such demands could precipitate a bankruptcy filing and potentially freeze their claims.

However, when the financial health of Bear, Lehman and AIG took a sharp turn for the worse this year, their trading counterparties – mainly hedge funds and other banks – were not deterred from seeking to settle their trades or forcing the three companies to put up more collateral.

Such pressure exacerbated the liquidity squeeze that ultimately forced the three companies to hoist the white flag. Bear was sold to JPMorgan in a cut-price deal in March, while Lehman filed for bankruptcy last month and AIG was rescued by a $120bn government loan.

Calculated Risk provides a thoroughly fascinating graph (via Dealbreaker and Abnormal Returns) [click for big]:

And, just to make Hallowe’en a little scarier, the FDIC closed down another bank:

As of October 17, 2008, Freedom Bank had total assets of $287 million and total deposits of $254 million. Fifth Third agreed to assume all the deposits for a premium of 1.16 percent. In addition to assuming the failed bank’s deposits, Fifth Third will purchase approximately $36 million of assets. The FDIC will retain the remaining assets for later disposition.

The FDIC estimates that the cost to the Deposit Insurance Fund will be between $80 million and $104 million. Fifth Third’s acquisition of all deposits was the “least costly” resolution for the FDIC’s Deposit Insurance Fund compared to alternatives. The last failure in Florida was First Priority Bank, Bradenton, which was closed on August 1, 2008. Freedom Bank is the seventeenth FDIC-insured institution to be closed this year.

A small bank, but look at the proportions! They had $287-million in assets, and Fifth Third is buying $36-million of them. That leaves the FDIC with $251-million and they’re expecting a loss of between $80-million and $100-million. Now that’s a whacking!

And that’s the end of another month – and it was a pretty horrible one for prefs, believe me! I’ll be doing all the usual posts shortly, but a brief examination is sufficient to conclude that CPD lost 7.21% on the month … a huge number for such a thoroughly diversified fund. MAPF, on the other hand, traded like gangbusters – an absolutely massive trading month – and, while still having lost money, will have out-performed CPD substantially.

The key to portfolio management is to arrange your portfolio into various asset classes that will meet your long terms goals without subjecting the portfolio as a whole to extreme short term risk. Then – and this is where I come in – you attempt to outperform within each asset class.

What a day on the market! Hefty volume, some very chunky crosses and a sharp move upwards! If only there had been more days like that this month!

PerpetualDiscounts were up 1.6586% to yield 6.90% (pre-tax price-weighted mean YTW). At the standard 1.4x equivalency factor, this is equivalent to 9.66% interest; long corporates ar at 7.5%, so the pre-tax interest-equivalent spread is 216bp … starting to narrow, but the bonds are wide!

Note that these indices are experimental; the absolute and relative daily values are expected to change in the final version. In this version, index values are based at 1,000.0 on 2006-6-30.
The Fixed-Reset index was added effective 2008-9-5 at that day’s closing value of 1,119.4 for the Fixed-Floater index.
Index Mean Current Yield (at bid) Mean YTW Mean Average Trading Value Mean Mod Dur (YTW) Issues Day’s Perf. Index Value
Ratchet N/A N/A N/A N/A 0 N/A N/A
Fixed-Floater 5.48% 5.58% 71,924 14.88 6 +0.5903% 954.3
Floater 6.77% 6.87% 47,375 12.68 2 +4.9676% 511.4
Op. Retract 5.32% 6.26% 138,218 4.04 14 -0.0610% 994.5
Split-Share 6.31% 10.59% 58,596 3.95 12 +1.5057% 932.8
Interest Bearing 7.84% 13.20% 62,801 3.31 3 +1.0131% 903.1
Perpetual-Premium 7.26% 7.38% 55,115 12.05 1 -2.2273% 854.4
Perpetual-Discount 6.83% 6.90% 181,966 12.72 70 +1.6586% 796.4
Fixed-Reset 5.38% 5.09% 744,899 15.18 10 -0.3484% 1,071.9
Major Price Changes
Issue Index Change Notes
TD.PR.Y FixedReset -5.1667%  
RY.PR.H PerpetualDiscount -3.4576% Now with a pre-tax bid-YTW of 6.59% based on a bid of 21.50 and a limitMaturity. Closing quote 21.50-70, 26×7. Day’s range 21.70-22.85.
RY.PR.G PerpetualDiscount +3.0000% Now with a pre-tax bid-YTW of 6.45% based on a bid of 17.51 and a limitMaturity. Closing Quote 17.51-74, 1×9. Day’s range of 16.91-54.
GWO.PR.G PerpetualDiscount +3.0685% Now with a pre-tax bid-YTW of 7.02% based on a bid of 18.81 and a limitMaturity. Closing Quote 18.81-99, 1×8. Day’s range of 18.39-99.
PWF.PR.G PerpetualDiscount +3.0928% Now with a pre-tax bid-YTW of 6.45% based on a bid of 23.00 and a limitMaturity. Closing Quote 23.00-50, 3×2. Day’s range of 22.30-23.49.
BMO.PR.J PerpetualDiscount +3.1153% Now with a pre-tax bid-YTW of 6.82% based on a bid of 16.55 and a limitMaturity. Closing Quote 16.55-73, 25×18. Day’s range of 16.30-74.
LFE.PR.A SplitShare +3.2917% Asset coverage of 1.8+:1 as of October 15 according to the company. Now with a pre-tax bid-YTW of 7.92% based on a bid of 9.10 and a hardMaturity 2012-12-1 at 10.00. Closing quote of 9.10-79, 14×4. Day’s range of 8.80-10.
PWF.PR.E PerpetualDiscount +3.4306% Now with a pre-tax bid-YTW of 6.86% based on a bid of 20.20 and a limitMaturity. Closing Quote 20.20-50, 2×1. Day’s range of 19.50-20.50.
CM.PR.G PerpetualDiscount +3.5039% Now with a pre-tax bid-YTW of 7.32% based on a bid of 18.61 and a limitMaturity. Closing Quote 18.61-73, 3×9. Day’s range of 17.96-40.
FIG.PR.A InterestBearing +3.5806% Asset coverage of 1.3+:1 based on Capital Unit NAV of 4.88 and 0.71 Capital Units per Preferred. Now with a pre-tax bid-YTW of 10.75% based on a bid of 8.10 and a hardMaturity 2014-12-31 at 10.00. Closing quote of 8.10-23, 1×2. Day’s range of 8.23-24.
ENB.PR.A PerpetualDiscount +3.6364% Now with a pre-tax bid-YTW of 6.13% based on a bid of 22.80 and a limitMaturity. Closing Quote 22.80-22, 1X5. Day’s range of 22.24-00.
BAM.PR.H OpRet +3.8095% Now with a pre-tax bid-YTW of 10.57% based on a bid of 21.80 and a softMaturity 2012-3-30 at 25.00. Compare with BAM.PR.I (10.86% to 2013-12-30), BAM.PR.J (9.58% to 2018-3-30) and BAM.PR.O (10.75% to 2013-6-30). Closing quote of 21.80-00, 6×5. Day’s range of 21.00-50.
RY.PR.D PerpetualDiscount +4.0428% Now with a pre-tax bid-YTW of 6.45% based on a bid of 17.50 and a limitMaturity. Closing Quote 17.50-74, 7×5. Day’s range of 17.00-51.
BCE.PR.C FixFloat +4.3929%  
RY.PR.E PerpetualDiscount +4.4118% Now with a pre-tax bid-YTW of 6.36% based on a bid of 17.75 and a limitMaturity. Closing Quote 17.75-92, 2×9. Day’s range of 16.91-90.
SLF.PR.C PerpetualDiscount +5.6063% Now with a pre-tax bid-YTW of 6.97% based on a bid of 16.20 and a limitMaturity. Closing Quote 16.20-39, 5×7. Day’s range of 15.50-38.
PWF.PR.F PerpetualDiscount +6.2599% Now with a pre-tax bid-YTW of 6.55% based on a bid of 16.20 and a limitMaturity. Closing Quote 20.20-99, 5×9. Day’s range of 19.50-90.
BNA.PR.A SplitShare +8.0000% Asset coverage of just under 2.8:1 as of September 30 according to the company. Coverage now of 2.0+:1 based on BAM.A at 21.10 and 2.4 BAM.A held per preferred. Now with a pre-tax bid-YTW of 15.42% based on a bid of 21.60 and a hardMaturity 2010-9-30 at 25.00. Compare with BNA.PR.B (10.94% to 2016-3-25) and BNA.PR.C (13.77% to 2019-1-10). Closing quote 21.60-22.89. Day’s range 20.10-00.
BAM.PR.B Floater +9.1510%  
POW.PR.B PerpetualDiscount +10.5263% Now with a pre-tax bid-YTW of 6.57% based on a bid of 20.58 and a limitMaturity. Closing Quote 20.58-91, 1×1. Day’s range of 18.55-20.95 (!).
Volume Highlights
Issue Index Volume Notes
WN.PR.A Scraps (would be PerpetualDiscount but there are credit concerns) 390,142 TD crossed 23,700 at 17.75, then Scotia crossed 350,800 at 17.89. Now with a pre-tax bid-YTW of 8.39% based on a bid of 17.66 and a limitMaturity
SLF.PR.B PerpetualDiscount 375,500 Nesbitt crossed 262,500 at 16.50, anonymous bought 12,400 from Nesbitt at 16.70, then Nesbitt crossed 75,000 at 16.50. Now with a pre-tax bid-YTW of 7.17% based on a bid of 17.00 and a limitMaturity
YPG.PR.B Scraps (Would be OpRet but there are credit concerns) 375,423 Scotia crossed 359,200 at 13.64. Now with a pre-tax bid-YTW of 14.16% based on a bid of 14.00 and a softMaturity 2017-6-29 at 25.00.
CL.PR.B PerpetualPremium (until midnight!) 193,220 Scotia crossed 176,200 at 21.98. Now with a pre-tax bid-YTW of 7.38% based on a bid of 21.51 and a limitMaturity.
PWF.PR.G PerpetualDiscount 192,500 Scotia crossed 189,100 at 23.49. Now with a pre-tax bid-YTW of 6.45% based on a bid of 23.00 and a limitMaturity.
W.PR.J PerpetualDiscount 175,167 Scotia crossed 162,300 at 17.24. Now with a pre-tax bid-YTW of 8.30% based on a bid of 17.10 and a limitMaturity.
TD.PR.R PerpetualDiscount 168,455 Scotia crossed 158,500 at 21.99. Now with a pre-tax bid-YTW of 6.44% based on a bid of 21.90 and a limitMaturity.
BAM.PR.N PerpetualDiscount 164,013 Scotia crossed 133,700 at 12.94. Now with a pre-tax bid-YTW of 9.50% based on a bid of 12.75 and a limitMaturity.
IAG.PR.A PerpetualDiscount 146,300 Scotia crossed 145,200 at 16.73. Now with a pre-tax bid-YTW of 7.07% based on a bid of 16.51 and a limitMaturity.
BPP.PR.M Scraps (Would be Floater but there are credit concerns) 137,399 Trades by appointment … but today somebody made an appointment! Scotia crossed 137,300 at 16.99.
EPP.PR.A Scraps (would be PerpetualDiscount but there are credit concerns) 127,641 Scotia crossed 123,000 at 14.99. Now with a pre-tax bid-YTW of 8.42% based on a bid of 14.66 and a limitMaturity.
POW.PR.C PerpetualDiscount 126,300 Scotia crossed 124,700 at 20.48. Now with a pre-tax bid-YTW of 7.17% based on a bid of 20.48 and a limitMaturity.
DC.PR.A Scraps (would be OpRet but there are credit concerns) 124,425 Scotia crossed 123,100 at 14.98. Now with a pre-tax bid-YTW of 15.05% based on a bid of 14.01 and a softMaturity 2016-6-29 at 25.00.
BAM.PR.K Floater 117,550 Scotia crossed 116,800 at 11.88.
GWO.PR.H PerpetualDiscount 117,535 Scotia crossed 95,100 at 17.68. Now with a pre-tax bid-YTW of 7.24% based on a bid of 17.01 and a limitMaturity.
CM.PR.E PerpetualDiscount 104,725 Scotia crossed 100,700 at 19.68. Now with a pre-tax bid-YTW of 7.28% based on a bid of 19.41 and a limitMaturity.
DW.PR.A Scraps (would be OpRet but there are credit concerns) 103,360 Scotia crossed 98,500 at 20.49. Now with a pre-tax bid-YTW of 8.02% based on a bid of 20.26 and a limitMaturity.
BAM.PR.B Floater 102,306 Scotia crossed 88,100 at 10.04.

There were forty-five other index-included $25-pv-equivalent issues trading over 10,000 shares today.

Market Action

October 30, 2008

There is news of a substantial drop in LIBOR:

The swap agreements with central banks, which also followed rate cuts from China to Norway, led to a drop in three-month rates in Asia. The London interbank offered rate, or Libor, for three- month loans in dollars slid 23 basis points to 3.19 percent today, its 14th consecutive drop, according to the British Bankers’ Association. The overnight dollar rate tumbled 41 basis points to 0.73 percent, the lowest level since at least January 2001.

The three-month Libor for dollars remains 219 basis points above the Fed’s rate, up from 82 basis points the day Lehman failed. It was 192 basis points yesterday before the rate cut.

The re-intermediation (novo-intermediation? It hasn’t really been done before) by the Fed in the US commercial paper markets (discussed last weekend) has continued big-time with the Fed’s latest H.4.1 release showing an increase of nearly $200-billion in deposits from banks, offset by a decline of $36-billion in Treasury balances, an increase of $145-billion in commercial paper holdings and an increase of $22-billion in foreign currency assets.

I expressed concern yesterday that the Excess Reserves / Discount Window spread, at 60bp, was too small to encourage reintermediation by the the banks – I’d like to see that bumped to 85bp just for starters. But I’m less concerned about the spread on the Commercial Paper Funding Facility – at 235bp for regular commercial paper, it’s high enough to encourage reintermediation by the banks as soon as they’re feeling a little braver.

Derek DeCloet has a column in today’s Globe cackling with glee over hedge funds that didn’t hedge; in this category comes a fund from Deephaven which is being deep-sixed:

Deephaven Capital Management LLC, the hedge-fund unit of stockbroker Knight Capital Group Inc., froze a $1.6 billion fund after investors asked to get back 30 percent of their money.

Withdrawals from the Deephaven Global Multistrategy Fund were suspended so managers wouldn’t be forced to sell assets in falling stock and debt markets, the Minnetonka, Minnesota-based firm said today in a letter to investors. Lenders and trading partners also imposed stricter financing requirements, according to the letter.

If it was an actual hedge fund, of course, they would be buying just as much as selling. But perhaps I quibble.

Treasury today released guidance on tax breaks for Fannie & Freddie preferred share investors (as long as they’re banks):

The Treasury Department and the Internal Revenue Service today issued Revenue Procedure 2008-64 (Rev. Proc. 2008-64), which provides that certain gains and losses from indirect ownership of Fannie Mae and Freddie Mac preferred stock can be treated as ordinary income and loss.

The Emergency Economic Stabilization Act of 2008 (EESA) provided banks and certain financial institutions ordinary treatment for gains and losses on direct investments in preferred stock of Fannie Mae and Freddie Mac. It also directed the Treasury Department to issue guidance with respect to the treatment of these gains or losses when realized indirectly through certain investment vehicles.

Rev. Proc. 2008-64 provides banks and certain other financial institutions the benefit of ordinary treatment on gains and losses that they are experiencing on certain indirect investments in this preferred stock.

And, just to ensure everybody is cheerful, there is news of a lock-up in the Japanese bond market:

Japanese yen corporate bond sales dried up in the second half of October as the seizure in global credit markets, plunging equity values and volatility in the Asian nation’s currency deterred investors.

Toyota Finance Corp. was the last company to sell yen bonds when it issued 42 billion yen ($428 million) of three- and five- year notes on Oct. 15, data compiled by Bloomberg show. The Tokyo-based lessor reduced that sale from a planned 50 billion yen after market turmoil pushed up borrowing costs, a company official said at the time.

“The credit market is dead,” said Kazuaki Oh’e, a debt salesman in Tokyo at CIBC World Markets Japan, part of Canada’s fifth-biggest bank. “Investors don’t want to buy anything because there’s so much credit risk right now.”

An active day for prefs – and there were many lower-quality issues trading in good volume that weren’t included in the tally.

Note that these indices are experimental; the absolute and relative daily values are expected to change in the final version. In this version, index values are based at 1,000.0 on 2006-6-30.
The Fixed-Reset index was added effective 2008-9-5 at that day’s closing value of 1,119.4 for the Fixed-Floater index.
Index Mean Current Yield (at bid) Mean YTW Mean Average Trading Value Mean Mod Dur (YTW) Issues Day’s Perf. Index Value
Ratchet N/A N/A N/A N/A 0 N/A N/A
Fixed-Floater 5.51% 5.65% 68,044 14.86 6 +1.5931% 948.7
Floater 7.10% 7.20% 44,033 12.29 2 +0.1245% 487.2
Op. Retract 5.32% 6.25% 139,562 4.05 14 +0.3423% 995.1
Split-Share 6.40% 11.19% 59,283 3.97 12 +0.2109% 919.0
Interest Bearing 7.91% 12.82% 62,873 3.25 3 +1.9088% 894.0
Perpetual-Premium 7.10% 7.21% 51,203 12.26 1 +0.0000% 873.8
Perpetual-Discount 6.94% 7.01% 176,473 12.58 70 +0.4196% 783.5
Fixed-Reset 5.36% 5.06% 767,762 15.22 10 +0.6165% 1,075.6
Major Price Changes
Issue Index Change Notes
LBS.PR.A SplitShare -5.8683% Asset coverage of 1.7+:1 as of October 23, according to Brompton Group. Now with a pre-tax bid-YTW of 10.98% based on a bid of 7.86 and a hardMaturity 2013-11-29 at 10.00. Closing quote of 7.86-34, 3×1. Day’s range of 7.81-80.
HSB.PR.C PerpetualDiscount -5.3305% Now with a pre-tax bid-YTW of 7.29% based on a bid of 17.76 and a limitMaturity. Closing quote 17.76-18, 3×2. Day’s range 17.99-19.19.
PWF.PR.E PerpetualDiscount -4.7782% Now with a pre-tax bid-YTW of 7.10% based on a bid of 19.53 and a limitMaturity. Closing Quote 19.53-89, 3×1. Day’s range of 19.53-51.
CU.PR.B PerpetualDiscount -4.2581% Now with a pre-tax bid-YTW of 6.86% based on a bid of 22.26 and a limitMaturity. Closing quote 22.26-74, 1X3. Day’s range 22.00-23.50.
W.PR.J PerpetualDiscount -2.8571% Now with a pre-tax bid-YTW of 8.35% based on a bid of 17.00 and a limitMaturity. Closing quote 17.00-24, 8X3. Day’s range 16.56-50.
TD.PR.M OpRet +2.1199% Now with a pre-tax bid-YTW of 4.68% based on a bid of 25.05 and a softMaturity. Closing quote 25.05-39, 18×5. All three trades were at 24.95.
POW.PR.A PerpetualDiscount +2.2277% Now with a pre-tax bid-YTW of 6.86% based on a bid of 20.65 and a limitMaturity. Closing quote 20.65-94. Day’s range 20.49-65.
PWF.PR.F PerpetualDiscount +2.2593% Now with a pre-tax bid-YTW of 6.96% based on a bid of 19.01 and a limitMaturity. Closing quote 19.01-75, 2X8. Day’s range 18.81-25.
SLF.PR.A PerpetualDiscount +2.3016% Now with a pre-tax bid-YTW of 7.14% based on a bid of 16.89 and a limitMaturity. Closing quote 16.89-17.98, 15X2. Day’s range 16.41-00.
FTN.PR.A SplitShare +2.396% Asset coverage of 1.9+:1 as of October 15 according to the company. Now with a pre-tax bid-YTW of 8.96% based on a bid of 8.12 and a hardMaturity 2015-12-1 at 10.00. Closing quote 8.12-24, 33X2. Day’s range of 7.99-24
BNA.PR.B SplitShare +2.4419% Asset coverage of just under 2.8:1 as of September 30 according to the company. Coverage now of 2.1-:1 based on BAM.A at 21.86 and 2.4 BAM.A held per preferred. Now with a pre-tax bid-YTW of 11.12% based on a bid of 17.62 and a hardMaturity 2016-3-25 at 25.00. Compare with BNA.PR.A (20.08% to 2010-9-30) and BNA.PR.C (13.59% to 2019-1-10). Closing quote 17.62-00, 5X20. Day’s range 17.52-00.
LFE.PR.A SplitShare +2.4419% Asset coverage of 1.8+:1 as of October 15 according to the company. Now with a pre-tax bid-YTW of 8.83% based on a bid of 8.81 and a hardMaturity 2012-12-1 at 10.00. Closing quote of 8.81-43, 3X3. One trade at 9.00
CM.PR.E PerpetualDiscount +2.4731% Now with a pre-tax bid-YTW of 7.42% based on a bid of 19.06 and a limitMaturity. Closing Quote 19.06-17, 4X5. Day’s range of 18.65-25.
CU.PR.A PerpetualDiscount +3.0928% Now with a pre-tax bid-YTW of 6.42% based on a bid of 23.00 and a limitMaturity. Closing Quote 23.00-75, 7X5. Day’s range of 23.00-75.
WFS.PR.A SplitShare +3.3333% Asset coverage of 1.4-:1 as of October 23, according to Mulvihill. Now with a pre-tax bid-YTW of 16.32% based on a bid of 7.75 and a hardMaturity 2011-6-30 at 10.00. Closing quote of 7.75-96, 1×1. Day’s range of 7.50-75.
CM.PR.D PerpetualDiscount +3.4648% Now with a pre-tax bid-YTW of 7.48% based on a bid of 19.41 and a limitMaturity. Closing Quote 19.41-55, 2X10. Day’s range of 18.99-25.
BSD.PR.A InterestBearing +3.6036% Asset coverage of 0.9+:1 as of October 24 according to Brookfield Funds. Now with a pre-tax bid-YTW of 17.66% based on a bid of 5.75 and a hardMaturity 2015-3-31 at 10.00 … though as pointed out by Assiduous Reader prefhound, use of $10.00 maturity value is, at the very least, something of a leap of faith. Closing quote of 5.75-89, 36X4. Day’s range of 5.65-36
POW.PR.D PerpetualDiscount +3.6600% Now with a pre-tax bid-YTW of 7.20% based on a bid of 17.56 and a limitMaturity. Closing Quote 17.56-71, 1×1. Day’s range of 17.00-72.
CM.PR.K FixedReset +4.3956%  
BCE.PR.I FixFloat +4.4776%  
Volume Highlights
Issue Index Volume Notes
CM.PR.I PerpetualDiscount 217,527 Nesbitt crossed 200,000 at 15.50. Now with a pre-tax bid-YTW of 7.65% based on a bid of 15.51 and a limitMaturity
CM.PR.G PerpetualDiscount 140,300 Nesbitt crossed 50,000 at 17.76, then 78,400 at 18.00. Now with a pre-tax bid-YTW of 7.58% based on a bid of 17.98 and a limitMaturity
ALB.PR.A SplitShare 132,872 CIBC crossed 128,600 at 23.55. Asset coverage of 1.5+:1 as of October 23 according to Scotia Managed Companies. Now with a pre-tax bid-YTW of 9.28% based on a bid of 22.62 and a hardMaturity 2011-2-28 at 25.00. Closing quote of 22.62-54, 1×2. Day’s range of 22.56-23.57.
CM.PR.J PerpetualDiscount 108,995 Nesbitt crossed 88,800 at 15.00. Now with a pre-tax bid-YTW of 7.57% based on a bid of 15.00 and a limitMaturity.
TD.PR.O PerpetualDiscount 76,800 Nesbitt crossed 60,000 at 18.25. Now with a pre-tax bid-YTW of 6.64% based on a bid of 18.41 and a limitMaturity.

There were thirty-eight other index-included $25-pv-equivalent issues trading over 10,000 shares today.

Market Action

October 29, 2008

Deflation? Econbrowser‘s James Hamilton doesn’t think so!

If the U.S. were ever to arrive at such a situation, here’s what I’d recommend. First, have the Federal Reserve buy up the entire outstanding debt of the U.S. Treasury, which it can do easily enough by just creating new dollars to pay for the Treasury securities. No need to worry about those burdens on future taxpayers now! Then buy up all the commercial paper anybody cares to issue. Bye-bye credit crunch! In fact, you might as well buy up all the equities on the Tokyo Stock Exchange. Fix that nasty trade deficit while we’re at it! Print an arbitrarily large quantity of money with which you’re allowed to buy whatever you like at fixed nominal prices, and the sky’s the limit on what you might set out to do.

Of course, the reason I don’t advocate such policies is that they would cause a wee bit of inflation. It’s ridiculous to think that people would continue to sell these claims against real assets at a fixed exchange rate against dollar bills when we’re flooding the market with a tsunami of newly created dollars. But if inflation is what you want, put me in charge of the Federal Reserve and believe me, I can give you some inflation.

The Fed announced:

The Federal Open Market Committee decided today to lower its target for the federal funds rate 50 basis points to 1 percent.

In a related action, the Board of Governors unanimously approved a 50-basis-point decrease in the discount rate to 1-1/4 percent. In taking this action, the Board approved the requests submitted by the Boards of Directors of the Federal Reserve Banks of Boston, New York, Cleveland, and San Francisco.

The cut to 1.00% Fed Funds was widely anticipated. Remember that interest on excess reserves is Fed Funds less 35bp … the Fed is earning a spread of only 60bp on excess reserves to Discount Window. I would have been much more comfortable had the discount rate been lowered only 25bp to 1.50%.

There are indications that CDS rates are being used to price loans:

Nestle SA, the biggest food producer, Nokia Oyj, the largest mobile-phone maker, FirstEnergy Corp., the Ohio-based owner of electric utilities, and at least three other companies bowed to banks’ demands to link the interest rate on credit lines to the swaps, which are used to bet on borrowers’ likelihood of default.

[First Energy] would pay Libor plus 3 percentage points to draw on the line, according to company filings. Based on yesterday’s levels, FirstEnergy would be charged an additional 1.70 percentage points, reflecting the levels of its credit- default swaps, and another 1.35 percent to account for the bank’s own spread, according to [First Energy Assistant Treasurer Randy] Scilla.

This is a worrisome development. Events of the past year have shown that the ease of shorting corporate debt with CDSs has led to huge volatility, with some credits (e.g., CIT Group) trading at amazing levels … 2500bp or more, while maintaining an “A(low)” rating that seems entirely justified. While I in favour of market based pricing in a general way, we have seen (in the pricing of AAA sub-prime tranches) that total reliance on market pricing implies total reliance on infinite liquidity … and we ain’t there, by a long shot.

Simply put, there isn’t enough depth in the CDS market to ensure that there will be sufficient supply of protection writers when the cowboys take a run at these companies.

On the other hand, the facilities arranged – so far – with these CDS-linked rates are commercial paper back-up lines. Together with the Big Scare due to the recent lock-up of the the CP market, we may see a reduced corporate reliance on money market paper, with a massive term extension – at least to five year notes – to handle the funding instead. This part is a Good Thing, because it will decrease the term mismatch between assets and liabilities on corporate balance sheets.

So right now, it is unclear how this will play out, as is the case with so much of the structural change that taking place in financial markets right now.

Speaking of shorts how about that VW, eh?:

Porsche, a rival seeking to build one of Europe’s great car dynasties, revealed it had increased its holdings in VW, giving it an economic stake equal to about 75 percent of the company’s voting shares.

Volkswagen’s stock soared to as high as 1,005 euros a share, about $1,258, on Tuesday before closing at 918 euros. The shares ended last week at 210 euros.

On Sunday, Porsche said it raised its stake in Volkswagen to 42.6 percent from 35 percent, and that it had taken options for another 31.5 percent.

Porsche said it made the announcement to give investors who sold the stock short “the opportunity to close their positions unhurriedly and without bigger risk.”

The opposite happened. The risk soared, and the short sellers were forced to act quickly.

Volkswagen is one of the 30 companies in the DAX index, Germany’s most prominent stock index, and index funds own a significant number of shares.

Those funds, however, may sell shares Wednesday. On Tuesday night the German stock exchange said it would reduce from 27 percent to 10 percent the weighting of VW in the index. To rebalance, the funds will have to sell VW and buy the 29 other companies.

The re-weighting of VW in DAX is a disgrace:

“This adjustment is an extraordinary measure,” Deutsche Boerse said in a statement yesterday. The reduction will take place on Nov. 3, and the weightings of other DAX companies will also be adjusted at that time.

Changing the rules because some short-sellers are getting toasted? That’s not your job, guys! If you want to create a capped index – as the Toronto Exchange did after the Nortel fiasco – that’s fine … but the occasional gruesome loss is part of the risk of being short, and the occasional bonus profit is part of the reward of being long.

As Dealbreaker so eloquently states:

That’s the other shoe dropping right there. Shares drop 50%, it’s a regulatory failure. Shares spike 400%, its a regulatory failure.

When are we going to let risk be risk? These are all big boys playing with Volkswagen. Had it gone right, they would have made big profits.

BCE has announced its 3Q08 Operating Results, and it doesn’t seem – to me – to help the chances for a successful conclusion of the takeover much.

BCE’s cash from operating activities was $1,649 million this quarter, up 2.7% from last year. BCE’s free cash flow [footnote 3] of $89 million this quarter was lower than $425 million in Q3 2007 due to the expenditure of $741 million for AWS spectrum licences partly offset by a reduction of $293 million in common dividends paid.

[Footnote 3 – extract] We define free cash flow as cash from operating activities after capital expenditures, total dividends and other investing activities.

BCE is also looking at a significant mark-to-market hit on its pension obligations.

Another fairly active day on the preferred market, with players trying to figure out where things are supposed to be! There are plenty of instances of yield relationships between issuers being completely haywire.

Note that these indices are experimental; the absolute and relative daily values are expected to change in the final version. In this version, index values are based at 1,000.0 on 2006-6-30.
The Fixed-Reset index was added effective 2008-9-5 at that day’s closing value of 1,119.4 for the Fixed-Floater index.
Index Mean Current Yield (at bid) Mean YTW Mean Average Trading Value Mean Mod Dur (YTW) Issues Day’s Perf. Index Value
Ratchet N/A N/A N/A N/A 0 N/A N/A
Fixed-Floater 5.59% 5.83% 68,587 14.79 6 +1.0406% 933.8
Floater 7.10% 7.21% 44,772 12.28 2 -4.5766% 486.6
Op. Retract 5.34% 6.28% 137,967 4.04 14 -0.2956% 991.7
Split-Share 6.41% 11.21% 57,372 3.97 12 +0.5435% 917.0
Interest Bearing 8.06% 13.63% 62,856 3.24 3 +4.3511% 877.2
Perpetual-Premium 7.10% 7.21% 51,697 12.26 1 +0.4108% 873.8
Perpetual-Discount 6.97% 7.03% 175,239 12.55 70 -0.0609% 780.2
Fixed-Reset 5.39% 5.10% 786,445 15.18 10 +0.0482% 1,069.1
Major Price Changes
Issue Index Change Notes
BAM.PR.B Floater -9.7943% Now trading in single digits! I don’t get it, really … 1.7x prime in perpetuity as a dividend from a company that, at the very least, is half-decent?
W.PR.H PerpetualDiscount -4.8451% Now with a pre-tax bid-YTW of 8.25% based on a bid of 16.89 and a limitMaturity. Closing quote 16.89-18.00, 3×1. Day’s range 16.90-50.
POW.PR.B PerpetualDiscount -3.6126% Now with a pre-tax bid-YTW of 7.35% based on a bid of 18.41 and a limitMaturity. Closing Quote 18.41-70, 1×1. Day’s range of 18.60-55.
TD.PR.S FixedReset -3.4985%  
BAM.PR.J OpRet +-2.8409% Now with a pre-tax bid-YTW of 9.59% based on a bid of 18.81 and a softMaturity 2018-3-30 at 25.00. Compare with BAM.PR.H (11.83% to 2012-3-30), BAM.PR.I (10.25% to 2013-12-30) and BAM.PR.O (10.87% to 2013-6-30).
BMO.PR.K PerpetualDiscount -2.6970% Now with a pre-tax bid-YTW of 7.11% based on a bid of 18.50 and a limitMaturity. Closing Quote 18.50-94, 15×3. Day’s range of 18.50-35.
CU.PR.A PerpetualDiscount -2.6614% Now with a pre-tax bid-YTW of 6.61% based on a bid of 22.31 and a limitMaturity. Closing Quote 22.31-23.74, 1×1. Day’s range of 22.00-23.50.
BNA.PR.B SplitShare -2.6048% Asset coverage of just under 2.8:1 as of September 30 according to the company. Coverage now of 2.1+:1 based on BAM.A at 22.25 and 2.4 BAM.A held per preferred. Now with a pre-tax bid-YTW of 11.55% based on a bid of 17.20 and a hardMaturity 2016-3-25 at 25.00. Compare with BNA.PR.A (20.02% to 2010-9-30) and BNA.PR.C (13.51% to 2019-1-10). Closing quote 17.20-90, 10×8. Day’s range 17.50-90.
POW.PR.D PerpetualDiscount -2.5316% Now with a pre-tax bid-YTW of 7.47% based on a bid of 16.94 and a limitMaturity. Closing Quote 16.94-00, 1X3. Day’s range of 17.00-74.
PWF.PR.E PerpetualDiscount -2.3798% Now with a pre-tax bid-YTW of 6.76% based on a bid of 20.51 and a limitMaturity. Closing Quote 20.51-90 0X3. Zero? Well, that’s according to TMXMoney.com, anyway! Day’s range of 20.90-00.
SLF.PR.C PerpetualDiscount -2.3077% Now with a pre-tax bid-YTW of 7.42% based on a bid of 15.24 and a limitMaturity. Closing Quote 15.24-70, 9×4. Day’s range of 15.15-65.
SLF.PR.D PerpetualDiscount -2.0487% Now with a pre-tax bid-YTW of 7.39% based on a bid of 15.30 and a limitMaturity. Closing Quote 15.30-90, 2×4. Day’s range of 15.13-16.45.
CM.PR.G PerpetualDiscount +2.0115% Now with a pre-tax bid-YTW of 7.68% based on a bid of 17.75 and a limitMaturity. Closing Quote 17.75-95, 11×7. Day’s range of 17.00-99.
ELF.PR.G PerpetualDiscount +2.4306% Now with a pre-tax bid-YTW of 8.15% based on a bid of 14.75 and a limitMaturity. Closing Quote 14.75-50, 20×20. Day’s range of 14.37-55.
LFE.PR.A SplitShare +2.7794% Asset coverage of 1.8+:1 as of October 15 according to the company. Now with a pre-tax bid-YTW of 9.51% based on a bid of 8.60 and a hardMaturity 2012-12-1 at 10.00. Closing quote of 8.60-98, 15×2. Day’s range of 8.60-90.
IAG.PR.A PerpetualDiscount +3.1250% Now with a pre-tax bid-YTW of 7.08% based on a bid of 16.50 and a limitMaturity. Closing Quote 16.50-90, 9×9. Day’s range of 16.10-50.
RY.PR.H PerpetualDiscount +3.2962% Now with a pre-tax bid-YTW of 6.36% based on a bid of 22.25 and a limitMaturity. Closing Quote 22.25-85, 40×27. Day’s range of 21.60-22.85.
BCE.PR.R FixFloat +3.6596%  
BNS.PR.R FixedReset +3.6596%  
FIG.PR.A InterestBearing +4.4595% Asset coverage of 1.3-:1 as of October 27, according to the company, assuming 0.71 Capital Units per preferred. Now with a pre-tax bid-YTW of 11.73% based on a bid of 7.73 and a hardMaturity 2014-12-31 at 10.00. Closing quote of 7.73-01, 1×3. Day’s range of 7.57-25.
FTN.PR.A SplitShare +4.9178% Asset coverage of 1.9+:1 as of October 15 according to the company. Now with a pre-tax bid-YTW of 9.38% based on a bid of 7.93 and a hardMaturity 2015-12-1 at 10.00. Closing quote 7.93-09, 3×10. Day’s range of 8.00-24
CU.PR.B PerpetualDiscount +5.6818% Now with a pre-tax bid-YTW of 6.57% based on a bid of 23.25 and a limitMaturity. Closing Quote 23.25-50, 5×10. Today’s only board lot traded at 23.50.
BSD.PR.A InterestBearing +9.9010% Asset coverage of 0.9+:1 as of October 24 according to Brookfield Funds. Now with a pre-tax bid-YTW of 18.45% based on a bid of 5.55 and a hardMaturity 2015-3-31 at 10.00 … though as pointed out by Assiduous Reader prefhound, use of $10.00 maturity value is, at the very least, something of a leap of faith. Closing quote of 5.55-56, 40×1. Day’s range of 5.25-65
Volume Highlights
Issue Index Volume Notes
WN.PR.B Scraps (would be OpRet but there are credit concerns) 301,500 Now with a pre-tax bid-YTW of 5.81% based on a bid of 25.00 and a optionCertainty 2009-6-30 at 25.00.
TD.PR.M OpRet 170,400 Now with a pre-tax bid-YTW of 5.15% based on a bid of 24.53 and a softMaturity 2013-10-30 at 25.00.
BMO.PR.I OpRet 167,280 Called for redemption.
MFC.PR.A OpRet 127,930 Now with a pre-tax bid-YTW of 4.84% based on a bid of 24.05 and a softMaturity 2015-12-18 at 25.00.
TD.PR.N OpRet 75,700 Now with a pre-tax bid-YTW of 4.79% based on a bid of 24.80 and a softMaturity 2014-1-30 at 25.00.

There were twenty-seven other index-included $25-pv-equivalent issues trading over 10,000 shares today.