The Bank of China has cut its GSE holdings by 25%, according to a Financial Times piece passed on by Naked Capitalism:
The sale by China’s fourth largest commercial bank, which reduced its holdings of so-called agency debt by $4.6bn, is a sign of nervousness among foreign buyers of Fannie and Freddie’s bonds and guaranteed securities.
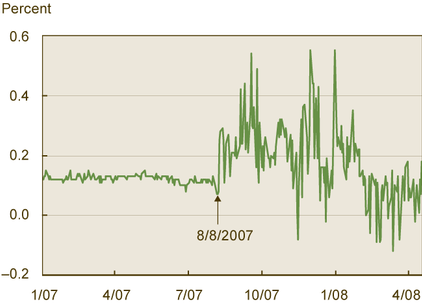
However, MBS spreads have narrowed over the past month:
The difference between yields on Fannie Mae’s current-coupon 30-year fixed-rate bonds and 10-year government notes narrowed 10 basis points this week to 197 basis points, data compiled by Bloomberg show, reducing the cost of new home loans. The spread fell from 215 basis points on Aug. 18, the widest since March, when the gap set a 22-year high of 238 basis points.
The MCDX index (of credit default swaps on US Munis; briefly mentioned May 23; aspersions were cast May 7) is being circled by vultures. Accrued Interest suggests a spread trade against corporates, but:
I think at some point, arbitragers will put this trade on, and it will expose a lack of deep liquidity in the contract. Talking to various traders, it looks like much of the trading in the MCDX has been macro hedgers, not betting on munis in particular, but using municipals as a means of hedging against a disaster event.
I’m not entirely convinced of the goodness of this hedge. Sure, there’s a positive carry. But there’s a big size-mismatch, which can be thought of as an enormous – infinite, actually, until you actually put some capital into the deal – duration mismatch. And I must say, I’m rather surprised that Accrued Interest did not pass on, or take a stab at estimating, the basis for this trade (which is to say, the spread vs. cash bonds). In the corporate arena, the basis is negative as often as not; with all the auction rate failures I would not be in the least bit surprised to learn that the basis is bigger … but I won’t go too far out on that limb, because Munis are easier to margin (I think; based simply on their risk-weight for banks).
Anyway, why would I want to sell protection? Why wouldn’t I just buy cash bonds?
If I were a betting man, I’d bet that Accrued Interest has such a great long weekend planned that he listened, first idly, then more seriously to one of the salesmen cowboys and wrote the post to help organize his thoughts. I note that according to Bloomberg, 5-year Munis yield 2.87%, while 5-Year AAA Banking & Finance paper yields 4.91%. AI states that the MCDX contract trades at 86.25bp and CDX IG [Corporate Investment Grade] at 144bp. Hmm… I’m going to have to think about this over the weekend myself, and try to figure out what the tax effects are doing!
It is perhaps not coincidental that this opinion was published on the same day that Jefferson County managed to stave off default for another month.
And another US bank went bust:
Integrity Bank, with $1.1 billion in assets and $974 million in deposits, was shuttered by the Georgia Department of Banking and Finance and the Federal Deposit Insurance Corp. Regions Financial Corp., Alabama’s biggest bank, will assume all deposits from Integrity, which was run by Integrity Bancshares Inc. The failed bank’s five offices will open on Sept. 2 as branches of Regions, the FDIC said.
…
Regions will buy about $34.4 million in assets and will pay the FDIC a premium of 1.01 percent to assume the failed bank’s deposits, the FDIC said. The FDIC estimates the cost of the Integrity failure to its deposit-insurance fund will be $250 million to $300 million.
And that’s another month done! Twenty trading days and PerpetualDiscounts were down on only four of them, returning a total of +3.91%. The total return index is now back to just below where it was on June 26 … but is still 4.90% below its May 30 level, which puts things in perspective a bit.
The weighted average pre-tax bid-YTW is 6.11%, equivalent to 8.55% interest at the standard 1.4x equivalency factor. Long Corporates were down on the month, with significant widening against Canadas; they now yield about 6.20%, so the pre-tax interest equivalent spread is now 235bp … still pretty wide!
The fund did quite well on the month. I have a back of an envelope calculation indicating that the portfolio’s gross return (before fees and expenses) was comfortably in excess of 5.50%, so I’m pretty happy about that. Turnover was a little in excess of 100% – take that, passive advocates! Commissions are significant, but market impact and spread costs can be … negative.
| Note that these indices are experimental; the absolute and relative daily values are expected to change in the final version. In this version, index values are based at 1,000.0 on 2006-6-30 | |||||||
| Index | Mean Current Yield (at bid) | Mean YTW | Mean Average Trading Value | Mean Mod Dur (YTW) | Issues | Day’s Perf. | Index Value |
| Ratchet | N/A | N/A | N/A | N/A | 0 | N/A | N/A |
| Fixed-Floater | 4.60% | 4.38% | 57,812 | 16.40 | 7 | -0.0346% | 1,113.5 |
| Floater | 4.05% | 4.09% | 42.354 | 17.16 | 3 | -0.3538% | 911.6 |
| Op. Retract | 4.97% | 3.92% | 109,916 | 2.80 | 17 | -0.0238% | 1,054.4 |
| Split-Share | 5.35% | 5.85% | 54,962 | 4.36 | 14 | -0.0009% | 1,042.9 |
| Interest Bearing | 6.25% | 6.62% | 46,848 | 5.26 | 2 | 0.0510% | 1,129.8 |
| Perpetual-Premium | 6.16% | 5.41% | 63,809 | 2.25 | 1 | 0.0000% | 1,007.3 |
| Perpetual-Discount | 6.05% | 6.11% | 192,930 | 13.75 | 70 | +0.3506% | 881.0 |
| Major Price Changes | |||
| Issue | Index | Change | Notes |
| BAM.PR.B | Floater | -1.0764% | |
| ELF.PR.F | PerpetualDiscount | -1.0357% | Now with a pre-tax bid-YTW of 7.06% based on a bid of 19.11 and a limitMaturity. |
| RY.PR.B | PerpetualDiscount | +1.0309% | Now with a pre-tax bid-YTW of 6.05% based on a bid of 19.60 and a limitMaturity. |
| CM.PR.G | PerpetualDiscount | +1.0706% | Now with a pre-tax bid-YTW of 6.60% based on a bid of 20.77 and a limitMaturity. |
| PWF.PR.E | PerpetualDiscount | +2.0399% | Now with a pre-tax bid-YTW of 5.87% based on a bid of 23.51 and a limitMaturity. |
| POW.PR.D | PerpetualDiscount | +2.0833% | Now with a pre-tax bid-YTW of 6.03% based on a bid of 21.07 and a limitMaturity. |
| BAM.PR.M | PerpetualDiscount | +2.3200% | Now with a pre-tax bid-YTW of 7.05% based on a bid of 17.20 and a limitMaturity. |
| SLF.PR.E | PerpetualDiscount | +2.9573% | Now with a pre-tax bid-YTW of 5.99% based on a bid of 18.80 and a limitMaturity. |
| Volume Highlights | |||
| Issue | Index | Volume | Notes |
| BMO.PR.J | PerpetualDiscount | 106,267 | Nesbitt crossed 100,000 at 18.80. Now with a pre-tax bid-YTW of 6.03% based on a bid of 18.81 and a limitMaturity. |
| BAM.PR.O | OpRet | 31,526 | Now with a pre-tax bid-YTW of 7.42% based on a bid of 22.85 and optionCertainty 2013-6-30. Compare with BAM.PR.H (5.90% to 2012-3-30), BAM.PR.I (5.44% to 2013-12-30) and BAM.PR.J (6.27% to 2018-3-30). Nice yield … nice volume. Could it be that the underwriters have finally found a clearing price for this issue? |
| RY.PR.G | PerpetualDiscount | 31,120 | Now with a pre-tax bid-YTW of 6.05% based on a bid of 18.77 and a limitMaturity. |
| TD.PR.R | PerpetualDiscount | 27,446 | Now with a pre-tax bid-YTW of 5.72% based on a bid of 24.75 and a limitMaturity. |
| RY.PR.C | PerpetualDiscount | 27,000 | Anonymous bought 10,000 from Nesbitt at 19.20. Now with a pre-tax bid-YTW of 6.04% based on a bid of 19.20 and a limitMaturity. |
There were twenty other index-included $25-pv-equivalent issues trading over 10,000 shares today.