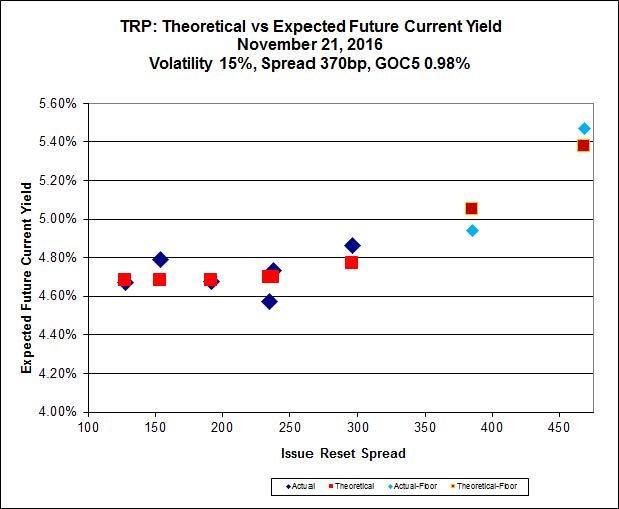
MAPF

MAPF Performance: September, 2016

Malachite Aggressive Preferred Fund’s Net Asset Value per Unit as of the close September 30, 2016, was $8.0590 after a distribution of 0.101759 per unit.

Returns to September 30, 2016
Period MAPF BMO-CM “50” Index TXPR
Total Return
CPD – according to Blackrock
One Month +0.42% -0.12% -0.10% N/A
Three Months +6.39% +4.88% +4.66% N/A
One Year +8.94% +9.05% +8.53% +7.88%
Two Years (annualized) -7.40% -6.09% -6.61% N/A
Three Years (annualized) -2.03% -2.79% -2.74% -3.14%
Four Years (annualized) -1.82% -1.98% -2.30% N/A
Five Years (annualized) +0.92% -0.35% -0.60% -1.02%
Six Years (annualized) +1.23% +0.99% +0.35%  
Seven Years (annualized) +3.16% +2.22% +1.54%  
Eight Years (annualized) +9.13% +3.19% +2.45%  
Nine Years (annualized) +7.62% +2.04% +1.23%  
Ten Years (annualized) +6.96% +1.63%    
Eleven Years (annualized) +6.87% +1.85%    
Twelve Years (annualized) +6.89% +2.12%    
Thirteen Years (annualized) +7.53% +2.34%    
Fourteen Years (annualized) +9.11% +2.69%    
Fifteen Years (annualized) +8.48% +2.50%    
MAPF returns assume reinvestment of distributions, and are shown after expenses but before fees.
CPD Returns are for the NAV and are after all fees and expenses.
Figures for National Bank Preferred Equity Income Fund (formerly Omega Preferred Equity) (which are after all fees and expenses) for 1-, 3- and 12-months are +0.04%, +4.23% and +6.71%, respectively, according to Morningstar after all fees & expenses. Three year performance is -1.09%; five year is +0.60%
Figures for Manulife Preferred Income Class Adv [into which was merged Manulife Preferred Income Fund (formerly AIC Preferred Income Fund)] (which are after all fees and expenses) for 1-, 3- and 12-months are -0.08%, +6.07% & +8.47%, respectively. It will be noted that AIC Preferred Income Fund was in existence prior to August, 2009, but long term performance figures have been suppressed.
Figures for Horizons Active Preferred Share ETF (which are after all fees and expenses) for 1-, 3- and 12-months are -0.10%, +4.83% & +9.13%, respectively. Three year performance is -1.41%, five-year is +0.72%
Figures for National Bank Preferred Equity Fund (formerly Altamira Preferred Equity Fund) are -0.31%, +4.58% and +7.89% for one-, three- and twelve months, respectively. Three year performance is -2.75%

According to the fund’s fact sheet as of June 30, 2016, the fund’s inception date was October 30, 2015. I do not know how they justify this nonsensical statement, but will assume that prior performance is being suppressed in some perfectly legal manner.

The figure for BMO S&P/TSX Laddered Preferred Share Index ETF is +6.33% for the past twelve months. Two year performance is -11.67%, three year is -6.65%.
Figures for NexGen Canadian Preferred Share Tax Managed Fund (Dividend Tax Credit Class, the best performing) are -%, +% and -% for one-, three- and twelve-months, respectively.
Figures for BMO Preferred Share Fund are +4.29% and +6.99% for the past three- and twelve-months, respectively. Three year performance is -3.23%.
Figures for PowerShares Canadian Preferred Share Index Class, Series F are +8.77% for the past twelve months. The three-year figure is -2.90%; five years is -1.29%
Figures for the First Asset Preferred Share Investment Trust (PSF.UN) are +0.11%, +2.45% and -1.67% for the past one, three and twelve months, respectively. The two-, three-, four- and five-year figures are -14.52%, -9.01%, -7.09% and -5.10%, respectively.

MAPF returns assume reinvestment of dividends, and are shown after expenses but before fees. Past performance is not a guarantee of future performance. You can lose money investing in Malachite Aggressive Preferred Fund or any other fund. For more information, see the fund’s main page. The fund is available either directly from Hymas Investment Management or through a brokerage account at Odlum Brown Limited.

Calculation of MAPF Sustainable Income Per Unit
Month NAVPU Portfolio
Average
YTW
Leverage
Divisor
Securities
Average
YTW
Capital
Gains
Multiplier
Sustainable
Income
per
current
Unit
June, 2007 9.3114 5.16% 1.03 5.01% 1.3240 0.3524
September 9.1489 5.35% 0.98 5.46% 1.3240 0.3773
December, 2007 9.0070 5.53% 0.942 5.87% 1.3240 0.3993
March, 2008 8.8512 6.17% 1.047 5.89% 1.3240 0.3938
June 8.3419 6.034% 0.952 6.338% 1.3240 $0.3993
September 8.1886 7.108% 0.969 7.335% 1.3240 $0.4537
December, 2008 8.0464 9.24% 1.008 9.166% 1.3240 $0.5571
March 2009 $8.8317 8.60% 0.995 8.802% 1.3240 $0.5872
June 10.9846 7.05% 0.999 7.057% 1.3240 $0.5855
September 12.3462 6.03% 0.998 6.042% 1.3240 $0.5634
December 2009 10.5662 5.74% 0.981 5.851% 1.1141 $0.5549
March 2010 10.2497 6.03% 0.992 6.079% 1.1141 $0.5593
June 10.5770 5.96% 0.996 5.984% 1.1141 $0.5681
September 11.3901 5.43% 0.980 5.540% 1.1141 $0.5664
December 2010 10.7659 5.37% 0.993 5.408% 1.0298 $0.5654
March, 2011 11.0560 6.00% 0.994 5.964% 1.0298 $0.6403
June 11.1194 5.87% 1.018 5.976% 1.0298 $0.6453
September 10.2709 6.10%
Note
1.001 6.106% 1.0298 $0.6090
December, 2011 10.0793 5.63%
Note
1.031 5.805% 1.0000 $0.5851
March, 2012 10.3944 5.13%
Note
0.996 5.109% 1.0000 $0.5310
June 10.2151 5.32%
Note
1.012 5.384% 1.0000 $0.5500
September 10.6703 4.61%
Note
0.997 4.624% 1.0000 $0.4934
December, 2012 10.8307 4.24% 0.989 4.287% 1.0000 $0.4643
March, 2013 10.9033 3.87% 0.996 3.886% 1.0000 $0.4237
June 10.3261 4.81% 0.998 4.80% 1.0000 $0.4957
September 10.0296 5.62% 0.996 5.643% 1.0000 $0.5660
December, 2013 9.8717 6.02% 1.008 5.972% 1.0000 $0.5895
March, 2014 10.2233 5.55% 0.998 5.561% 1.0000 $0.5685
June 10.5877 5.09% 0.998 5.100% 1.0000 $0.5395
September 10.4601 5.28% 0.997 5.296% 1.0000 $0.5540
December, 2014 10.5701 4.83% 1.009 4.787% 1.0000 $0.5060
March, 2015 9.9573 4.99% 1.001 4.985% 1.0000 $0.4964
June, 2015 9.4181 5.55% 1.002 5.539% 1.0000 $0.5217
September, 2015 7.8140 6.98% 0.999 6.987% 1.0000 $0.5460
December, 2015 8.1379 6.85% 0.997 6.871% 1.0000 $0.5592
March, 2016 7.4416 7.79% 0.998 7.805% 1.0000 $0.5808
June 7.6704 7.67% 1.011 7.587% 1.0000 $0.5819
September, 2016 8.0590 7.35% 0.993 7.402% 1.0000 $0.5965
NAVPU is shown after quarterly distributions of dividend income and annual distribution of capital gains.
Portfolio YTW includes cash (or margin borrowing), with an assumed interest rate of 0.00%
The Leverage Divisor indicates the level of cash in the account: if the portfolio is 1% in cash, the Leverage Divisor will be 0.99
Securities YTW divides “Portfolio YTW” by the “Leverage Divisor” to show the average YTW on the securities held; this assumes that the cash is invested in (or raised from) all securities held, in proportion to their holdings.
The Capital Gains Multiplier adjusts for the effects of Capital Gains Dividends. On 2009-12-31, there was a capital gains distribution of $1.989262 which is assumed for this purpose to have been reinvested at the final price of $10.5662. Thus, a holder of one unit pre-distribution would have held 1.1883 units post-distribution; the CG Multiplier reflects this to make the time-series comparable. Note that Dividend Distributions are not assumed to be reinvested.
Sustainable Income is the resultant estimate of the fund’s dividend income per current unit, before fees and expenses. Note that a “current unit” includes reinvestment of prior capital gains; a unitholder would have had the calculated sustainable income with only, say, 0.9 units in the past which, with reinvestment of capital gains, would become 1.0 current units.
DeemedRetractibles are comprised of all Straight Perpetuals (both PerpetualDiscount and PerpetualPremium) issued by BMO, BNS, CM, ELF, GWO, HSB, IAG, MFC, NA, RY, SLF and TD, which are not exchangable into common at the option of the company (definition refined in May, 2011). These issues are analyzed as if their prospectuses included a requirement to redeem at par on or prior to 2022-1-31 (banks) or 2025-1-31 (insurers and insurance holding companies), in addition to the call schedule explicitly defined. See OSFI Does Not Grandfather Extant Tier 1 Capital, CM.PR.D, CM.PR.E, CM.PR.G: Seeking NVCC Status and the January, February, March and June, 2011, editions of PrefLetter for the rationale behind this analysis.

The same reasoning is also applied to FixedResets from these issuers, other than explicitly defined NVCC from banks.

Yields for September, 2011, to January, 2012, were calculated by imposing a cap of 10% on the yields of YLO issues held, in order to avoid their extremely high calculated yields distorting the calculation and to reflect the uncertainty in the marketplace that these yields will be realized. From February to September 2012, yields on these issues have been set to zero. All YLO issues held were sold in October 2012.

These calculations were performed assuming constant contemporary GOC-5 and 3-Month Bill rates, as follows:

Canada Yields Assumed in Calculations
Month-end GOC-5 3-Month Bill
September, 2015 0.78% 0.40%
December, 2015 0.71% 0.46%
March, 2016 0.70% 0.44%
June 0.57% 0.47%
September, 2016 0.58% 0.53%

Significant positions were held in NVCC non-compliant regulated FixedReset issues on September 30, 2016; all of these currently have their yields calculated with the presumption that they will be called by the issuers at par prior to 2022-1-31 (banks) or 2025-1-31 (insurers and insurance holding companies) or on a different date (SplitShares) This presents another complication in the calculation of sustainable yield, which also assumes that redemption proceeds will be reinvested at the same rate.

I will also note that the sustainable yield calculated above is not directly comparable with any yield calculation currently reported by any other preferred share fund as far as I am aware. The Sustainable Yield depends on:
i) Calculating Yield-to-Worst for each instrument and using this yield for reporting purposes;
ii) Using the contemporary value of Five-Year Canadas to estimate dividends after reset for FixedResets. The assumption regarding the five-year Canada rate has become more important as the proportion of low-spread FixedResets in the portfolio has increased.
iii) Making the assumption that deeply discounted NVCC non-compliant issues from both banks and insurers, both Straight and FixedResets will be redeemed at par on their DeemedMaturity date as discussed above.

MAPF

MAPF Portfolio Composition: September 2016

Turnover continued to be extremely low in September, at about 2%.

There is extreme segmentation in the marketplace, with OSFI’s NVCC rule changes in February 2011 having had the effect of splitting the formerly relatively homogeneous Straight Perpetual class of preferreds into three parts:

  • Unaffected Straight Perpetuals
  • DeemedRetractibles explicitly subject to the rules (banks)
  • DeemedRetractibles considered by me, but not (yet!) by the market, to be likely to be explicitly subject to the rules in the future (insurers and insurance holding companies)

This segmentation, and the extreme valuation differences between the segments, has cut down markedly on the opportunities for trading.

To make this more clear, it used to be that there were 70-odd Straight Perpetuals and I was more or less indifferent as to which ones I owned (subject, of course, to issuer concentration concerns and other risk management factors). Thus, if any one of these 70 were to go down in price by – say – $0.25, I would quite often have something in inventory that I’d be willing to swap for it. The segmentation means that I am no longer indifferent; in addition to checking the valuation of a potential buy to other Straights, I also have to check its peer group. This cuts down on the potential for trading.

And, of course, the same segmentation has the same effect on trading opportunities between FixedReset issues.

There is no real hope that this situation will be corrected in the near-term. OSFI has indicated that the long-promised “Draft Definition of Capital” for insurers will not be issued “for public consultation in late 2012 or early 2013”, as they fear that it might encourage speculation in the marketplace. It is not clear why OSFI is so afraid of informed speculation, since the constant speculation in the marketplace is currently less informed than it would be with a little bit of regulatory clarity. While the framework has been updated, the modifications focus on the amount of capital required, not the required characteristics of that capital.

As a result of this delay, I have extended the Deemed Maturity date for insurers and insurance holding companies by three years (to 2025-1-31), in the expectation that when OSFI finally does provide clarity, they will allow the same degree of lead-in time for these companies as they did for banks. This had a major effect on the durations of preferred shares subject to the change but, fortunately, not much on their calculated yields as most of these issues were either trading near par when the change was made or were trading at sufficient premium that a par call was expected on economic grounds. However, with the declines in the market over the past nine months, the expected capital gain on redemption of the insurance-issued DeemedRetractibles has become an important component of the calculated yield.

Due to the footdragging by OSFI, I will be extending the DeemedMaturity date for insurance issues by another two years in the near future.

Sectoral distribution of the MAPF portfolio on September 30 was as follows:

MAPF Sectoral Analysis 2016-9-30
HIMI Indices Sector Weighting YTW ModDur
Ratchet 0% N/A N/A
FixFloat 0% N/A N/A
Floater 0% N/A N/A
OpRet 0% N/A N/A
SplitShare 0% N/A N/A
Interest Rearing 0% N/A N/A
PerpetualPremium 0% N/A N/A
PerpetualDiscount 10.2% 5.01% 15.44
Fixed-Reset 71.6% 7.44% 10.21
Deemed-Retractible 0% N/A N/A
FloatingReset 7.8% 10.95% 7.19
Scraps (Various) 9.7% 6.76% 13.28
Cash +0.7% 0.00% 0.00
Total 100% 7.35% 10.74
Totals and changes will not add precisely due to rounding. Cash is included in totals with duration and yield both equal to zero.
DeemedRetractibles are comprised of all Straight Perpetuals (both PerpetualDiscount and PerpetualPremium) issued by BMO, BNS, CM, ELF, GWO, HSB, IAG, MFC, NA, RY, SLF and TD, which are not exchangable into common at the option of the company. These issues are analyzed as if their prospectuses included a requirement to redeem at par on or prior to 2022-1-31 (banks) or 2025-1-3 (insurers and insurance holding companies), in addition to the call schedule explicitly defined. See OSFI Does Not Grandfather Extant Tier 1 Capital, CM.PR.D, CM.PR.E, CM.PR.G: NVCC Status Confirmed and the January, February, March and June, 2011, editions of PrefLetter for the rationale behind this analysis. (all recent editions have a short summary of the argument included in the “DeemedRetractible” section)

Note that the estimate for the time this will become effective for insurers and insurance holding companies was extended by three years in April 2013, due to the delays in OSFI’s providing clarity on the issue.

Calculations of resettable instruments are performed assuming a constant GOC-5 rate of 0.58% and a constant 3-Month Bill rate of 0.53%

The “total” reflects the un-leveraged total portfolio (i.e., cash is included in the portfolio calculations and is deemed to have a duration and yield of 0.00.). MAPF will often have relatively large cash balances, both credit and debit, to facilitate trading. Figures presented in the table have been rounded to the indicated precision.

Credit distribution is:

MAPF Credit Analysis 2016-9-30
DBRS Rating Weighting
Pfd-1 0 (0)
Pfd-1(low) 0 (0)
Pfd-2(high) 29.2%
Pfd-2 34.7%
Pfd-2(low) 25.7%
Pfd-3(high) 1.4%
Pfd-3 4.7%
Pfd-3(low) 3.0%
Pfd-4(high) 0%
Pfd-4 0%
Pfd-4(low) 0%
Pfd-5(high) 0.7%
Pfd-5 0.0%
Cash +0.7%
Totals will not add precisely due to rounding.
The fund holds a position in AZP.PR.C, which is rated P-5(high) by S&P and is unrated by DBRS
A position held in INE.PR.A is not rated by DBRS, but has been included as “Pfd-3” in the above table on the basis of its S&P rating of P-3.
A position held in BIP.PR.A is not rated by DBRS, but has been included as “Pfd-2(low)” in the above table on the basis of its S&P rating of P-2(low).

Liquidity Distribution is:

MAPF Liquidity Analysis 2016-09-30
Average Daily Trading Weighting
<$50,000 11.3%
$50,000 – $100,000 46.5%
$100,000 – $200,000 32.5%
$200,000 – $300,000 3.0%
>$300,000 6.0%
Cash +0.7%
Totals will not add precisely due to rounding.

MAPF is, of course, Malachite Aggressive Preferred Fund, a “unit trust” managed by Hymas Investment Management Inc. Further information and links to performance, audited financials and subscription information are available the fund’s web page. The fund may be purchased either directly from Hymas Investment Management or through a brokerage account at Odlum Brown Limited. A “unit trust” is like a regular mutual fund, but is sold by offering memorandum rather than prospectus. This is cheaper, but means subscription is restricted to “accredited investors” (as defined by the Ontario Securities Commission). Fund past performances are not a guarantee of future performance. You can lose money investing in MAPF or any other fund.

A similar portfolio composition analysis has been performed on the Claymore Preferred Share ETF (symbol CPD) (and other funds) as of August 31, 2012, and published in the October (mainly methodology), November (most funds), and December (ZPR) 2012, PrefLetter. While direct comparisons are difficult due to the introduction of the DeemedRetractible class of preferred share (see above) it is fair to say:

  • MAPF credit quality is better
  • MAPF liquidity is a bit lower
  • MAPF Yield is higher
  • Weightings
    • MAPF is less exposed to Straight Perpetuals (including DeemedRetractibles)
    • MAPF is less exposed to Operating Retractibles
    • MAPF is more exposed to SplitShares
    • MAPF is less exposed to FixFloat / Floater / Ratchet
    • MAPF is overweighted in FixedResets
Market Action

September 30, 2016

HIMIPref™ Preferred Indices
These values reflect the December 2008 revision of the HIMIPref™ Indices

Values are provisional and are finalized monthly
Index Mean
Current
Yield
(at bid)
Median
YTW
Median
Average
Trading
Value
Median
Mod Dur
(YTW)
Issues Day’s Perf. Index Value
Ratchet 0.00 % 0.00 % 0 0.00 0 0.1601 % 1,705.6
FixedFloater 0.00 % 0.00 % 0 0.00 0 0.1601 % 3,115.7
Floater 4.85 % 4.57 % 84,784 16.27 4 0.1601 % 1,795.6
OpRet 0.00 % 0.00 % 0 0.00 0 -0.1587 % 2,892.9
SplitShare 5.06 % 4.75 % 75,123 2.15 5 -0.1587 % 3,454.7
Interest-Bearing 0.00 % 0.00 % 0 0.00 0 -0.1587 % 2,695.5
Perpetual-Premium 5.50 % 4.63 % 64,566 1.94 12 0.0228 % 2,688.8
Perpetual-Discount 5.12 % 5.00 % 88,673 15.04 26 0.1755 % 2,923.5
FixedReset 4.92 % 4.20 % 148,214 6.98 92 0.2689 % 2,058.4
Deemed-Retractible 5.01 % 4.79 % 111,878 1.20 32 0.1268 % 2,806.2
FloatingReset 2.84 % 4.37 % 32,078 4.98 12 0.2467 % 2,207.9
Performance Highlights
Issue Index Change Notes
RY.PR.M FixedReset 1.00 % YTW SCENARIO
Maturity Type : Limit Maturity
Maturity Date : 2046-09-30
Maturity Price : 20.17
Evaluated at bid price : 20.17
Bid-YTW : 4.12 %
TD.PR.T FloatingReset 1.02 % YTW SCENARIO
Maturity Type : Hard Maturity
Maturity Date : 2022-01-31
Maturity Price : 25.00
Evaluated at bid price : 22.82
Bid-YTW : 3.95 %
BNS.PR.Q FixedReset 1.07 % YTW SCENARIO
Maturity Type : Hard Maturity
Maturity Date : 2022-01-31
Maturity Price : 25.00
Evaluated at bid price : 23.97
Bid-YTW : 3.63 %
CM.PR.Q FixedReset 1.14 % YTW SCENARIO
Maturity Type : Limit Maturity
Maturity Date : 2046-09-30
Maturity Price : 20.34
Evaluated at bid price : 20.34
Bid-YTW : 4.20 %
RY.PR.J FixedReset 1.29 % YTW SCENARIO
Maturity Type : Limit Maturity
Maturity Date : 2046-09-30
Maturity Price : 20.47
Evaluated at bid price : 20.47
Bid-YTW : 4.17 %
BIP.PR.A FixedReset 1.42 % YTW SCENARIO
Maturity Type : Limit Maturity
Maturity Date : 2046-09-30
Maturity Price : 20.74
Evaluated at bid price : 20.74
Bid-YTW : 5.11 %
FTS.PR.H FixedReset 1.59 % YTW SCENARIO
Maturity Type : Limit Maturity
Maturity Date : 2046-09-30
Maturity Price : 14.10
Evaluated at bid price : 14.10
Bid-YTW : 3.79 %
Volume Highlights
Issue Index Shares
Traded
Notes
TD.PF.H FixedReset 198,923 YTW SCENARIO
Maturity Type : Call
Maturity Date : 2021-10-31
Maturity Price : 25.00
Evaluated at bid price : 25.75
Bid-YTW : 4.31 %
BIP.PR.C FixedReset 68,011 YTW SCENARIO
Maturity Type : Call
Maturity Date : 2021-09-30
Maturity Price : 25.00
Evaluated at bid price : 25.55
Bid-YTW : 4.88 %
CM.PR.O FixedReset 53,294 YTW SCENARIO
Maturity Type : Limit Maturity
Maturity Date : 2046-09-30
Maturity Price : 18.81
Evaluated at bid price : 18.81
Bid-YTW : 4.06 %
BAM.PR.T FixedReset 42,777 YTW SCENARIO
Maturity Type : Limit Maturity
Maturity Date : 2046-09-30
Maturity Price : 15.46
Evaluated at bid price : 15.46
Bid-YTW : 4.79 %
BNS.PR.G FixedReset 42,553 YTW SCENARIO
Maturity Type : Call
Maturity Date : 2021-07-25
Maturity Price : 25.00
Evaluated at bid price : 26.70
Bid-YTW : 3.87 %
BNS.PR.H FixedReset 38,985 YTW SCENARIO
Maturity Type : Call
Maturity Date : 2022-01-26
Maturity Price : 25.00
Evaluated at bid price : 25.82
Bid-YTW : 4.22 %
There were 24 other index-included issues trading in excess of 10,000 shares.
Wide Spread Highlights
Issue Index Quote Data and Yield Notes
EML.PR.A FixedReset Quote: 26.31 – 26.75
Spot Rate : 0.4400
Average : 0.3145

YTW SCENARIO
Maturity Type : Call
Maturity Date : 2021-04-17
Maturity Price : 25.00
Evaluated at bid price : 26.31
Bid-YTW : 4.43 %

VNR.PR.A FixedReset Quote: 18.43 – 18.89
Spot Rate : 0.4600
Average : 0.3435

YTW SCENARIO
Maturity Type : Limit Maturity
Maturity Date : 2046-09-30
Maturity Price : 18.43
Evaluated at bid price : 18.43
Bid-YTW : 4.77 %

IGM.PR.B Perpetual-Premium Quote: 25.30 – 25.59
Spot Rate : 0.2900
Average : 0.1968

YTW SCENARIO
Maturity Type : Call
Maturity Date : 2018-12-31
Maturity Price : 25.00
Evaluated at bid price : 25.30
Bid-YTW : 5.13 %

ELF.PR.F Perpetual-Discount Quote: 24.72 – 25.05
Spot Rate : 0.3300
Average : 0.2501

YTW SCENARIO
Maturity Type : Limit Maturity
Maturity Date : 2046-09-30
Maturity Price : 24.49
Evaluated at bid price : 24.72
Bid-YTW : 5.37 %

BMO.PR.R FloatingReset Quote: 22.41 – 22.70
Spot Rate : 0.2900
Average : 0.2239

YTW SCENARIO
Maturity Type : Hard Maturity
Maturity Date : 2022-01-31
Maturity Price : 25.00
Evaluated at bid price : 22.41
Bid-YTW : 4.37 %

GWO.PR.G Deemed-Retractible Quote: 25.00 – 25.19
Spot Rate : 0.1900
Average : 0.1302

YTW SCENARIO
Maturity Type : Hard Maturity
Maturity Date : 2025-01-31
Maturity Price : 25.00
Evaluated at bid price : 25.00
Bid-YTW : 5.23 %

Market Action

September 29, 2016

UPS is attempting to catch up in the drone wars:

UPS, despite its decades of delivery experience, is a latecomer to the drone delivery game. Drone startup Flirtey demonstrated a ship-to-shore drone delivery of medical supplies off the coast of New Jersey earlier this summer, and drone delivery company Zipline declared its intent to delivery needed blood to rural populations in Washington State’s San Juan islands.

And it’s not just startups that are already doing delivery. Amazon’s drone program is perhaps the most famous, but Europe’s own DHL delivery giant experimented with drones in difficult mountain terrain. Chinese online retailer JD.com is also exploring drone delivery in marshy and channel-crossed provinces, where flying drones can fly easily over the car-impassible waterways. That UPS is experimenting with drone technology is more a testament to the technology’s broad appeal than any particular innovation by the company itself.

On a related note, Tyler Cowen of Bloomberg claims that technology favours suburbia:

Self-driving vehicles are also likely to help the suburbs most. One of the worst things about the suburbs is the commute to the city or to other parts of the suburbs. But what if you could read, text or watch TV – safely — during that commuting time? What if you could tackle your day’s work just as you do on a train or plane? Commuting would seem a lot less painful. As driverless vehicles evolve to accommodate work and leisure uses of the automobile space, pleasure will replace commuting stress.

What about drones? They too would seem to favor remote areas where it is harder to access useful goods and services. Drones may do more for exurbs and rural areas than for the suburbs, but it seems cities will gain least. Walking or biking to nearby shops is a potential substitute for drone delivery. Rolling sidewalk drones might find it harder to negotiate crowded cities, and cities with a dense network of tall buildings may be less friendly to flying drones. Population density may increase the risk of a drone falling on someone.

Jared Dillian writes in Forbes about the message we’re sending to the Chinese:

Shockwaves reverberated through Canada last week as the government announced that negotiations would commence on an extradition treaty between Canada and China.

Make no mistake about it–from Canada’s perspective, this has everything to do with money laundering–and the torrid housing market. In fact, supporters of the extradition treaty directly cite the inability of middle class Canadian families to buy homes that have become prohibitively expensive, due to foreign capital pouring into the country.

But Canada should really reflect on whether they want a reversal of those capital flows. History has not been kind to countries that have slammed the door shut on foreign investment. And money always goes to where it is treated best. So if Canada becomes hostile to Chinese money, it will find somewhere else to go. And I’m sure lots of countries would be happy to take it.

HIMIPref™ Preferred Indices
These values reflect the December 2008 revision of the HIMIPref™ Indices

Values are provisional and are finalized monthly
Index Mean
Current
Yield
(at bid)
Median
YTW
Median
Average
Trading
Value
Median
Mod Dur
(YTW)
Issues Day’s Perf. Index Value
Ratchet 0.00 % 0.00 % 0 0.00 0 -0.2307 % 1,702.8
FixedFloater 0.00 % 0.00 % 0 0.00 0 -0.2307 % 3,110.7
Floater 4.86 % 4.59 % 88,221 16.24 4 -0.2307 % 1,792.7
OpRet 0.00 % 0.00 % 0 0.00 0 0.1749 % 2,897.5
SplitShare 5.05 % 4.67 % 75,682 2.15 5 0.1749 % 3,460.2
Interest-Bearing 0.00 % 0.00 % 0 0.00 0 0.1749 % 2,699.8
Perpetual-Premium 5.50 % 4.63 % 64,580 1.94 12 -0.0781 % 2,688.1
Perpetual-Discount 5.13 % 5.02 % 91,923 15.08 26 0.0435 % 2,918.4
FixedReset 4.96 % 4.25 % 148,773 6.98 92 0.1850 % 2,052.8
Deemed-Retractible 5.02 % 4.52 % 111,994 1.21 32 0.0178 % 2,802.7
FloatingReset 2.84 % 4.40 % 32,262 4.97 12 0.1226 % 2,202.4
Performance Highlights
Issue Index Change Notes
ELF.PR.G Perpetual-Discount -1.82 % YTW SCENARIO
Maturity Type : Limit Maturity
Maturity Date : 2046-09-29
Maturity Price : 22.42
Evaluated at bid price : 22.68
Bid-YTW : 5.24 %
TRP.PR.F FloatingReset -1.20 % YTW SCENARIO
Maturity Type : Limit Maturity
Maturity Date : 2046-09-29
Maturity Price : 13.95
Evaluated at bid price : 13.95
Bid-YTW : 4.40 %
PWF.PR.T FixedReset 1.03 % YTW SCENARIO
Maturity Type : Limit Maturity
Maturity Date : 2046-09-29
Maturity Price : 19.59
Evaluated at bid price : 19.59
Bid-YTW : 4.02 %
BAM.PF.G FixedReset 1.04 % YTW SCENARIO
Maturity Type : Limit Maturity
Maturity Date : 2046-09-29
Maturity Price : 20.43
Evaluated at bid price : 20.43
Bid-YTW : 4.47 %
BAM.PR.R FixedReset 1.08 % YTW SCENARIO
Maturity Type : Limit Maturity
Maturity Date : 2046-09-29
Maturity Price : 15.94
Evaluated at bid price : 15.94
Bid-YTW : 4.60 %
TRP.PR.C FixedReset 1.13 % YTW SCENARIO
Maturity Type : Limit Maturity
Maturity Date : 2046-09-29
Maturity Price : 13.45
Evaluated at bid price : 13.45
Bid-YTW : 4.00 %
BAM.PF.A FixedReset 1.32 % YTW SCENARIO
Maturity Type : Limit Maturity
Maturity Date : 2046-09-29
Maturity Price : 19.25
Evaluated at bid price : 19.25
Bid-YTW : 4.69 %
BAM.PF.B FixedReset 1.61 % YTW SCENARIO
Maturity Type : Limit Maturity
Maturity Date : 2046-09-29
Maturity Price : 17.72
Evaluated at bid price : 17.72
Bid-YTW : 4.77 %
CU.PR.C FixedReset 1.69 % YTW SCENARIO
Maturity Type : Limit Maturity
Maturity Date : 2046-09-29
Maturity Price : 18.07
Evaluated at bid price : 18.07
Bid-YTW : 4.21 %
MFC.PR.F FixedReset 2.15 % YTW SCENARIO
Maturity Type : Hard Maturity
Maturity Date : 2025-01-31
Maturity Price : 25.00
Evaluated at bid price : 13.75
Bid-YTW : 10.33 %
Volume Highlights
Issue Index Shares
Traded
Notes
TD.PF.H FixedReset 299,386 YTW SCENARIO
Maturity Type : Call
Maturity Date : 2021-10-31
Maturity Price : 25.00
Evaluated at bid price : 25.75
Bid-YTW : 4.30 %
BNS.PR.H FixedReset 168,425 YTW SCENARIO
Maturity Type : Call
Maturity Date : 2022-01-26
Maturity Price : 25.00
Evaluated at bid price : 25.77
Bid-YTW : 4.26 %
BMO.PR.L Deemed-Retractible 69,657 YTW SCENARIO
Maturity Type : Call
Maturity Date : 2016-10-29
Maturity Price : 25.25
Evaluated at bid price : 25.71
Bid-YTW : -9.38 %
BNS.PR.O Deemed-Retractible 54,300 YTW SCENARIO
Maturity Type : Call
Maturity Date : 2016-10-29
Maturity Price : 25.25
Evaluated at bid price : 25.68
Bid-YTW : -4.00 %
RY.PR.R FixedReset 53,800 YTW SCENARIO
Maturity Type : Call
Maturity Date : 2021-08-24
Maturity Price : 25.00
Evaluated at bid price : 26.85
Bid-YTW : 3.98 %
RY.PR.I FixedReset 51,750 YTW SCENARIO
Maturity Type : Hard Maturity
Maturity Date : 2022-01-31
Maturity Price : 25.00
Evaluated at bid price : 24.15
Bid-YTW : 3.77 %
There were 35 other index-included issues trading in excess of 10,000 shares.
Wide Spread Highlights
Issue Index Quote Data and Yield Notes
IAG.PR.A Deemed-Retractible Quote: 23.06 – 23.50
Spot Rate : 0.4400
Average : 0.3330

YTW SCENARIO
Maturity Type : Hard Maturity
Maturity Date : 2025-01-31
Maturity Price : 25.00
Evaluated at bid price : 23.06
Bid-YTW : 5.82 %

FTS.PR.F Perpetual-Discount Quote: 24.67 – 24.95
Spot Rate : 0.2800
Average : 0.1857

YTW SCENARIO
Maturity Type : Limit Maturity
Maturity Date : 2046-09-29
Maturity Price : 24.43
Evaluated at bid price : 24.67
Bid-YTW : 5.01 %

MFC.PR.O FixedReset Quote: 26.66 – 26.91
Spot Rate : 0.2500
Average : 0.1739

YTW SCENARIO
Maturity Type : Call
Maturity Date : 2021-06-19
Maturity Price : 25.00
Evaluated at bid price : 26.66
Bid-YTW : 4.11 %

BNS.PR.E FixedReset Quote: 26.80 – 27.00
Spot Rate : 0.2000
Average : 0.1272

YTW SCENARIO
Maturity Type : Call
Maturity Date : 2021-04-25
Maturity Price : 25.00
Evaluated at bid price : 26.80
Bid-YTW : 4.02 %

BNS.PR.A FloatingReset Quote: 23.11 – 23.36
Spot Rate : 0.2500
Average : 0.1789

YTW SCENARIO
Maturity Type : Hard Maturity
Maturity Date : 2022-01-31
Maturity Price : 25.00
Evaluated at bid price : 23.11
Bid-YTW : 4.17 %

CU.PR.D Perpetual-Discount Quote: 24.56 – 24.80
Spot Rate : 0.2400
Average : 0.1739

YTW SCENARIO
Maturity Type : Limit Maturity
Maturity Date : 2046-09-29
Maturity Price : 24.08
Evaluated at bid price : 24.56
Bid-YTW : 5.02 %

Market Action

September 28, 2016

PerpetualDiscounts now yield 5.01%, equivalent to 6.51% interest at the standard equivalency factor of 1.3x. Long corporates now yield about 3.6%, so the pre-tax interest-equivalent spread (in this context, the “Seniority Spread”) is now about 290bp, unchanged from September 14.

HIMIPref™ Preferred Indices
These values reflect the December 2008 revision of the HIMIPref™ Indices

Values are provisional and are finalized monthly
Index Mean
Current
Yield
(at bid)
Median
YTW
Median
Average
Trading
Value
Median
Mod Dur
(YTW)
Issues Day’s Perf. Index Value
Ratchet 0.00 % 0.00 % 0 0.00 0 0.4995 % 1,706.8
FixedFloater 0.00 % 0.00 % 0 0.00 0 0.4995 % 3,117.9
Floater 4.85 % 4.55 % 89,473 16.32 4 0.4995 % 1,796.9
OpRet 0.00 % 0.00 % 0 0.00 0 0.3063 % 2,892.4
SplitShare 5.06 % 4.46 % 76,540 2.16 5 0.3063 % 3,454.1
Interest-Bearing 0.00 % 0.00 % 0 0.00 0 0.3063 % 2,695.1
Perpetual-Premium 5.50 % 4.64 % 65,468 1.94 12 0.1594 % 2,690.2
Perpetual-Discount 5.12 % 5.01 % 93,077 15.06 26 0.1724 % 2,917.1
FixedReset 4.97 % 4.24 % 152,550 6.98 92 0.1825 % 2,049.0
Deemed-Retractible 5.02 % 2.24 % 110,411 0.33 32 0.0827 % 2,802.2
FloatingReset 2.84 % 4.45 % 40,814 4.97 12 0.1931 % 2,199.7
Performance Highlights
Issue Index Change Notes
GRP.PR.A SplitShare 1.04 % YTW SCENARIO
Maturity Type : Call
Maturity Date : 2016-10-28
Maturity Price : 25.00
Evaluated at bid price : 25.35
Bid-YTW : -13.73 %
BAM.PR.R FixedReset 1.15 % YTW SCENARIO
Maturity Type : Limit Maturity
Maturity Date : 2046-09-28
Maturity Price : 15.77
Evaluated at bid price : 15.77
Bid-YTW : 4.65 %
FTS.PR.M FixedReset 1.19 % YTW SCENARIO
Maturity Type : Limit Maturity
Maturity Date : 2046-09-28
Maturity Price : 19.55
Evaluated at bid price : 19.55
Bid-YTW : 4.17 %
TRP.PR.C FixedReset 1.52 % YTW SCENARIO
Maturity Type : Limit Maturity
Maturity Date : 2046-09-28
Maturity Price : 13.30
Evaluated at bid price : 13.30
Bid-YTW : 4.04 %
ELF.PR.G Perpetual-Discount 1.73 % YTW SCENARIO
Maturity Type : Limit Maturity
Maturity Date : 2046-09-28
Maturity Price : 22.82
Evaluated at bid price : 23.10
Bid-YTW : 5.14 %
TRP.PR.F FloatingReset 1.95 % YTW SCENARIO
Maturity Type : Limit Maturity
Maturity Date : 2046-09-28
Maturity Price : 14.12
Evaluated at bid price : 14.12
Bid-YTW : 4.34 %
TRP.PR.H FloatingReset 2.00 % YTW SCENARIO
Maturity Type : Limit Maturity
Maturity Date : 2046-09-28
Maturity Price : 10.70
Evaluated at bid price : 10.70
Bid-YTW : 4.23 %
SLF.PR.G FixedReset 2.07 % YTW SCENARIO
Maturity Type : Hard Maturity
Maturity Date : 2025-01-31
Maturity Price : 25.00
Evaluated at bid price : 14.33
Bid-YTW : 9.76 %
Volume Highlights
Issue Index Shares
Traded
Notes
BNS.PR.N Deemed-Retractible 463,100 YTW SCENARIO
Maturity Type : Call
Maturity Date : 2017-01-27
Maturity Price : 25.00
Evaluated at bid price : 25.51
Bid-YTW : 1.61 %
W.PR.J Perpetual-Discount 302,450 YTW SCENARIO
Maturity Type : Call
Maturity Date : 2016-10-28
Maturity Price : 25.00
Evaluated at bid price : 25.00
Bid-YTW : 2.44 %
POW.PR.B Perpetual-Discount 235,518 YTW SCENARIO
Maturity Type : Call
Maturity Date : 2016-10-28
Maturity Price : 25.00
Evaluated at bid price : 25.10
Bid-YTW : -2.53 %
GWO.PR.F Deemed-Retractible 214,389 YTW SCENARIO
Maturity Type : Call
Maturity Date : 2016-10-28
Maturity Price : 25.00
Evaluated at bid price : 25.70
Bid-YTW : -26.24 %
PWF.PR.F Floater 199,860 YTW SCENARIO
Maturity Type : Limit Maturity
Maturity Date : 2046-09-28
Maturity Price : 24.68
Evaluated at bid price : 25.00
Bid-YTW : 5.32 %
PWF.PR.F Floater 199,860 YTW SCENARIO
Maturity Type : Limit Maturity
Maturity Date : 2046-09-28
Maturity Price : 24.68
Evaluated at bid price : 25.00
Bid-YTW : 5.32 %
HSB.PR.D Deemed-Retractible 177,600 YTW SCENARIO
Maturity Type : Call
Maturity Date : 2016-10-28
Maturity Price : 25.00
Evaluated at bid price : 25.05
Bid-YTW : 2.24 %
BNS.PR.H FixedReset 175,110 YTW SCENARIO
Maturity Type : Call
Maturity Date : 2022-01-26
Maturity Price : 25.00
Evaluated at bid price : 25.78
Bid-YTW : 4.25 %
BNS.PR.O Deemed-Retractible 140,047 YTW SCENARIO
Maturity Type : Call
Maturity Date : 2016-10-28
Maturity Price : 25.25
Evaluated at bid price : 25.68
Bid-YTW : -4.18 %
TD.PF.H FixedReset 117,195 YTW SCENARIO
Maturity Type : Call
Maturity Date : 2021-10-31
Maturity Price : 25.00
Evaluated at bid price : 25.75
Bid-YTW : 4.30 %
TRP.PR.J FixedReset 109,369 YTW SCENARIO
Maturity Type : Call
Maturity Date : 2021-05-31
Maturity Price : 25.00
Evaluated at bid price : 26.61
Bid-YTW : 4.10 %
FTS.PR.M FixedReset 100,235 YTW SCENARIO
Maturity Type : Limit Maturity
Maturity Date : 2046-09-28
Maturity Price : 19.55
Evaluated at bid price : 19.55
Bid-YTW : 4.17 %
There were 27 other index-included issues trading in excess of 10,000 shares.
Wide Spread Highlights
Issue Index Quote Data and Yield Notes
GRP.PR.A SplitShare Quote: 25.35 – 25.99
Spot Rate : 0.6400
Average : 0.4465

YTW SCENARIO
Maturity Type : Call
Maturity Date : 2016-10-28
Maturity Price : 25.00
Evaluated at bid price : 25.35
Bid-YTW : -13.73 %

FTS.PR.G FixedReset Quote: 17.55 – 17.95
Spot Rate : 0.4000
Average : 0.2397

YTW SCENARIO
Maturity Type : Limit Maturity
Maturity Date : 2046-09-28
Maturity Price : 17.55
Evaluated at bid price : 17.55
Bid-YTW : 4.06 %

HSB.PR.D Deemed-Retractible Quote: 25.05 – 25.36
Spot Rate : 0.3100
Average : 0.1979

YTW SCENARIO
Maturity Type : Call
Maturity Date : 2016-10-28
Maturity Price : 25.00
Evaluated at bid price : 25.05
Bid-YTW : 2.24 %

BNS.PR.D FloatingReset Quote: 19.54 – 19.88
Spot Rate : 0.3400
Average : 0.2304

YTW SCENARIO
Maturity Type : Hard Maturity
Maturity Date : 2022-01-31
Maturity Price : 25.00
Evaluated at bid price : 19.54
Bid-YTW : 6.43 %

MFC.PR.H FixedReset Quote: 21.30 – 21.58
Spot Rate : 0.2800
Average : 0.1769

YTW SCENARIO
Maturity Type : Hard Maturity
Maturity Date : 2025-01-31
Maturity Price : 25.00
Evaluated at bid price : 21.30
Bid-YTW : 6.09 %

TD.PR.Z FloatingReset Quote: 22.35 – 22.64
Spot Rate : 0.2900
Average : 0.1959

YTW SCENARIO
Maturity Type : Hard Maturity
Maturity Date : 2022-01-31
Maturity Price : 25.00
Evaluated at bid price : 22.35
Bid-YTW : 4.46 %

Market Action

September 27, 2016

Here’s a US story we probably won’t see in Canada!

In a startling development, almost unheard of outside a recession, food prices have fallen for nine straight months in the U.S. It’s the longest streak of food deflation since 1960 — with the exception of 2009, when the financial crisis was winding down. Analysts credit low oil and grain prices, as well as cutthroat competition from discounters. Consumers are winning out; grocery chains, not so much. Their margins and, in some cases, their stock prices, are taking a hit.

Eggs and beef have have grown especially inexpensive, and it isn’t only an American phenomenon: In England, Aldi recently offered its prized 8-ounce wagyu steaks from New Zealand for about $6.50 — a little more than the price of a pint of beer.

[Analyst at Wolfe Research Scott] Mushkin, who researches local markets, recently found that prices of a typical basket of grocery items in Houston, had fallen almost 5 percent over the past year.

foodPrice_160927
Click for Big
HIMIPref™ Preferred Indices
These values reflect the December 2008 revision of the HIMIPref™ Indices

Values are provisional and are finalized monthly
Index Mean
Current
Yield
(at bid)
Median
YTW
Median
Average
Trading
Value
Median
Mod Dur
(YTW)
Issues Day’s Perf. Index Value
Ratchet 0.00 % 0.00 % 0 0.00 0 0.1429 % 1,698.3
FixedFloater 0.00 % 0.00 % 0 0.00 0 0.1429 % 3,102.4
Floater 4.87 % 4.59 % 86,171 16.25 4 0.1429 % 1,787.9
OpRet 0.00 % 0.00 % 0 0.00 0 0.0953 % 2,883.6
SplitShare 5.05 % 4.59 % 77,227 2.16 5 0.0953 % 3,443.6
Interest-Bearing 0.00 % 0.00 % 0 0.00 0 0.0953 % 2,686.8
Perpetual-Premium 5.50 % 4.63 % 65,665 1.95 12 -0.0293 % 2,686.0
Perpetual-Discount 5.12 % 5.08 % 87,153 15.08 26 0.1092 % 2,912.1
FixedReset 4.98 % 4.26 % 149,058 6.98 92 -0.0016 % 2,045.3
Deemed-Retractible 5.02 % 4.85 % 111,042 0.33 32 0.0178 % 2,799.8
FloatingReset 2.85 % 4.43 % 32,492 4.97 12 0.1934 % 2,195.5
Performance Highlights
Issue Index Change Notes
BMO.PR.A FloatingReset -1.13 % YTW SCENARIO
Maturity Type : Hard Maturity
Maturity Date : 2022-01-31
Maturity Price : 25.00
Evaluated at bid price : 21.01
Bid-YTW : 5.13 %
TRP.PR.C FixedReset -1.05 % YTW SCENARIO
Maturity Type : Limit Maturity
Maturity Date : 2046-09-27
Maturity Price : 13.24
Evaluated at bid price : 13.24
Bid-YTW : 4.12 %
W.PR.K FixedReset 1.55 % YTW SCENARIO
Maturity Type : Call
Maturity Date : 2021-01-15
Maturity Price : 25.00
Evaluated at bid price : 26.17
Bid-YTW : 4.34 %
Volume Highlights
Issue Index Shares
Traded
Notes
BNS.PR.H FixedReset 305,167 YTW SCENARIO
Maturity Type : Call
Maturity Date : 2022-01-26
Maturity Price : 25.00
Evaluated at bid price : 25.60
Bid-YTW : 4.40 %
RY.PR.L FixedReset 92,319 YTW SCENARIO
Maturity Type : Hard Maturity
Maturity Date : 2022-01-31
Maturity Price : 25.00
Evaluated at bid price : 25.08
Bid-YTW : 3.75 %
W.PR.M FixedReset 57,560 YTW SCENARIO
Maturity Type : Call
Maturity Date : 2021-10-15
Maturity Price : 25.00
Evaluated at bid price : 25.85
Bid-YTW : 4.56 %
BMO.PR.S FixedReset 54,230 YTW SCENARIO
Maturity Type : Limit Maturity
Maturity Date : 2046-09-27
Maturity Price : 19.26
Evaluated at bid price : 19.26
Bid-YTW : 4.01 %
TD.PF.H FixedReset 52,355 YTW SCENARIO
Maturity Type : Call
Maturity Date : 2021-10-31
Maturity Price : 25.00
Evaluated at bid price : 25.52
Bid-YTW : 4.50 %
HSB.PR.C Deemed-Retractible 42,100 YTW SCENARIO
Maturity Type : Call
Maturity Date : 2016-10-27
Maturity Price : 25.00
Evaluated at bid price : 24.99
Bid-YTW : 5.13 %
There were 37 other index-included issues trading in excess of 10,000 shares.
Wide Spread Highlights
Issue Index Quote Data and Yield Notes
FTS.PR.M FixedReset Quote: 19.32 – 19.65
Spot Rate : 0.3300
Average : 0.2061

YTW SCENARIO
Maturity Type : Limit Maturity
Maturity Date : 2046-09-27
Maturity Price : 19.32
Evaluated at bid price : 19.32
Bid-YTW : 4.22 %

GWO.PR.N FixedReset Quote: 14.27 – 14.58
Spot Rate : 0.3100
Average : 0.2047

YTW SCENARIO
Maturity Type : Hard Maturity
Maturity Date : 2025-01-31
Maturity Price : 25.00
Evaluated at bid price : 14.27
Bid-YTW : 9.71 %

SLF.PR.G FixedReset Quote: 14.04 – 14.45
Spot Rate : 0.4100
Average : 0.3078

YTW SCENARIO
Maturity Type : Hard Maturity
Maturity Date : 2025-01-31
Maturity Price : 25.00
Evaluated at bid price : 14.04
Bid-YTW : 10.05 %

BAM.PR.K Floater Quote: 10.35 – 10.60
Spot Rate : 0.2500
Average : 0.1592

YTW SCENARIO
Maturity Type : Limit Maturity
Maturity Date : 2046-09-27
Maturity Price : 10.35
Evaluated at bid price : 10.35
Bid-YTW : 4.57 %

TRP.PR.G FixedReset Quote: 20.27 – 20.65
Spot Rate : 0.3800
Average : 0.2983

YTW SCENARIO
Maturity Type : Limit Maturity
Maturity Date : 2046-09-27
Maturity Price : 20.27
Evaluated at bid price : 20.27
Bid-YTW : 4.48 %

GWO.PR.L Deemed-Retractible Quote: 25.35 – 25.64
Spot Rate : 0.2900
Average : 0.2089

YTW SCENARIO
Maturity Type : Call
Maturity Date : 2017-12-31
Maturity Price : 25.25
Evaluated at bid price : 25.35
Bid-YTW : 5.27 %

Market Action

September 26, 2016

Mark Gilbert of Bloomberg writes about his experience playing a game published by the Fed:

The San Francisco branch of the Federal Reserve has a game on its website that lets you play at being Chair of the Federal Reserve. After tinkering with it, I’ve come to some conclusions: Modeling the economy is a mug’s game, short-term interest rates are a poor tool for steering the economy, and I should never be given the job of running a central bank.

The website sets out the objectives:

Your job is to set monetary policy to achieve full employment and low price inflation. Your term will last four years (16 quarters). Keep unemployment close to its natural rate of 5 percent. Keep inflation near the Fed’s 2 percent inflation target. Pay attention to the headlines for information about the economy.

Here’s how I did:

ChairtheFedGame_160926
Click for Big
HIMIPref™ Preferred Indices
These values reflect the December 2008 revision of the HIMIPref™ Indices

Values are provisional and are finalized monthly
Index Mean
Current
Yield
(at bid)
Median
YTW
Median
Average
Trading
Value
Median
Mod Dur
(YTW)
Issues Day’s Perf. Index Value
Ratchet 0.00 % 0.00 % 0 0.00 0 -0.1783 % 1,695.9
FixedFloater 0.00 % 0.00 % 0 0.00 0 -0.1783 % 3,098.0
Floater 4.88 % 4.62 % 87,257 16.20 4 -0.1783 % 1,785.4
OpRet 0.00 % 0.00 % 0 0.00 0 0.0000 % 2,880.8
SplitShare 5.05 % 4.67 % 80,091 2.16 5 0.0000 % 3,440.3
Interest-Bearing 0.00 % 0.00 % 0 0.00 0 0.0000 % 2,684.3
Perpetual-Premium 5.50 % 4.65 % 62,963 1.95 12 0.0098 % 2,686.7
Perpetual-Discount 5.13 % 5.13 % 87,257 15.00 26 0.0934 % 2,908.9
FixedReset 4.98 % 4.27 % 148,525 6.98 92 0.1106 % 2,045.3
Deemed-Retractible 5.02 % 4.77 % 112,122 1.21 32 0.0789 % 2,799.3
FloatingReset 2.86 % 4.47 % 32,969 4.97 12 -0.1054 % 2,191.3
Performance Highlights
Issue Index Change Notes
TRP.PR.G FixedReset -1.17 % YTW SCENARIO
Maturity Type : Limit Maturity
Maturity Date : 2046-09-26
Maturity Price : 20.26
Evaluated at bid price : 20.26
Bid-YTW : 4.48 %
BAM.PR.T FixedReset -1.03 % YTW SCENARIO
Maturity Type : Limit Maturity
Maturity Date : 2046-09-26
Maturity Price : 15.38
Evaluated at bid price : 15.38
Bid-YTW : 4.81 %
TRP.PR.C FixedReset 1.13 % YTW SCENARIO
Maturity Type : Limit Maturity
Maturity Date : 2046-09-26
Maturity Price : 13.38
Evaluated at bid price : 13.38
Bid-YTW : 4.08 %
NA.PR.Q FixedReset 1.14 % YTW SCENARIO
Maturity Type : Hard Maturity
Maturity Date : 2022-01-31
Maturity Price : 25.00
Evaluated at bid price : 23.90
Bid-YTW : 4.22 %
BMO.PR.Q FixedReset 1.46 % YTW SCENARIO
Maturity Type : Hard Maturity
Maturity Date : 2022-01-31
Maturity Price : 25.00
Evaluated at bid price : 20.15
Bid-YTW : 6.16 %
Volume Highlights
Issue Index Shares
Traded
Notes
BNS.PR.H FixedReset 233,115 YTW SCENARIO
Maturity Type : Call
Maturity Date : 2022-01-26
Maturity Price : 25.00
Evaluated at bid price : 25.51
Bid-YTW : 4.47 %
MFC.PR.G FixedReset 65,768 YTW SCENARIO
Maturity Type : Hard Maturity
Maturity Date : 2025-01-31
Maturity Price : 25.00
Evaluated at bid price : 19.76
Bid-YTW : 6.87 %
CM.PR.Q FixedReset 43,100 YTW SCENARIO
Maturity Type : Limit Maturity
Maturity Date : 2046-09-26
Maturity Price : 20.02
Evaluated at bid price : 20.02
Bid-YTW : 4.27 %
TRP.PR.E FixedReset 40,516 YTW SCENARIO
Maturity Type : Limit Maturity
Maturity Date : 2046-09-26
Maturity Price : 18.73
Evaluated at bid price : 18.73
Bid-YTW : 4.27 %
TRP.PR.J FixedReset 37,100 YTW SCENARIO
Maturity Type : Call
Maturity Date : 2021-05-31
Maturity Price : 25.00
Evaluated at bid price : 26.59
Bid-YTW : 4.11 %
BNS.PR.O Deemed-Retractible 36,560 YTW SCENARIO
Maturity Type : Call
Maturity Date : 2016-10-26
Maturity Price : 25.25
Evaluated at bid price : 25.61
Bid-YTW : -1.26 %
There were 29 other index-included issues trading in excess of 10,000 shares.
Wide Spread Highlights
Issue Index Quote Data and Yield Notes
IFC.PR.A FixedReset Quote: 15.34 – 15.63
Spot Rate : 0.2900
Average : 0.1960

YTW SCENARIO
Maturity Type : Hard Maturity
Maturity Date : 2025-01-31
Maturity Price : 25.00
Evaluated at bid price : 15.34
Bid-YTW : 9.55 %

RY.PR.M FixedReset Quote: 20.00 – 20.26
Spot Rate : 0.2600
Average : 0.1800

YTW SCENARIO
Maturity Type : Limit Maturity
Maturity Date : 2046-09-26
Maturity Price : 20.00
Evaluated at bid price : 20.00
Bid-YTW : 4.15 %

HSE.PR.A FixedReset Quote: 11.88 – 12.14
Spot Rate : 0.2600
Average : 0.1946

YTW SCENARIO
Maturity Type : Limit Maturity
Maturity Date : 2046-09-26
Maturity Price : 11.88
Evaluated at bid price : 11.88
Bid-YTW : 4.94 %

POW.PR.G Perpetual-Premium Quote: 25.64 – 25.84
Spot Rate : 0.2000
Average : 0.1348

YTW SCENARIO
Maturity Type : Call
Maturity Date : 2021-04-15
Maturity Price : 25.00
Evaluated at bid price : 25.64
Bid-YTW : 4.93 %

VNR.PR.A FixedReset Quote: 18.36 – 18.70
Spot Rate : 0.3400
Average : 0.2801

YTW SCENARIO
Maturity Type : Limit Maturity
Maturity Date : 2046-09-26
Maturity Price : 18.36
Evaluated at bid price : 18.36
Bid-YTW : 4.79 %

HSE.PR.C FixedReset Quote: 19.15 – 19.42
Spot Rate : 0.2700
Average : 0.2122

YTW SCENARIO
Maturity Type : Limit Maturity
Maturity Date : 2046-09-26
Maturity Price : 19.15
Evaluated at bid price : 19.15
Bid-YTW : 5.07 %

Market Action

September 23, 2016

HIMIPref™ Preferred Indices
These values reflect the December 2008 revision of the HIMIPref™ Indices

Values are provisional and are finalized monthly
Index Mean
Current
Yield
(at bid)
Median
YTW
Median
Average
Trading
Value
Median
Mod Dur
(YTW)
Issues Day’s Perf. Index Value
Ratchet 0.00 % 0.00 % 0 0.00 0 -0.4968 % 1,698.9
FixedFloater 0.00 % 0.00 % 0 0.00 0 -0.4968 % 3,103.5
Floater 4.87 % 4.60 % 90,578 16.24 4 -0.4968 % 1,788.6
OpRet 0.00 % 0.00 % 0 0.00 0 -0.0159 % 2,880.8
SplitShare 5.05 % 4.73 % 81,363 2.17 5 -0.0159 % 3,440.3
Interest-Bearing 0.00 % 0.00 % 0 0.00 0 -0.0159 % 2,684.3
Perpetual-Premium 5.50 % 4.61 % 66,703 1.96 12 0.0098 % 2,686.5
Perpetual-Discount 5.13 % 5.14 % 87,017 15.01 26 0.0127 % 2,906.2
FixedReset 4.98 % 4.46 % 149,265 6.94 92 0.0150 % 2,043.1
Deemed-Retractible 5.03 % 4.91 % 112,929 4.66 32 -0.0038 % 2,797.1
FloatingReset 2.85 % 4.47 % 33,004 4.98 12 -0.4024 % 2,193.6
Performance Highlights
Issue Index Change Notes
TRP.PR.F FloatingReset -2.21 % YTW SCENARIO
Maturity Type : Limit Maturity
Maturity Date : 2046-09-23
Maturity Price : 13.71
Evaluated at bid price : 13.71
Bid-YTW : 4.47 %
TRP.PR.H FloatingReset -1.51 % YTW SCENARIO
Maturity Type : Limit Maturity
Maturity Date : 2046-09-23
Maturity Price : 10.47
Evaluated at bid price : 10.47
Bid-YTW : 4.32 %
PWF.PR.T FixedReset -1.46 % YTW SCENARIO
Maturity Type : Limit Maturity
Maturity Date : 2046-09-23
Maturity Price : 19.61
Evaluated at bid price : 19.61
Bid-YTW : 4.19 %
BMO.PR.A FloatingReset -1.16 % YTW SCENARIO
Maturity Type : Hard Maturity
Maturity Date : 2022-01-31
Maturity Price : 25.00
Evaluated at bid price : 21.25
Bid-YTW : 4.89 %
BAM.PR.B Floater -1.05 % YTW SCENARIO
Maturity Type : Limit Maturity
Maturity Date : 2046-09-23
Maturity Price : 10.37
Evaluated at bid price : 10.37
Bid-YTW : 4.56 %
BIP.PR.B FixedReset 1.15 % YTW SCENARIO
Maturity Type : Call
Maturity Date : 2020-12-31
Maturity Price : 25.00
Evaluated at bid price : 25.59
Bid-YTW : 4.89 %
VNR.PR.A FixedReset 1.65 % YTW SCENARIO
Maturity Type : Limit Maturity
Maturity Date : 2046-09-23
Maturity Price : 18.50
Evaluated at bid price : 18.50
Bid-YTW : 4.94 %
Volume Highlights
Issue Index Shares
Traded
Notes
BNS.PR.H FixedReset 214,830 YTW SCENARIO
Maturity Type : Call
Maturity Date : 2022-01-26
Maturity Price : 25.00
Evaluated at bid price : 25.48
Bid-YTW : 4.49 %
TD.PF.H FixedReset 213,511 YTW SCENARIO
Maturity Type : Call
Maturity Date : 2021-10-31
Maturity Price : 25.00
Evaluated at bid price : 25.45
Bid-YTW : 4.55 %
NA.PR.W FixedReset 126,350 YTW SCENARIO
Maturity Type : Limit Maturity
Maturity Date : 2046-09-23
Maturity Price : 18.20
Evaluated at bid price : 18.20
Bid-YTW : 4.37 %
RY.PR.Z FixedReset 55,250 YTW SCENARIO
Maturity Type : Limit Maturity
Maturity Date : 2046-09-23
Maturity Price : 18.90
Evaluated at bid price : 18.90
Bid-YTW : 4.12 %
PWF.PR.T FixedReset 51,950 YTW SCENARIO
Maturity Type : Limit Maturity
Maturity Date : 2046-09-23
Maturity Price : 19.61
Evaluated at bid price : 19.61
Bid-YTW : 4.19 %
BAM.PF.D Perpetual-Discount 43,000 YTW SCENARIO
Maturity Type : Limit Maturity
Maturity Date : 2046-09-23
Maturity Price : 23.01
Evaluated at bid price : 23.36
Bid-YTW : 5.25 %
There were 35 other index-included issues trading in excess of 10,000 shares.
Wide Spread Highlights
Issue Index Quote Data and Yield Notes
NA.PR.W FixedReset Quote: 18.20 – 18.48
Spot Rate : 0.2800
Average : 0.1765

YTW SCENARIO
Maturity Type : Limit Maturity
Maturity Date : 2046-09-23
Maturity Price : 18.20
Evaluated at bid price : 18.20
Bid-YTW : 4.37 %

BMO.PR.A FloatingReset Quote: 21.25 – 21.90
Spot Rate : 0.6500
Average : 0.5564

YTW SCENARIO
Maturity Type : Hard Maturity
Maturity Date : 2022-01-31
Maturity Price : 25.00
Evaluated at bid price : 21.25
Bid-YTW : 4.89 %

GWO.PR.M Deemed-Retractible Quote: 25.92 – 26.25
Spot Rate : 0.3300
Average : 0.2479

YTW SCENARIO
Maturity Type : Call
Maturity Date : 2016-10-23
Maturity Price : 25.75
Evaluated at bid price : 25.92
Bid-YTW : -3.67 %

BAM.PF.H FixedReset Quote: 26.74 – 26.99
Spot Rate : 0.2500
Average : 0.1734

YTW SCENARIO
Maturity Type : Call
Maturity Date : 2020-12-31
Maturity Price : 25.00
Evaluated at bid price : 26.74
Bid-YTW : 3.24 %

W.PR.K FixedReset Quote: 25.69 – 26.07
Spot Rate : 0.3800
Average : 0.3048

YTW SCENARIO
Maturity Type : Call
Maturity Date : 2021-01-15
Maturity Price : 25.00
Evaluated at bid price : 25.69
Bid-YTW : 4.82 %

HSE.PR.G FixedReset Quote: 21.05 – 21.33
Spot Rate : 0.2800
Average : 0.2125

YTW SCENARIO
Maturity Type : Limit Maturity
Maturity Date : 2046-09-23
Maturity Price : 21.05
Evaluated at bid price : 21.05
Bid-YTW : 5.16 %

Issue Comments

BBD Downgraded to P-5(low) by S&P

S&P Global Ratings has announced:

  • •Bombardier Inc. has cut its 2016 delivery forecast for the C-Series due to jet engine delivery delays by Pratt & Whitney.
  • •In addition, the business and commercial jet portfolios continue to be pressured due to softer end markets, leading us to revise the business risk profile to weak from fair.
  • •As a result, we are lowering our long-term corporate credit and issue ratings on Bombardier to ‘B-‘ from ‘B’.
  • •We are lowering our global scale and Canada scale ratings on the company’s preferred stock to ‘CCC-‘ and ‘P-5(Low)’
  • •The stable outlook reflects our view that the company’s liquidity provides significant financial flexibility to cover cash flow deficits and any unexpected underperformance through 2017.


“The downgrade primarily reflects our view of the company’s increased sensitivity to protracted weakness in its end markets and future delays to its C-Series program,” said S&P Global Ratings credit analyst Aniki Saha-Yannopoulos.

The ratings on Bombardier reflect what we view as the company’s weak business risk profile and highly leveraged financial risk profile. Our ratings take into consideration the company’s competitive market position in the transportation and business aircraft segments, as well as Bombardier’s product diversity. These positives are offset, in part we believe, by the continued risk associated with Bombardier’s production ramp-up of the C-Series jet, high leverage, weakness in the business jet space, and declining cash flow from both the aerospace and transportation divisions.

The stable outlook reflects our view that even though the company faces multiple risks, it has ample liquidity resources to manage its operations.

The most recent news regarding Bombardier’s core competency is:

Canadian government officials should “make up their minds” on a financial aid request by struggling aircraft maker Bombardier Inc., Quebec Finance Minister Carlos Leitao says.

Quebec announced an aid package for the C Series program late last year, which helped stabilize the Montreal-based company and allowed it to secure sales for the jet, Mr. Leitao said at the Bloomberg Canadian Fixed Income Conference in New York. Quebec finalized the deal in June.

Bombardier also sought federal help late last year, though Prime Minister Justin Trudeau’s government has since sought corporate-governance concessions in exchange for any aid package. Bombardier and the federal government remain locked in a standoff over the matter. Mr. Leitao says federal funding would allow the company to start developing new products.

Philip Proulx, a spokesman for federal Innovation Minister Navdeep Bains, who is leading talks with Bombardier on behalf of Mr. Trudeau’s government, declined to comment directly on whether a decision on the aid request is imminent.

“We want to be part of the solution to help set the company up for long term success,” Mr. Proulx said by e-mail. “That is why we continue to be engaged with the company. For us, the priority is to ensure good quality jobs, R&D investments and head office remains in Canada.”

Affected issues are BBD.PR.B, BBD.PR.C and BBD.PR.D.

Market Action

September 22, 2016

HIMIPref™ Preferred Indices
These values reflect the December 2008 revision of the HIMIPref™ Indices

Values are provisional and are finalized monthly
Index Mean
Current
Yield
(at bid)
Median
YTW
Median
Average
Trading
Value
Median
Mod Dur
(YTW)
Issues Day’s Perf. Index Value
Ratchet 0.00 % 0.00 % 0 0.00 0 0.5351 % 1,707.4
FixedFloater 0.00 % 0.00 % 0 0.00 0 0.5351 % 3,119.0
Floater 4.84 % 4.56 % 91,709 16.32 4 0.5351 % 1,797.5
OpRet 0.00 % 0.00 % 0 0.00 0 -0.0238 % 2,881.3
SplitShare 5.05 % 4.69 % 81,472 2.17 5 -0.0238 % 3,440.9
Interest-Bearing 0.00 % 0.00 % 0 0.00 0 -0.0238 % 2,684.7
Perpetual-Premium 5.50 % 4.59 % 63,232 1.06 12 0.0553 % 2,686.2
Perpetual-Discount 5.13 % 5.15 % 89,860 14.99 26 0.0285 % 2,905.9
FixedReset 4.98 % 4.43 % 146,346 6.94 92 -0.0723 % 2,042.8
Deemed-Retractible 5.03 % 4.50 % 111,455 3.20 32 0.0318 % 2,797.2
FloatingReset 2.84 % 4.37 % 33,451 4.99 12 -0.0481 % 2,202.4
Performance Highlights
Issue Index Change Notes
PWF.PR.T FixedReset -1.49 % YTW SCENARIO
Maturity Type : Limit Maturity
Maturity Date : 2046-09-22
Maturity Price : 19.90
Evaluated at bid price : 19.90
Bid-YTW : 4.12 %
PWF.PR.P FixedReset -1.28 % YTW SCENARIO
Maturity Type : Limit Maturity
Maturity Date : 2046-09-22
Maturity Price : 13.15
Evaluated at bid price : 13.15
Bid-YTW : 4.48 %
BAM.PR.T FixedReset -1.15 % YTW SCENARIO
Maturity Type : Limit Maturity
Maturity Date : 2046-09-22
Maturity Price : 15.47
Evaluated at bid price : 15.47
Bid-YTW : 5.02 %
VNR.PR.A FixedReset -1.09 % YTW SCENARIO
Maturity Type : Limit Maturity
Maturity Date : 2046-09-22
Maturity Price : 18.20
Evaluated at bid price : 18.20
Bid-YTW : 5.03 %
CM.PR.Q FixedReset -1.08 % YTW SCENARIO
Maturity Type : Limit Maturity
Maturity Date : 2046-09-22
Maturity Price : 20.08
Evaluated at bid price : 20.08
Bid-YTW : 4.47 %
BAM.PR.R FixedReset -1.08 % YTW SCENARIO
Maturity Type : Limit Maturity
Maturity Date : 2046-09-22
Maturity Price : 15.61
Evaluated at bid price : 15.61
Bid-YTW : 4.87 %
TRP.PR.F FloatingReset 1.01 % YTW SCENARIO
Maturity Type : Limit Maturity
Maturity Date : 2046-09-22
Maturity Price : 14.02
Evaluated at bid price : 14.02
Bid-YTW : 4.37 %
Volume Highlights
Issue Index Shares
Traded
Notes
TD.PF.H FixedReset 1,021,288 YTW SCENARIO
Maturity Type : Call
Maturity Date : 2021-10-31
Maturity Price : 25.00
Evaluated at bid price : 25.48
Bid-YTW : 4.52 %
BNS.PR.H FixedReset 137,935 YTW SCENARIO
Maturity Type : Call
Maturity Date : 2022-01-26
Maturity Price : 25.00
Evaluated at bid price : 25.47
Bid-YTW : 4.50 %
RY.PR.Z FixedReset 130,500 YTW SCENARIO
Maturity Type : Limit Maturity
Maturity Date : 2046-09-22
Maturity Price : 18.86
Evaluated at bid price : 18.86
Bid-YTW : 4.13 %
FTS.PR.J Perpetual-Discount 103,295 YTW SCENARIO
Maturity Type : Limit Maturity
Maturity Date : 2046-09-22
Maturity Price : 23.43
Evaluated at bid price : 23.90
Bid-YTW : 4.99 %
CM.PR.P FixedReset 84,200 YTW SCENARIO
Maturity Type : Limit Maturity
Maturity Date : 2046-09-22
Maturity Price : 18.42
Evaluated at bid price : 18.42
Bid-YTW : 4.30 %
SLF.PR.A Deemed-Retractible 54,213 YTW SCENARIO
Maturity Type : Hard Maturity
Maturity Date : 2025-01-31
Maturity Price : 25.00
Evaluated at bid price : 23.97
Bid-YTW : 5.39 %
There were 33 other index-included issues trading in excess of 10,000 shares.
Wide Spread Highlights
Issue Index Quote Data and Yield Notes
VNR.PR.A FixedReset Quote: 18.20 – 18.63
Spot Rate : 0.4300
Average : 0.3181

YTW SCENARIO
Maturity Type : Limit Maturity
Maturity Date : 2046-09-22
Maturity Price : 18.20
Evaluated at bid price : 18.20
Bid-YTW : 5.03 %

BMO.PR.R FloatingReset Quote: 22.50 – 22.79
Spot Rate : 0.2900
Average : 0.1890

YTW SCENARIO
Maturity Type : Hard Maturity
Maturity Date : 2022-01-31
Maturity Price : 25.00
Evaluated at bid price : 22.50
Bid-YTW : 4.27 %

SLF.PR.G FixedReset Quote: 14.10 – 14.36
Spot Rate : 0.2600
Average : 0.1711

YTW SCENARIO
Maturity Type : Hard Maturity
Maturity Date : 2025-01-31
Maturity Price : 25.00
Evaluated at bid price : 14.10
Bid-YTW : 10.07 %

MFC.PR.G FixedReset Quote: 19.65 – 19.91
Spot Rate : 0.2600
Average : 0.1838

YTW SCENARIO
Maturity Type : Hard Maturity
Maturity Date : 2025-01-31
Maturity Price : 25.00
Evaluated at bid price : 19.65
Bid-YTW : 7.12 %

TRP.PR.D FixedReset Quote: 17.90 – 18.17
Spot Rate : 0.2700
Average : 0.1943

YTW SCENARIO
Maturity Type : Limit Maturity
Maturity Date : 2046-09-22
Maturity Price : 17.90
Evaluated at bid price : 17.90
Bid-YTW : 4.59 %

PWF.PR.T FixedReset Quote: 19.90 – 20.23
Spot Rate : 0.3300
Average : 0.2603

YTW SCENARIO
Maturity Type : Limit Maturity
Maturity Date : 2046-09-22
Maturity Price : 19.90
Evaluated at bid price : 19.90
Bid-YTW : 4.12 %