RON.PR.A Grumblers Get An Ally

March 8th, 2016

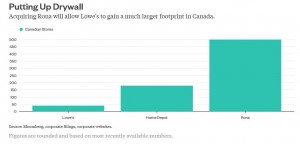
The Stirling Funds has issued an Open Letter to Lowes (LOW: NYSE) and to Rona (RON: TSX) – Lowes Bid Undervalues Rona Preferred Shares (RON.PR.A: TSX):

Lowes, a FORTUNE 50 US based multinational company with sales of over $56 billion, has come to Canada to TAKEOVER, TAKE PRIVATE, CHANGE CONTROL of Rona Inc. Why are these descriptions important? Because they mean that certain things happen: common shareholders get a “Take-Over” premium for their shares and directors and officers get paid handsomely (> $40 million) by accelerating payments that would otherwise take many years for them to receive, if at all.

Let’s consider fundamental principles of Canadian and Quebec corporate law. If Rona’s common shares are collectively worth $2.6 billion, than any higher ranking financial instrument is worth at minimum its face or par value. But that is not how the transaction has been structured and as a result retail preferred shareholders will be FORCED to accept $5 per share less than its face or par value of $25. This is OPPRESSIVE.

Moreover, the Rona Board of Directors owe a fiduciary duty of care to all stakeholders. They have addressed the common shareholders’ interests with a > 100% premium, debenture holders which stand to gain better ratings for their interests, and employees by undertaking to maintain employment, but they have failed in their fiduciary duty to preferred shareholders.

In a similar situation in Canada, RioCan REIT preferred shares with almost identical terms as the Rona preferred shares and also with a March 31, 2016 maturity are being redeemed at their par value of $25.

The Caisse de dépôt et placement du Québec, one of Canada’s pre-eminent pension fund managers, supports the deal seemingly knowing that the preferred shares are held principally by Quebec retail investors and Quebec pensioners, the very people the Caisse represents.

Recently, a Quebec-based retail investor who owns Rona preferred shares wrote to the company:

“I feel the Rona board in unanimously recommending the Lowes take-over has failed to act fairly and equitably in the interests of all stake holders and has only acted in the interest of common shareholders”… “Do not short change the small retail investor”.

As background, the Stirling Funds owns Rona preferred shares. We also own Lowes common shares and are supportive of Lowes’ strategic entry into Canada, and its takeover offer of Rona. We believe Lowes has 1) a strong, focused and highly competent management team; 2) are well positioned in their market segments; and 3) will prosper significantly as the economy continues to recover and the housing and renovation cycle normalises. We are not hostile to Lowes (in fact the opposite). Our issue lies in the deal structure. It would seem bad business for Lowes to “short-change” the very group of investors it hopes to win as customers to save a rounding error on a $2.7 billion purchase.

NEXT STEPS

To further support our efforts to seek fair remedies for the Rona preferred shareholders, the Stirling Funds has retained European-based ÖstVäst Advisory, a specialist advisor to global institutions in complex financial and security law matters.

“It is unclear why Lowes would uniquely diminish the value of the Rona preferred shareholders, while handsomely rewarding everyone else” stated Fredrik Skoglund, Partner & Head of Research of ÖstVäst Advisors. “I would assume the Quebec Securities Commission would not wish to establish precedents like this”.

PROFILES:

The Stirling Funds are value-focused investment funds based in London, England that hold a portfolio of diversified global securities principally in asset-rich companies trading at a discount to their underlying intrinsic value.

ÖstVäst Advisory, based in Stockholm Sweden is an independent, specialist global advisory firm providing client tailored financial, investment and corporate services.

SOURCE The Stirling Funds

For further information: ÖstVäst Advisory AB, Stockholm, Sweden, Fredrik Skoglund, Partner / Head of Research, +46 70 410 5165, info@ostvast.com; The Stirling Funds, London, England, Gordon Flatt, Chief Investment Officer, +44 3239 9932, info@stirling-funds.co.uk

I have not been able to find any information on the so-called Stirling Funds. Their website has been set up simply for use as a mail-drop. They’re not entirely a joke because last October they issued an Early Warning Report:

Yesterday Stirling purchased sufficient shares of Kicking Horse Energy Inc. (KCK: TSX-V) in the market on the Venture Exchange to increase its ownership to hold 7,630,000 Common Shares representing 12% issued equity.

Kicking Horse was promptly taken over at 4.75 per share, so – assuming Stirling Funds has other investments – there is some heft to the management company.

Gordon Flatt, CIO of Stirling, has made the news before in connection with Inco’s preferred shares:

A $40-million (U.S.) investment in Inco Ltd. has intensified speculation that the Canadian nickel producer is a potential takeover target.

The purchase makes Winnipeg’s Coastal Investment Inc. – run by Gordon Flatt, brother of Brascan’s Bruce Flatt – the single-biggest owner of Inco’s series E preferred shares, the market’s largest preferred issue. Coastal now owns 1.12 million shares, or 12 per cent.

In turn, we can find reference to Coastal Value Fund with respect to their redemption of CVF.PR.A in 2007 and DIV.PR.A later in that year. Bloomberg has a note:

As of February 21, 2007, Coastal Value Fund Inc has gone out of business. Coastal Value Fund Inc. is an equity mutual fund launched and managed by Coastal Corp. The fund invests in the public equity markets of Canada. It invests in the stocks of companies operating across diversified sectors. The fund primarily invests in value stocks of large cap companies. Coastal Value Fund Inc was formed on September 27, 2002 and is domiciled in Canada.

And this eventually leads to a Bloomberg data dump regarding Gordon Flatt – he’s got his thumbs in a lot of pies, although it is not immediately apparent how substantial any of them are.

I have sent an eMail to the indicated address:

Dear Mr. Flatt,

I read your press release with interest and will be reporting on it at http://www.prefblog.com later today.

Please tell me a little more about yourself and your firm. Does Stirling Funds have a functional website? What are the AUM and where may I find your historical performance numbers? Ar e you the same Gordon Flatt who has been involved with Copacabana Capital Ltd. and Coastal Value Fund Inc.?

Sincerely,

No answer yet, but it’s still early.

Anyway, Assiduous Readers will remember that my post regarding the proposed RON.PR.A arrangement sparked a fair amount of comment – by PrefBlog standards – with several commenters expressing horror at the idea of a preferred share being taken out below par and heaping me with opprobrium for suggesting it was a pretty good deal for holders.

I based that opinion on a comparison with similar issues, so I’ll take the opportunity to update prices for that list:

Ticker Issue
Reset
Spread
Bid
2016-2-3
Bid
2016-3-8
MFC.PR.J +261 17.89 17.00
RY.PR.M 262 18.45 17.70
TD.PF.D 279 19.00 18.85
SLF.PR.I 273 17.45 17.10
BAM.PF.B 263 16.46 16.88
BMO.PR.Y 271 19.35 18.56

So, given that Lowe’s is offering $20.00 for RON.PR.A with its spread of +265, it would appear that so far a good deal has simply gotten better since the announcement date. But it’s still too early to make a decision … the meeting is not until March 31 and if the preferred share market should happen to go up 10% between now and the last minute to vote … well, then, circumstances alter cases, don’t they?

Update, 2016-3-9: Barry Critchley has taken up the story:

The battle for the support of Rona’s preferred shareholders — who in the takeover by Lowe’s are being offered $20 per share, a $5 discount to the original purchase price — is set to get a little more interesting three weeks before all parties gather in Montreal to approve the transaction.

This week, and possibly as early as Thursday, more information is expected to be released about the extent of the opposition to the terms offered to the pref shareholders. “We have had lots of emails and calls from retail investors about the situation and we will be responding,” said an adviser with knowledge of what’s being planned.

Maybe the circumstances are different but there is a precedent that doesn’t look too good for Lowe’s. In early 1987, Australia’s Fosters Brewing acquired Carling O’Keefe. For some reason, it decided not to acquire the preferred shares that had been issued by Carling. Led by a brewery analyst Mike Palmer and with heavy lifting from Sheila Block of Torys, an action was brought based on improper treatment of Carling’s preferred-shareholders. In time the courts in Ontario found the conduct of the directors of the amalgamated corporation to be “oppressive” to the preference shareholders. After that ruling the pref shareholders got their proper reward.

I’ve looked it up and, while ready to be corrected, suggest that the Carling-Fosters case is irrelevant:

In Palmer v. Carling O’Keefe, Carling O’Keefe amalgamated with a company established by Elders to acquire Carling O’Keefe. The Court was asked to consider the impact of the amalgamation on the holders of the preference shares of Carling O’Keefe. The object of amalgamating the two companies was to move the debt incurred to make the acquisition into Carling O’Keefe. In order to protect the interests of the preference shareholders, sufficient funds to redeem the preference shares were set aside in a separate trust account. The Court decided that the transaction had no business purpose for Carling O’Keefe. It concluded that the transaction served the interests of the controlling shareholder and was unfairly prejudicial to, and unfairly disregarded the interests of, the preference shareholders and that the directors of Carling O’Keefe had breached their duty to act for the benefit of the corporation as a whole. The oppression remedy is discussed in greater detail in Section 7 of this part of the chapter.

In Palmer v. Carling O’Keefe, discussed above, the Court found that there was no bad faith involved in the decision to amalgamate the two companies, and that the board, composed of experienced business people acting upon independent advice, had exercised its best business judgment with respect to the transaction. The Court concluded that the impugned conduct nevertheless constituted oppression because it was unfairly prejudicial to the interests of the holders of preference shares and because it only served the interests of the controlling shareholder and not the interests of the corporation.

It seems to me that this precedent explains why the BCE preferred shares were to be redeemed in the BCE-Teachers’ deal, since in that case BCE was to be loaded up with LBO debt (see Responding to an Amalgamation Squeeze-out under the OBCA); but it doesn’t seem applicable here.

PVS.PR.A To Be Redeemed

March 8th, 2016

Partners Value Split Corp. has announced:

its intention to redeem all of its outstanding Class AA Preferred Shares, Series 1 (the “Series 1 Preferred Shares”) (TSX: PVS.PR.A) for cash on March 28, 2016 (the “Redemption Date”). The redemption price per Series 1 Preferred Share will be equal to C$25.00 plus accrued and unpaid dividends of C$0.091541 thereon to March 28, 2016, representing a total redemption price of C$25.091541 per Series 1 Preferred Share (the “Redemption Price”). Formal notice will be delivered to holders of Series 1 Preferred Shares in accordance with the terms of the Series 1 Preferred Shares.

From and after the Redemption Date the Series 1 Preferred Shares will cease to be entitled to dividends or any other participation in any distribution of the assets of the Company and the holders thereof shall not be entitled to exercise any of their other rights as shareholders in respect thereof except to receive the Redemption Price (less any tax required to be deducted and withheld by the Company). After the redemption of the Series 1 Preferred Shares, the Company will consolidate the existing capital shares held by Partners Value Investments Inc. so that there are an equal number of preferred shares and capital shares outstanding.

It will be recalled that this redemption was funded well in advance by the issue of PVS.PR.E – part funds from this issuance were used to pay a dividend to the capital unitholder.

RY.PR.R Not As Good As Expected On Good Volume

March 8th, 2016

Royal Bank of Canada has announced:

it has closed its domestic public offering of Non-Cumulative, 5-Year Rate Reset Preferred Shares Series BM. Royal Bank of Canada issued 30 million Preferred Shares Series BM at a price of $25 per share to raise gross proceeds of $750 million.

The offering was underwritten by a syndicate led by RBC Capital Markets. The Preferred Shares Series BM will commence trading on the Toronto Stock Exchange today under the ticker symbol RY.PR.R.

The Preferred Shares Series BM were issued under a prospectus supplement dated February 29, 2016 to the bank’s short form base shelf prospectus dated January 21, 2016.

RY.PR.R is a FixedReset, 5.50%+480, announced 2016-2-25. The issue will be tracked by HIMIPref™ and assigned to the FixedReset subindex.

The issue traded 1,482,632 shares today (consolidated exchanges) in a range of 25.15-27 before closing at 25.23-25, 25×70. The TXPL total return index has increased by 830bp since the announcement date, so buyers on new-issue day could have done better elsewhere!

Vital statistics are:

RY.PR.R FixedReset YTW SCENARIO
Maturity Type : Call
Maturity Date : 2021-08-24
Maturity Price : 25.00
Evaluated at bid price : 25.23
Bid-YTW : 5.34 %

Implied volatility analysis indicates the issue is expensive at its current level:

impVol_RY_160307
Click for Big

Interpretation of this chart using the standard assumptions that everything will remain the same forever leads us to believe that the new issue is a little cheap – fair value is $25.48 according to the best fit of the NVCC-compliant issues, compared to an actual bid of 25.23. Note that RY.PR.Q is indicated to be quite expensive: it resets at 453bp (less than RY.PR.R) on 2021-5-24, and is 0.71 rich at its bid of 25.52 (higher than RY.PR.R).

However, the standard assumptions are even more shaky than they usually are. Some will say that the derived value of Implied Volatility, at 24%, is far too high and may be expected to decline in the future. This will cause the theoretical curve to flatten, which implies that the higher-spread issues will outperform the lower spread issues. Some will say, however, that the fundamental assumption of non-directionality in the Black-Scholes theory is wrong; that spreads in general are far too high, will narrow, and therefore the lower-spread issues will outperform the higher-spread issues. Some, like myself, will say that both criticisms are correct but that on balance the lower-spread issues are preferable. If, for instance, you plug in a 250bp spread and 10% Implied Volatility – numbers I would consider more reflective of a normal market – you find that the four lower spread issues increase in price by over 40%, compared to the higher-spread issues, which may well go substantially above the $25 call price, but not 40% worth. Mind you, the critical part of the above analysis is “normal” … i.e., with five year Canadas yielding more than inflation and that’s just for starters! There will be some who believe that current conditions represent the new normal; these players will probably prefer the higher-spread issues.

March 7, 2015

March 8th, 2016

There’s an interesting story on Bloomberg about the invention of the ETF:

Yet, as [Nathan] Most and [Steven] Bloom were discovering at AMEX in 1988, the SEC had essentially requested the ETF’s very creation. “The theory presented was that it would be possible to create baskets of key stocks available for sale,” says David Ruder, a professor of law at Northwestern University who was SEC chairman from 1987 to 1989. “Those baskets would then be able to be sold without causing the whole market to collapse.” It was just a suggestion, Ruder says, and one the SEC didn’t expect anybody to act on. Bloom remembers another detail he and Most latched onto: He recalls the SEC indicating that if someone wanted to engineer such a product, the agency might grant approval quickly.

The AMEX team dropped everything else and dove in. “We were essentially reverse-engineering what the SEC called for in their report,” Bloom says. “We viewed it as a product proposal being made by the regulators.”

Most, who studied physics at the University of California at Los Angeles before serving as a Navy submarine engineer during World War II, ultimately found inspiration from his time in commodities—first as a trader for Pacific Vegetable Oil, then as president of the Pacific Commodities Exchange. As Most knew, commodities are typically stored in warehouses, which issue ­receipts that can then be traded. “You store a commodity and you get a warehouse receipt,” Most later recounted for ETF.com founder Jim Wiandt. “You can sell it; do a lot of things with it. Because you don’t want to be moving the merchandise back and forth all the time, so you keep it in place and you simply transfer the warehouse receipt.”

He and Bloom wondered why that same concept couldn’t be applied to a basket of equities.

It was a superb day for the Canadian preferred share market, with PerpetualDiscounts gaining 40bp, FixedResets winning 155bp and DeemedRetractibles up 51bp. The Performance Highlights table is lengthy. Volume was average.

HIMIPref™ Preferred Indices
These values reflect the December 2008 revision of the HIMIPref™ Indices

Values are provisional and are finalized monthly
Index Mean
Current
Yield
(at bid)
Median
YTW
Median
Average
Trading
Value
Median
Mod Dur
(YTW)
Issues Day’s Perf. Index Value
Ratchet 5.26 % 6.39 % 12,740 16.20 1 1.6588 % 1,490.4
FixedFloater 7.42 % 6.51 % 24,637 15.72 1 0.3135 % 2,678.7
Floater 4.50 % 4.71 % 75,114 15.94 4 1.7676 % 1,705.1
OpRet 0.00 % 0.00 % 0 0.00 0 0.0781 % 2,747.5
SplitShare 4.84 % 5.90 % 76,050 2.64 7 0.0781 % 3,215.1
Interest-Bearing 0.00 % 0.00 % 0 0.00 0 0.0781 % 2,508.6
Perpetual-Premium 5.81 % 0.60 % 75,710 0.08 6 -0.0463 % 2,539.8
Perpetual-Discount 5.70 % 5.75 % 100,640 14.24 33 0.4035 % 2,539.2
FixedReset 5.51 % 5.01 % 196,550 14.32 86 1.5516 % 1,846.5
Deemed-Retractible 5.26 % 5.51 % 113,021 5.14 34 0.5145 % 2,585.9
FloatingReset 3.08 % 4.85 % 41,543 5.46 16 1.2605 % 1,989.2
Performance Highlights
Issue Index Change Notes
PWF.PR.Q FloatingReset -2.38 % YTW SCENARIO
Maturity Type : Limit Maturity
Maturity Date : 2046-03-07
Maturity Price : 10.25
Evaluated at bid price : 10.25
Bid-YTW : 5.03 %
TD.PF.C FixedReset -1.31 % YTW SCENARIO
Maturity Type : Limit Maturity
Maturity Date : 2046-03-07
Maturity Price : 16.62
Evaluated at bid price : 16.62
Bid-YTW : 4.76 %
BNS.PR.R FixedReset 1.01 % YTW SCENARIO
Maturity Type : Hard Maturity
Maturity Date : 2022-01-31
Maturity Price : 25.00
Evaluated at bid price : 22.90
Bid-YTW : 4.99 %
HSB.PR.C Deemed-Retractible 1.02 % YTW SCENARIO
Maturity Type : Hard Maturity
Maturity Date : 2022-01-31
Maturity Price : 25.00
Evaluated at bid price : 24.76
Bid-YTW : 5.51 %
CM.PR.P FixedReset 1.02 % YTW SCENARIO
Maturity Type : Limit Maturity
Maturity Date : 2046-03-07
Maturity Price : 16.82
Evaluated at bid price : 16.82
Bid-YTW : 4.71 %
NA.PR.Q FixedReset 1.03 % YTW SCENARIO
Maturity Type : Hard Maturity
Maturity Date : 2022-01-31
Maturity Price : 25.00
Evaluated at bid price : 23.49
Bid-YTW : 4.58 %
TRP.PR.C FixedReset 1.07 % YTW SCENARIO
Maturity Type : Limit Maturity
Maturity Date : 2046-03-07
Maturity Price : 11.32
Evaluated at bid price : 11.32
Bid-YTW : 4.96 %
PWF.PR.L Perpetual-Discount 1.08 % YTW SCENARIO
Maturity Type : Limit Maturity
Maturity Date : 2046-03-07
Maturity Price : 22.21
Evaluated at bid price : 22.48
Bid-YTW : 5.74 %
BNS.PR.F FloatingReset 1.10 % YTW SCENARIO
Maturity Type : Hard Maturity
Maturity Date : 2022-01-31
Maturity Price : 25.00
Evaluated at bid price : 18.46
Bid-YTW : 7.38 %
BAM.PR.N Perpetual-Discount 1.11 % YTW SCENARIO
Maturity Type : Limit Maturity
Maturity Date : 2046-03-07
Maturity Price : 20.05
Evaluated at bid price : 20.05
Bid-YTW : 6.05 %
BAM.PF.C Perpetual-Discount 1.15 % YTW SCENARIO
Maturity Type : Limit Maturity
Maturity Date : 2046-03-07
Maturity Price : 20.22
Evaluated at bid price : 20.22
Bid-YTW : 6.12 %
PWF.PR.S Perpetual-Discount 1.18 % YTW SCENARIO
Maturity Type : Limit Maturity
Maturity Date : 2046-03-07
Maturity Price : 21.40
Evaluated at bid price : 21.40
Bid-YTW : 5.69 %
BMO.PR.Y FixedReset 1.20 % YTW SCENARIO
Maturity Type : Limit Maturity
Maturity Date : 2046-03-07
Maturity Price : 18.52
Evaluated at bid price : 18.52
Bid-YTW : 4.78 %
BNS.PR.P FixedReset 1.22 % YTW SCENARIO
Maturity Type : Hard Maturity
Maturity Date : 2022-01-31
Maturity Price : 25.00
Evaluated at bid price : 24.09
Bid-YTW : 3.76 %
HSB.PR.D Deemed-Retractible 1.23 % YTW SCENARIO
Maturity Type : Hard Maturity
Maturity Date : 2022-01-31
Maturity Price : 25.00
Evaluated at bid price : 24.61
Bid-YTW : 5.53 %
TD.PF.B FixedReset 1.24 % YTW SCENARIO
Maturity Type : Limit Maturity
Maturity Date : 2046-03-07
Maturity Price : 17.14
Evaluated at bid price : 17.14
Bid-YTW : 4.62 %
CM.PR.O FixedReset 1.29 % YTW SCENARIO
Maturity Type : Limit Maturity
Maturity Date : 2046-03-07
Maturity Price : 17.22
Evaluated at bid price : 17.22
Bid-YTW : 4.71 %
BAM.PR.K Floater 1.30 % YTW SCENARIO
Maturity Type : Limit Maturity
Maturity Date : 2046-03-07
Maturity Price : 10.13
Evaluated at bid price : 10.13
Bid-YTW : 4.73 %
BMO.PR.W FixedReset 1.31 % YTW SCENARIO
Maturity Type : Limit Maturity
Maturity Date : 2046-03-07
Maturity Price : 16.99
Evaluated at bid price : 16.99
Bid-YTW : 4.60 %
MFC.PR.C Deemed-Retractible 1.39 % YTW SCENARIO
Maturity Type : Hard Maturity
Maturity Date : 2025-01-31
Maturity Price : 25.00
Evaluated at bid price : 20.45
Bid-YTW : 7.34 %
TRP.PR.B FixedReset 1.40 % YTW SCENARIO
Maturity Type : Limit Maturity
Maturity Date : 2046-03-07
Maturity Price : 10.85
Evaluated at bid price : 10.85
Bid-YTW : 4.68 %
TD.PR.T FloatingReset 1.41 % YTW SCENARIO
Maturity Type : Hard Maturity
Maturity Date : 2022-01-31
Maturity Price : 25.00
Evaluated at bid price : 21.55
Bid-YTW : 4.72 %
PWF.PR.P FixedReset 1.41 % YTW SCENARIO
Maturity Type : Limit Maturity
Maturity Date : 2046-03-07
Maturity Price : 12.20
Evaluated at bid price : 12.20
Bid-YTW : 4.79 %
SLF.PR.I FixedReset 1.42 % YTW SCENARIO
Maturity Type : Hard Maturity
Maturity Date : 2025-01-31
Maturity Price : 25.00
Evaluated at bid price : 17.14
Bid-YTW : 8.64 %
TD.PR.Y FixedReset 1.43 % YTW SCENARIO
Maturity Type : Hard Maturity
Maturity Date : 2022-01-31
Maturity Price : 25.00
Evaluated at bid price : 23.48
Bid-YTW : 4.20 %
MFC.PR.B Deemed-Retractible 1.50 % YTW SCENARIO
Maturity Type : Hard Maturity
Maturity Date : 2025-01-31
Maturity Price : 25.00
Evaluated at bid price : 20.97
Bid-YTW : 7.14 %
CIU.PR.C FixedReset 1.51 % YTW SCENARIO
Maturity Type : Limit Maturity
Maturity Date : 2046-03-07
Maturity Price : 10.76
Evaluated at bid price : 10.76
Bid-YTW : 4.84 %
BAM.PR.M Perpetual-Discount 1.52 % YTW SCENARIO
Maturity Type : Limit Maturity
Maturity Date : 2046-03-07
Maturity Price : 20.08
Evaluated at bid price : 20.08
Bid-YTW : 6.04 %
BMO.PR.S FixedReset 1.52 % YTW SCENARIO
Maturity Type : Limit Maturity
Maturity Date : 2046-03-07
Maturity Price : 17.34
Evaluated at bid price : 17.34
Bid-YTW : 4.66 %
BMO.PR.T FixedReset 1.53 % YTW SCENARIO
Maturity Type : Limit Maturity
Maturity Date : 2046-03-07
Maturity Price : 17.26
Evaluated at bid price : 17.26
Bid-YTW : 4.56 %
IFC.PR.A FixedReset 1.54 % YTW SCENARIO
Maturity Type : Hard Maturity
Maturity Date : 2025-01-31
Maturity Price : 25.00
Evaluated at bid price : 13.83
Bid-YTW : 11.09 %
SLF.PR.D Deemed-Retractible 1.55 % YTW SCENARIO
Maturity Type : Hard Maturity
Maturity Date : 2025-01-31
Maturity Price : 25.00
Evaluated at bid price : 20.33
Bid-YTW : 7.34 %
SLF.PR.C Deemed-Retractible 1.59 % YTW SCENARIO
Maturity Type : Hard Maturity
Maturity Date : 2025-01-31
Maturity Price : 25.00
Evaluated at bid price : 20.43
Bid-YTW : 7.27 %
SLF.PR.E Deemed-Retractible 1.59 % YTW SCENARIO
Maturity Type : Hard Maturity
Maturity Date : 2025-01-31
Maturity Price : 25.00
Evaluated at bid price : 20.39
Bid-YTW : 7.35 %
SLF.PR.A Deemed-Retractible 1.64 % YTW SCENARIO
Maturity Type : Hard Maturity
Maturity Date : 2025-01-31
Maturity Price : 25.00
Evaluated at bid price : 21.68
Bid-YTW : 6.75 %
BAM.PR.E Ratchet 1.66 % YTW SCENARIO
Maturity Type : Limit Maturity
Maturity Date : 2046-03-07
Maturity Price : 25.00
Evaluated at bid price : 12.87
Bid-YTW : 6.39 %
SLF.PR.B Deemed-Retractible 1.77 % YTW SCENARIO
Maturity Type : Hard Maturity
Maturity Date : 2025-01-31
Maturity Price : 25.00
Evaluated at bid price : 21.89
Bid-YTW : 6.66 %
BAM.PR.R FixedReset 1.77 % YTW SCENARIO
Maturity Type : Limit Maturity
Maturity Date : 2046-03-07
Maturity Price : 14.40
Evaluated at bid price : 14.40
Bid-YTW : 5.41 %
BAM.PR.C Floater 1.82 % YTW SCENARIO
Maturity Type : Limit Maturity
Maturity Date : 2046-03-07
Maturity Price : 10.08
Evaluated at bid price : 10.08
Bid-YTW : 4.76 %
GWO.PR.O FloatingReset 1.82 % YTW SCENARIO
Maturity Type : Hard Maturity
Maturity Date : 2025-01-31
Maturity Price : 25.00
Evaluated at bid price : 11.20
Bid-YTW : 11.99 %
VNR.PR.A FixedReset 1.96 % YTW SCENARIO
Maturity Type : Limit Maturity
Maturity Date : 2046-03-07
Maturity Price : 17.13
Evaluated at bid price : 17.13
Bid-YTW : 5.34 %
RY.PR.H FixedReset 1.99 % YTW SCENARIO
Maturity Type : Limit Maturity
Maturity Date : 2046-03-07
Maturity Price : 17.44
Evaluated at bid price : 17.44
Bid-YTW : 4.54 %
TD.PF.D FixedReset 2.07 % YTW SCENARIO
Maturity Type : Limit Maturity
Maturity Date : 2046-03-07
Maturity Price : 18.75
Evaluated at bid price : 18.75
Bid-YTW : 4.76 %
TD.PF.A FixedReset 2.13 % YTW SCENARIO
Maturity Type : Limit Maturity
Maturity Date : 2046-03-07
Maturity Price : 17.30
Evaluated at bid price : 17.30
Bid-YTW : 4.59 %
TRP.PR.F FloatingReset 2.16 % YTW SCENARIO
Maturity Type : Limit Maturity
Maturity Date : 2046-03-07
Maturity Price : 11.85
Evaluated at bid price : 11.85
Bid-YTW : 4.97 %
BAM.PR.Z FixedReset 2.22 % YTW SCENARIO
Maturity Type : Limit Maturity
Maturity Date : 2046-03-07
Maturity Price : 18.45
Evaluated at bid price : 18.45
Bid-YTW : 5.24 %
SLF.PR.H FixedReset 2.35 % YTW SCENARIO
Maturity Type : Hard Maturity
Maturity Date : 2025-01-31
Maturity Price : 25.00
Evaluated at bid price : 15.24
Bid-YTW : 9.53 %
TD.PR.Z FloatingReset 2.43 % YTW SCENARIO
Maturity Type : Hard Maturity
Maturity Date : 2022-01-31
Maturity Price : 25.00
Evaluated at bid price : 21.52
Bid-YTW : 4.83 %
BIP.PR.A FixedReset 2.44 % YTW SCENARIO
Maturity Type : Limit Maturity
Maturity Date : 2046-03-07
Maturity Price : 18.45
Evaluated at bid price : 18.45
Bid-YTW : 5.88 %
BAM.PF.E FixedReset 2.54 % YTW SCENARIO
Maturity Type : Limit Maturity
Maturity Date : 2046-03-07
Maturity Price : 17.77
Evaluated at bid price : 17.77
Bid-YTW : 5.05 %
CM.PR.Q FixedReset 2.59 % YTW SCENARIO
Maturity Type : Limit Maturity
Maturity Date : 2046-03-07
Maturity Price : 18.62
Evaluated at bid price : 18.62
Bid-YTW : 4.79 %
MFC.PR.I FixedReset 2.64 % YTW SCENARIO
Maturity Type : Hard Maturity
Maturity Date : 2025-01-31
Maturity Price : 25.00
Evaluated at bid price : 17.87
Bid-YTW : 8.36 %
FTS.PR.M FixedReset 2.66 % YTW SCENARIO
Maturity Type : Limit Maturity
Maturity Date : 2046-03-07
Maturity Price : 16.99
Evaluated at bid price : 16.99
Bid-YTW : 5.01 %
MFC.PR.N FixedReset 2.66 % YTW SCENARIO
Maturity Type : Hard Maturity
Maturity Date : 2025-01-31
Maturity Price : 25.00
Evaluated at bid price : 17.76
Bid-YTW : 8.05 %
MFC.PR.K FixedReset 2.67 % YTW SCENARIO
Maturity Type : Hard Maturity
Maturity Date : 2025-01-31
Maturity Price : 25.00
Evaluated at bid price : 15.78
Bid-YTW : 9.47 %
NA.PR.S FixedReset 2.74 % YTW SCENARIO
Maturity Type : Limit Maturity
Maturity Date : 2046-03-07
Maturity Price : 17.22
Evaluated at bid price : 17.22
Bid-YTW : 4.81 %
GWO.PR.N FixedReset 2.79 % YTW SCENARIO
Maturity Type : Hard Maturity
Maturity Date : 2025-01-31
Maturity Price : 25.00
Evaluated at bid price : 12.90
Bid-YTW : 10.67 %
BMO.PR.R FloatingReset 2.82 % YTW SCENARIO
Maturity Type : Hard Maturity
Maturity Date : 2022-01-31
Maturity Price : 25.00
Evaluated at bid price : 21.50
Bid-YTW : 4.81 %
MFC.PR.G FixedReset 2.85 % YTW SCENARIO
Maturity Type : Hard Maturity
Maturity Date : 2025-01-31
Maturity Price : 25.00
Evaluated at bid price : 17.70
Bid-YTW : 8.42 %
IFC.PR.C FixedReset 2.89 % YTW SCENARIO
Maturity Type : Hard Maturity
Maturity Date : 2025-01-31
Maturity Price : 25.00
Evaluated at bid price : 16.40
Bid-YTW : 9.37 %
PWF.PR.A Floater 3.01 % YTW SCENARIO
Maturity Type : Limit Maturity
Maturity Date : 2046-03-07
Maturity Price : 11.64
Evaluated at bid price : 11.64
Bid-YTW : 4.09 %
FTS.PR.I FloatingReset 3.16 % YTW SCENARIO
Maturity Type : Limit Maturity
Maturity Date : 2046-03-07
Maturity Price : 9.80
Evaluated at bid price : 9.80
Bid-YTW : 4.85 %
IAG.PR.G FixedReset 3.16 % YTW SCENARIO
Maturity Type : Hard Maturity
Maturity Date : 2025-01-31
Maturity Price : 25.00
Evaluated at bid price : 17.95
Bid-YTW : 8.20 %
NA.PR.W FixedReset 3.16 % YTW SCENARIO
Maturity Type : Limit Maturity
Maturity Date : 2046-03-07
Maturity Price : 16.30
Evaluated at bid price : 16.30
Bid-YTW : 4.90 %
BAM.PF.F FixedReset 3.37 % YTW SCENARIO
Maturity Type : Limit Maturity
Maturity Date : 2046-03-07
Maturity Price : 18.71
Evaluated at bid price : 18.71
Bid-YTW : 5.12 %
MFC.PR.M FixedReset 3.41 % YTW SCENARIO
Maturity Type : Hard Maturity
Maturity Date : 2025-01-31
Maturity Price : 25.00
Evaluated at bid price : 17.88
Bid-YTW : 8.03 %
HSE.PR.C FixedReset 3.82 % YTW SCENARIO
Maturity Type : Limit Maturity
Maturity Date : 2046-03-07
Maturity Price : 15.75
Evaluated at bid price : 15.75
Bid-YTW : 6.50 %
TRP.PR.H FloatingReset 3.87 % YTW SCENARIO
Maturity Type : Limit Maturity
Maturity Date : 2046-03-07
Maturity Price : 9.40
Evaluated at bid price : 9.40
Bid-YTW : 4.57 %
MFC.PR.J FixedReset 4.18 % YTW SCENARIO
Maturity Type : Hard Maturity
Maturity Date : 2025-01-31
Maturity Price : 25.00
Evaluated at bid price : 17.45
Bid-YTW : 8.40 %
MFC.PR.H FixedReset 4.19 % YTW SCENARIO
Maturity Type : Hard Maturity
Maturity Date : 2025-01-31
Maturity Price : 25.00
Evaluated at bid price : 19.38
Bid-YTW : 7.45 %
FTS.PR.K FixedReset 4.33 % YTW SCENARIO
Maturity Type : Limit Maturity
Maturity Date : 2046-03-07
Maturity Price : 15.67
Evaluated at bid price : 15.67
Bid-YTW : 4.75 %
HSE.PR.E FixedReset 4.39 % YTW SCENARIO
Maturity Type : Limit Maturity
Maturity Date : 2046-03-07
Maturity Price : 17.60
Evaluated at bid price : 17.60
Bid-YTW : 6.29 %
CU.PR.C FixedReset 4.42 % YTW SCENARIO
Maturity Type : Limit Maturity
Maturity Date : 2046-03-07
Maturity Price : 16.55
Evaluated at bid price : 16.55
Bid-YTW : 4.81 %
HSE.PR.G FixedReset 4.82 % YTW SCENARIO
Maturity Type : Limit Maturity
Maturity Date : 2046-03-07
Maturity Price : 17.40
Evaluated at bid price : 17.40
Bid-YTW : 6.36 %
FTS.PR.G FixedReset 5.13 % YTW SCENARIO
Maturity Type : Limit Maturity
Maturity Date : 2046-03-07
Maturity Price : 15.77
Evaluated at bid price : 15.77
Bid-YTW : 4.75 %
BAM.PR.X FixedReset 5.49 % YTW SCENARIO
Maturity Type : Limit Maturity
Maturity Date : 2046-03-07
Maturity Price : 13.45
Evaluated at bid price : 13.45
Bid-YTW : 5.07 %
FTS.PR.H FixedReset 5.67 % YTW SCENARIO
Maturity Type : Limit Maturity
Maturity Date : 2046-03-07
Maturity Price : 11.75
Evaluated at bid price : 11.75
Bid-YTW : 4.79 %
BAM.PR.T FixedReset 6.43 % YTW SCENARIO
Maturity Type : Limit Maturity
Maturity Date : 2046-03-07
Maturity Price : 14.90
Evaluated at bid price : 14.90
Bid-YTW : 5.33 %
HSE.PR.A FixedReset 6.74 % YTW SCENARIO
Maturity Type : Limit Maturity
Maturity Date : 2046-03-07
Maturity Price : 9.35
Evaluated at bid price : 9.35
Bid-YTW : 6.68 %
TRP.PR.I FloatingReset 7.32 % YTW SCENARIO
Maturity Type : Limit Maturity
Maturity Date : 2046-03-07
Maturity Price : 11.00
Evaluated at bid price : 11.00
Bid-YTW : 4.48 %
Volume Highlights
Issue Index Shares
Traded
Notes
RY.PR.R FixedReset 1,482,632 YTW SCENARIO
Maturity Type : Call
Maturity Date : 2021-08-24
Maturity Price : 25.00
Evaluated at bid price : 25.23
Bid-YTW : 5.34 %
TRP.PR.C FixedReset 196,412 YTW SCENARIO
Maturity Type : Limit Maturity
Maturity Date : 2046-03-07
Maturity Price : 11.32
Evaluated at bid price : 11.32
Bid-YTW : 4.96 %
MFC.PR.O FixedReset 83,165 YTW SCENARIO
Maturity Type : Call
Maturity Date : 2021-06-19
Maturity Price : 25.00
Evaluated at bid price : 25.25
Bid-YTW : 5.46 %
TD.PF.G FixedReset 82,880 YTW SCENARIO
Maturity Type : Call
Maturity Date : 2021-04-30
Maturity Price : 25.00
Evaluated at bid price : 25.52
Bid-YTW : 5.24 %
RY.PR.Q FixedReset 80,143 YTW SCENARIO
Maturity Type : Limit Maturity
Maturity Date : 2046-03-07
Maturity Price : 23.31
Evaluated at bid price : 25.52
Bid-YTW : 5.20 %
CCS.PR.C Deemed-Retractible 71,767 YTW SCENARIO
Maturity Type : Hard Maturity
Maturity Date : 2025-01-31
Maturity Price : 25.00
Evaluated at bid price : 21.07
Bid-YTW : 7.44 %
There were 33 other index-included issues trading in excess of 10,000 shares.
Wide Spread Highlights
Issue Index Quote Data and Yield Notes
PWF.PR.Q FloatingReset Quote: 10.25 – 15.39
Spot Rate : 5.1400
Average : 3.3735

YTW SCENARIO
Maturity Type : Limit Maturity
Maturity Date : 2046-03-07
Maturity Price : 10.25
Evaluated at bid price : 10.25
Bid-YTW : 5.03 %

BAM.PR.E Ratchet Quote: 12.87 – 14.40
Spot Rate : 1.5300
Average : 0.9047

YTW SCENARIO
Maturity Type : Limit Maturity
Maturity Date : 2046-03-07
Maturity Price : 25.00
Evaluated at bid price : 12.87
Bid-YTW : 6.39 %

TD.PF.C FixedReset Quote: 16.62 – 17.47
Spot Rate : 0.8500
Average : 0.5167

YTW SCENARIO
Maturity Type : Limit Maturity
Maturity Date : 2046-03-07
Maturity Price : 16.62
Evaluated at bid price : 16.62
Bid-YTW : 4.76 %

TRP.PR.A FixedReset Quote: 14.33 – 15.60
Spot Rate : 1.2700
Average : 0.9390

YTW SCENARIO
Maturity Type : Limit Maturity
Maturity Date : 2046-03-07
Maturity Price : 14.33
Evaluated at bid price : 14.33
Bid-YTW : 4.82 %

MFC.PR.I FixedReset Quote: 17.87 – 18.45
Spot Rate : 0.5800
Average : 0.3556

YTW SCENARIO
Maturity Type : Hard Maturity
Maturity Date : 2025-01-31
Maturity Price : 25.00
Evaluated at bid price : 17.87
Bid-YTW : 8.36 %

BMO.PR.T FixedReset Quote: 17.26 – 18.03
Spot Rate : 0.7700
Average : 0.5690

YTW SCENARIO
Maturity Type : Limit Maturity
Maturity Date : 2046-03-07
Maturity Price : 17.26
Evaluated at bid price : 17.26
Bid-YTW : 4.56 %

MAPF Performance: January & February, 2016

March 7th, 2016

The fund underperformed the indices in January due to its heavy weighting in FixedResets, particularly low-spread issues, which performed very poorly. A rebound in February allowed some of the poor relative performance to be recovered.

When I wrote eMail To A Client towards the end of July, one had to go back to January, 2011, to find a starting point that would give you a positive return through the holding period. As of the end of September, the required starting point moved back again, to July month-end, 2010. The debacle of the last two months, in which the BMO-CM index lost another 12.66% has extended this period to ludicrous lengths: the total cumulative return since August 31, 2006, a period of nine-and-a-half years, is now a mere 0.73%. And note the word cumulative. I don’t mean annualized. Cumulative.

The current 114-month total cumulative return of basically zero was not exceeded during the Credit Crunch. Neither was the current 12-month total return of -22.09%, since the worst 12-month cumulative return prior to this was for the year ending November 28, 2008, for which the total return was a relatively healthy -20.93%. The discussion in eMail To A Client still applies … but more so, now!

prefCumulativeReturns_160229_114Mo
Click for Big

So why is this happening? I believe that a sudden realization that low Canada yields would be reflected in dividends of FixedResets, that started with the reset of TRP.PR.A announced in early December, 2014, turned into unreasonable fear in the spring of 2015 and escalated into blind panic. The yield of FixedResets has decoupled from the five-year Canada rate:

PL_160212_Body_Chart_18
Click for Big

This has led to a narrowing spread between PerpetualDiscounts and FixedResets:

PL_160212_App_FR_Chart_56
Click for Big
n.b.: the spread here is “interest-equivalent”

… which has put pressure on the price of PerpetualDiscounts, raising their spread to long corporate bonds to Credit Crunch proportions:

PL_160212_Body_Chart_16
Click for Big
n.b.: the spread here is “interest equivalent”

So there you have it in a nutshell! Regrettably, I am unable to predict either the timing or the degree of the correction that must happen at some point.

ZPR, is an ETF comprised of FixedResets and Floating Rate issues and a very high proportion of junk issues, returned -4.36%, -15.35% and -28.84% over the past one-, three- and twelve-month periods, respectively (according to the fund’s data), versus returns for the TXPL index of -4.44%, -15.89% and -29.18% respectively. The fund has been able to attract assets of about $1,141-million $1,272-million since inception in December 2012; AUM declineded by $131-million in January/February; given an index return of -18.5% a decline of about $235-million was expected, so there was a very significant cash inflow over the month. I feel that the flows into and out of this fund are very important in determining the performance of its constituents.

TXPR had returns over one-, three- and twelve-months of -3.64%, -11.68% and -23.18% respectively with CPD performance within expectations.

Returns for the HIMIPref™ investment grade sub-indices for the month were as follows:

HIMIPref™ Indices
Performance to February 29, 2016
Sub-Index 1-Month 3-month
Ratchet N/A N/A
FixFloat N/A N/A
Floater -6.25% -16.69%
OpRet N/A N/A
SplitShare +1.35% -0.38%
Interest N/A N/A
PerpetualPremium +0.65% -0.10%
PerpetualDiscount +0.30% -3.30%
FixedReset -5.31% -14.68%
DeemedRetractible -1.74% -2.75%
FloatingReset -5.23% -13.01%

Malachite Aggressive Preferred Fund’s Net Asset Value per Unit as of the close February 29, 2015, was $6.9056.

Returns to February 29, 2016
Period MAPF BMO-CM “50” Index TXPR
Total Return
CPD – according to Blackrock
One Month -1.85% -4.59% -3.64% N/A
Three Months -13.46% -10.71% -11.68% N/A
One Year -27.00% -22.09% -23.18% -23.37%
Two Years (annualized) -13.38% -12.27% -12.22% N/A
Three Years (annualized) -9.72% -8.61% -8.98% -9.29%
Four Years (annualized) -5.54% -5.40% -5.63% N/A
Five Years (annualized) -3.94% -3.08% -3.51% -3.93%
Six Years (annualized) -0.24% -0.76% -1.40%  
Seven Years (annualized) +6.13% +2.87% +1.91%  
Eight Years (annualized) +5.31% +0.22% -0.67%  
Nine Years (annualized) +5.11% -0.28%    
Ten Years (annualized) +5.27% +0.19%    
Eleven Years (annualized) +5.30% +0.52%    
Twelve Years (annualized) +5.62% +0.78%    
Thirteen Years (annualized) +7.35% +1.45%    
Fourteen Years (annualized) +6.88% +1.50%    
MAPF returns assume reinvestment of distributions, and are shown after expenses but before fees.
CPD Returns are for the NAV and are after all fees and expenses.
Figures for National Bank Preferred Equity Income Fund (formerly Omega Preferred Equity) (which are after all fees and expenses) for 1-, 3- and 12-months are -3.33%, -11.74% and -19.79%, respectively, according to Morningstar after all fees & expenses. Three year performance is -6.48%; five year is -2.06%
Figures for Manulife Preferred Income Class Adv [into which was merged Manulife Preferred Income Fund (formerly AIC Preferred Income Fund)] (which are after all fees and expenses) for 1-, 3- and 12-months are -4.03%, -12.19% & -24.61%, respectively. It will be noted that AIC Preferred Income Fund was in existence prior to August, 2009, but long term performance figures have been suppressed.
Figures for Horizons Active Preferred Share ETF (which are after all fees and expenses) for 1-, 3- and 12-months are -3.46%, -10.61% & -19.86%, respectively. Three year performance is -6.95%, five-year is -2.04%
Figures for National Bank Preferred Equity Fund (formerly Altamira Preferred Equity Fund) are -3.73%, -10.95% and -20.93% for one-, three- and twelve months, respectively. Three year performance is -8.69%
The figure for BMO S&P/TSX Laddered Preferred Share Index ETF is -4.36%, -15.35% and -28.84% for one-, three- and twelve-months, respectively. Two year performance is -17.71%, three year is -13.29%.
Figures for NexGen Canadian Preferred Share Tax Managed Fund (Dividend Tax Credit Class, the best performing) are -%, +% and -% for one-, three- and twelve-months, respectively.
Figures for BMO Preferred Share Fund are +% and -% for the past three- and twelve-months, respectively.
Figures for PowerShares Canadian Preferred Share Index Class, Series F are -21.74% for the past twelve months. The three-year figure is -9.12%.
Figures for the First Asset Preferred Share Investment Trust (PSF.UN) are -5.42%, -18.34% and -34.90% for the past one, three and twelve months, respectively. The two-, three-, four- and five-year figures are -19.93%, -14.67%, -10.42% and -8.25%, respectively.

MAPF returns assume reinvestment of dividends, and are shown after expenses but before fees. Past performance is not a guarantee of future performance. You can lose money investing in Malachite Aggressive Preferred Fund or any other fund. For more information, see the fund’s main page. The fund is available either directly from Hymas Investment Management or through a brokerage account at Odlum Brown Limited.

A problem that has bedevilled the market over the past four years has been the OSFI decision not to grandfather Straight Perpetuals as Tier 1 bank capital, and their continued foot-dragging regarding a decision on insurer Straight Perpetuals has segmented the market to the point where trading has become much more difficult. Until the market became so grossly segmented, there were many comparables for any given issue – but now banks are not available to swap into (because they are so expensive) and non-regulated companies are likewise deprecated (because they are not DeemedRetractibles; they should not participate in the increase in value that will follow the OSFI decision I anticipate and, in addition, are analyzed as perpetuals). The fund’s portfolio was, in effect ‘locked in’ to the low coupon DeemedRetractibles due to projected long-term gains from a future OSFI decision to the detriment of trading gains, particularly in May, 2013, when the three lowest-coupon SLF DeemedRetractibles (SLF.PR.C, SLF.PR.D and SLF.PR.E) were the worst performing DeemedRetractibles in the sub-index, and in June, 2013, when the insurance-issued DeemedRetractibles behaved like PerpetualDiscounts in a sharply negative market. Nowadays, the fund is ‘locked-in’ to the low-spread FixedResets from these companies: GWO.PR.N, MFC.PR.F, and SLF.PR.G.

In January/February, insurance DeemedRetractibles very slightly underperformed bank DeemedRetractibles:

bankInsPerf_160229_2Mo
Click for Big

… but were even with Unregulated [and bank NVCC-compliant] Straight Perpetuals…

insStraightPerf_160229_2Mo
Click for Big

Correlations were good for insurance DeemedRetractibles (27%), excellent for bank DeemedRetractibles (49%) and good for unregulated/NVCC-compliant issues (26%, not shown).

Sometimes everything works … sometimes it’s 50-50 … sometimes nothing works. The fund seeks to earn incremental return by selling liquidity (that is, taking the other side of trades that other market participants are strongly motivated to execute), which can also be referred to as ‘trading noise’ – although for quite some time, noise trading has taken a distant second place to the sectoral play on insurance DeemedRetractibles; something that dismays me, particularly given that the market does not yet agree with me regarding the insurance issues! There were a lot of strongly motivated market participants during the Panic of 2007, generating a lot of noise! Unfortunately, the conditions of the Panic may never be repeated in my lifetime … but the fund will simply attempt to make trades when swaps seem profitable, without worrying about the level of monthly turnover.

What has happened over the past year has been – obviously, now! – a very significant re-pricing of the FixedReset market. My analytical software, HIMIPref™ assumes that the market is always right when it comes to pricing asset classes; it seeks to pick off the individual issues that stray too far from the normal price. Two years ago, FixedResets were yielding so little that the system didn’t see much value even in buying the mispriced ones – the weighting of FixedResets in the September, 2013, MAPF Portfolio Composition was only 8%. However, as the market drifted lower, the cheap outliers gradually became more and more attractive, and the weighting increased from 23.4% in the September, 2014, MAPF Portfolio Composition to its current figure of 70.2% in the September, 2015, MAPF Portfolio Composition. So … too early! But who would have thought that the market would be astonished in December, 2014, that the GOC-5 yields that have been so low for years could possibly have had an effect on dividends? Regrettably, when the entire market is blind, so are quantitative systems. Still, while relative performance has been poor lately, it hasn’t been disastrous … although some clients might feel that absolute performance has been quite disastrous enough, thank you very much.

There’s plenty of room for new money left in the fund. I have shown in PrefLetter that market pricing for FixedResets is very often irrational and I have lots of confidence – backed up by my bond portfolio management experience in the markets for Canadas and Treasuries, and equity trading on the NYSE & TSX – that there is enough demand for liquidity in any market to make the effort of providing it worthwhile (although the definition of “worthwhile” in terms of basis points of outperformance changes considerably from market to market!) I will continue to exert utmost efforts to outperform but it should be borne in mind that there will almost inevitably be periods of underperformance in the future.

The yields available on high quality preferred shares remain elevated, which is reflected in the current estimate of sustainable income.

Calculation of MAPF Sustainable Income Per Unit
Month NAVPU Portfolio
Average
YTW
Leverage
Divisor
Securities
Average
YTW
Capital
Gains
Multiplier
Sustainable
Income
per
current
Unit
June, 2007 9.3114 5.16% 1.03 5.01% 1.3240 0.3524
September 9.1489 5.35% 0.98 5.46% 1.3240 0.3773
December, 2007 9.0070 5.53% 0.942 5.87% 1.3240 0.3993
March, 2008 8.8512 6.17% 1.047 5.89% 1.3240 0.3938
June 8.3419 6.034% 0.952 6.338% 1.3240 $0.3993
September 8.1886 7.108% 0.969 7.335% 1.3240 $0.4537
December, 2008 8.0464 9.24% 1.008 9.166% 1.3240 $0.5571
March 2009 $8.8317 8.60% 0.995 8.802% 1.3240 $0.5872
June 10.9846 7.05% 0.999 7.057% 1.3240 $0.5855
September 12.3462 6.03% 0.998 6.042% 1.3240 $0.5634
December 2009 10.5662 5.74% 0.981 5.851% 1.1141 $0.5549
March 2010 10.2497 6.03% 0.992 6.079% 1.1141 $0.5593
June 10.5770 5.96% 0.996 5.984% 1.1141 $0.5681
September 11.3901 5.43% 0.980 5.540% 1.1141 $0.5664
December 2010 10.7659 5.37% 0.993 5.408% 1.0298 $0.5654
March, 2011 11.0560 6.00% 0.994 5.964% 1.0298 $0.6403
June 11.1194 5.87% 1.018 5.976% 1.0298 $0.6453
September 10.2709 6.10%
Note
1.001 6.106% 1.0298 $0.6090
December, 2011 10.0793 5.63%
Note
1.031 5.805% 1.0000 $0.5851
March, 2012 10.3944 5.13%
Note
0.996 5.109% 1.0000 $0.5310
June 10.2151 5.32%
Note
1.012 5.384% 1.0000 $0.5500
September 10.6703 4.61%
Note
0.997 4.624% 1.0000 $0.4934
December, 2012 10.8307 4.24% 0.989 4.287% 1.0000 $0.4643
March, 2013 10.9033 3.87% 0.996 3.886% 1.0000 $0.4237
June 10.3261 4.81% 0.998 4.80% 1.0000 $0.4957
September 10.0296 5.62% 0.996 5.643% 1.0000 $0.5660
December, 2013 9.8717 6.02% 1.008 5.972% 1.0000 $0.5895
March, 2014 10.2233 5.55% 0.998 5.561% 1.0000 $0.5685
June 10.5877 5.09% 0.998 5.100% 1.0000 $0.5395
September 10.4601 5.28% 0.997 5.296% 1.0000 $0.5540
December, 2014 10.5701 4.83% 1.009 4.787% 1.0000 $0.5060
March, 2015 9.9573 4.99% 1.001 4.985% 1.0000 $0.4964
June, 2015 9.4181 5.55% 1.002 5.539% 1.0000 $0.5217
September, 2015 7.8140 6.98% 0.999 6.987% 1.0000 $0.5460
December, 2015 8.1379 6.85% 0.997 6.871% 1.0000 $0.5592
January, 2016 7.0359 8.34% 0.997 8.365% 1.0000 $0.5886
February, 2016 6.9056 8.44% 0.983 8.586% 1.0000 $0.5929
NAVPU is shown after quarterly distributions of dividend income and annual distribution of capital gains.
Portfolio YTW includes cash (or margin borrowing), with an assumed interest rate of 0.00%
The Leverage Divisor indicates the level of cash in the account: if the portfolio is 1% in cash, the Leverage Divisor will be 0.99
Securities YTW divides “Portfolio YTW” by the “Leverage Divisor” to show the average YTW on the securities held; this assumes that the cash is invested in (or raised from) all securities held, in proportion to their holdings.
The Capital Gains Multiplier adjusts for the effects of Capital Gains Dividends. On 2009-12-31, there was a capital gains distribution of $1.989262 which is assumed for this purpose to have been reinvested at the final price of $10.5662. Thus, a holder of one unit pre-distribution would have held 1.1883 units post-distribution; the CG Multiplier reflects this to make the time-series comparable. Note that Dividend Distributions are not assumed to be reinvested.
Sustainable Income is the resultant estimate of the fund’s dividend income per current unit, before fees and expenses. Note that a “current unit” includes reinvestment of prior capital gains; a unitholder would have had the calculated sustainable income with only, say, 0.9 units in the past which, with reinvestment of capital gains, would become 1.0 current units.
DeemedRetractibles are comprised of all Straight Perpetuals (both PerpetualDiscount and PerpetualPremium) issued by BMO, BNS, CM, ELF, GWO, HSB, IAG, MFC, NA, RY, SLF and TD, which are not exchangable into common at the option of the company (definition refined in May, 2011). These issues are analyzed as if their prospectuses included a requirement to redeem at par on or prior to 2022-1-31 (banks) or 2025-1-31 (insurers and insurance holding companies), in addition to the call schedule explicitly defined. See OSFI Does Not Grandfather Extant Tier 1 Capital, CM.PR.D, CM.PR.E, CM.PR.G: Seeking NVCC Status and the January, February, March and June, 2011, editions of PrefLetter for the rationale behind this analysis.

The same reasoning is also applied to FixedResets from these issuers, other than explicitly defined NVCC from banks.

Yields for September, 2011, to January, 2012, were calculated by imposing a cap of 10% on the yields of YLO issues held, in order to avoid their extremely high calculated yields distorting the calculation and to reflect the uncertainty in the marketplace that these yields will be realized. From February to September 2012, yields on these issues have been set to zero. All YLO issues held were sold in October 2012.
Calculations of resettable instruments are performed assuming constant contemporary GOC-5 and 3-Month Bill rates. For September 30, 2015, yields of 0.78% and 0.40%, respectively, were assumed; base rates in December, 2015, were 0.71% and 0.46%, respectively. January, 2016: 0.68% and 0.45%; February, 2016: 0.66% and 0.43%

Significant positions were held in DeemedRetractible, SplitShare and NVCC non-compliant regulated FixedReset issues on December 31; all of these currently have their yields calculated with the presumption that they will be called by the issuers at par prior to 2022-1-31 (banks) or 2025-1-31 (insurers and insurance holding companies) or on a different date (SplitShares) This presents another complication in the calculation of sustainable yield, which also assumes that redemption proceeds will be reinvested at the same rate.

I will also note that the sustainable yield calculated above is not directly comparable with any yield calculation currently reported by any other preferred share fund as far as I am aware. The Sustainable Yield depends on:
i) Calculating Yield-to-Worst for each instrument and using this yield for reporting purposes;
ii) Using the contemporary value of Five-Year Canadas to estimate dividends after reset for FixedResets. The assumption regarding the five-year Canada rate has become more important as the proportion of low-spread FixedResets in the portfolio has increased.
iii) Making the assumption that deeply discounted NVCC non-compliant issues from both banks and insurers, both Straight and FixedResets will be redeemed at par on their DeemedMaturity date as discussed above.

I no longer show calculations that assume the conversion of the entire portfolio into PerpetualDiscounts, as the fund has only a small position in these issues.

Most funds report Current Yield or Distribution Yield. For instance, ZPR reports a “Distribution Yield” of 6.19% as of January 8, 2016, but this is a meaningless number: “The most recent regular distribution (excluding year end distributions for those ETFs that distribute more frequently) annualized for frequency divided by current NAV.”. Thus, dividend cuts expected in the next five years are ignored. It’s meaningless; to discuss it in the context of portfolio reporting is misleading.

iShares reports the “12m Trailing Yield”, which is the sum of the past year’s distributions divided by the current price: meaningless. They also report the “Distribution Yield”, which has the same definition as does ZPR: meaningless.

As for MAPF … I will not attempt to mislead my customers with meaningless figures, nor will I spend the time required to bring the reporting of rinky-dink shops like BMO and Blackrock up to more professional standards. I will continue to calculate the best metric I can think of and report that to you with full explanations.

It should be noted that the concept of this Sustainable Income calculation was developed when the fund’s holdings were overwhelmingly PerpetualDiscounts – see, for instance, the bottom of the market in November 2008. It is easy to understand that for a PerpetualDiscount, the technique of multiplying yield by price will indeed result in the coupon – a PerpetualDiscount paying $1 annually will show a Sustainable Income of $1, regardless of whether the price is $24 or $17.

Things are not quite so neat when maturity dates and maturity prices that are different from the current price are thrown into the mix. If we take a notional Straight Perpetual paying $5 annually, the price is $100 when the yield is 5% (all this ignores option effects). As the yield increases to 6%, the price declines to 83.33; and 83.33 x 6% is the same $5. Good enough.

But a ten year bond, priced at 100 when the yield is equal to its coupon of 5%, will decline in price to 92.56; and 92.56 x 6% is 5.55; thus, the calculated Sustainable Income has increased as the price has declined as shown in the graph:


Click for Big

The difference is because the bond’s yield calculation includes the amortization of the discount; therefore, so does the Sustainable Income estimate.

Different assumptions lead to different results from the calculation, but the overall positive trend is apparent. I’m very pleased with the long-term results! It will be noted that if there was no trading in the portfolio, one would expect the sustainable yield to be constant (before fees and expenses). The success of the fund’s trading is showing up in

  • the very good performance against the index
  • the long term increases in sustainable income per unit

As has been noted, the fund has maintained a credit quality equal to or better than the index; outperformance has generally been due to exploitation of trading anomalies.

Again, there are no predictions for the future! The fund will continue to trade between issues in an attempt to exploit market gaps in liquidity, in an effort to outperform the index and keep the sustainable income per unit – however calculated! – growing.

Low-Spread FixedResets: January & February, 2016

March 6th, 2016

As noted in MAPF Portfolio Composition: February 2016, the fund now has a large allocation to FixedResets, mostly of relatively low spread.

Many of these were largely purchased with proceeds of sales of DeemedRetractibles from the same issuer; it is interesting to look at the price trend of some of the Straight/FixedReset pairs. We’ll start with GWO.PR.N / GWO.PR.I; the fund sold the latter to buy the former at a takeout of about $1.00 in mid-June, 2014; relative prices over the past two months are plotted as:

GWOPRN_GWOPRI_160229_bidDiff
Click for Big

Given that the February month-end take-out was $7.04, this is clearly a trade that has not worked out very well.

In July, 2014, I reported sales of SLF.PR.D to purchase SLF.PR.G at a take-out of about $0.15:

SLFPRG_SLFPRD_160229_bidDiff
Click for Big

There were similar trades in August, 2014 (from SLF.PR.C) at a take-out of $0.35. The February month-end take-out (bid price SLF.PR.D less bid price SLF.PR.G) was $5.30, so that hasn’t worked very well either.

November, 2014, saw the third insurer-based sector swap, as the fund sold MFC.PR.C to buy the FixedReset MFC.PR.F at a post-dividend-adjusted take-out of about $0.85 … given a November month-end take-out of $6.09, that’s another regrettable trade, although another piece executed in December at a take-out of $1.57 has less badly.

MFCPRF_MFCPRC_160229_bidDiff
Click for Big

This trend is not restricted to the insurance sector, which I expect will become subject to NVCC rules in the relatively near future and are thus subject to the same redemption assumptions I make for DeemedRetractibles. Other pairs of interest are BAM.PR.X / BAM.PR.N:

BAMPRX_BAMPRN_160229_bidDiff
Click for Big

… and FTS.PR.H / FTS.PR.J:

FTSPRH_FTSPRJ_160229_bidDiff
Click for Big

… and PWF.PR.P / PWF.PR.S:

PWFPRP_PWFPRS_160229_bidDiff
Click for Big

I will agree that the fund’s trades highlighted in this post may be decried as cases of monumental bad timing, but I should point out that in May, 2014, the fund was 63.9% Straight / 9.5% FixedReset while in May 2015 the fund was 12% Straight / 86% FixedReset, FloatingReset and FixedFloater (The latter figures include allocations from those usually grouped as ‘Scraps’). Given that the indices are roughly 30% Straight / 60% FixedReset & FloatingReset, it is apparent that the fund was extremely overweighted in Straights / underweighted in FixedResets in May 2014 but this situation has now reversed. HIMIPref™ analytics have been heavily favouring low-spread issues and the fund’s holdings are overwhelmingly of this type.

Getting back to price spreads between low-spread FixedResets and their Straight Perpetual comparators, we can summarize the data above in tabular form and see:

FixedReset Straight Take-out
December 2013
Take-out
MAPF Trade
Take-out
December 2014
December 2015 January 2016 February 2016
GWO.PR.N
3.65%+130
GWO.PR.I
4.5%
($0.04) $1.00 $2.95 6.97 8.90 8.11
SLF.PR.G
4.35%+141
SLF.PR.D
4.45%
($1.29) $0.25 $2.16 5.15 7.62 6.82
MFC.PR.F
4.20%+141
MFC.PR.C
4.50%
($1.29) $0.86 $1.20 6.09 8.89 7.40
BAM.PR.X
4.60%+180
BAM.PR.N
4.75%
($2.06)   $0.17 4.09 6.56 6.98
FTS.PR.H
4.25%+145
FTS.PR.J
4.75%
$0.60   $5.68 8.26 8.35 9.64
PWF.PR.P
4.40%+160
PWF.PR.S
4.80%
($0.67)   $3.00 7.24 8.44 9.66
The ‘Take-Out’ is the bid price of the Straight less the bid price of the FixedReset; approximate execution prices are used for the “MAPF Trade” column. Bracketted figures in the ‘Take-Out’ columns indicate a ‘Pay-Up’

In January, 2015, a slow decline due to fears of deflation got worse with Canada yields plummeting after the Bank of Canada rate cut with speculation rife about future cuts although this slowly died away.

And in late March / early April it got worse again, with one commenter attributing at least some of the blame to the John Heinzl piece in which I pointed out the expected reduction in dividend payouts! In May, a rise in the markets in the first half of the month was promptly followed by a slow decline in the latter half; perhaps due to increased fears that a lousy Canadian economy will delay a Canadian tightening. Changes in June varied as the markets were in an overall decline.

In August we saw increased fear of global deflation emanating from China, although the ‘China Effect’ is disputed.

In September the market just collapsed for no apparent reason; in October the market reversed the September collapse for no apparent reason. In mid-December the Fed finally hiked its policy rate, but this well-telegraphed event has had no major effect as of yet.

The market collapsed in January. I don’t know why. And it got worse in February.

All in all, I take the view that we’ve seen this show before: during the Credit Crunch, Floaters got hit extremely badly (to the point at which their fifteen year total return was negative) because (as far as I can make out) their dividend rate was dropping (as it was linked to Prime) while the yields on other perpetual preferred instruments were skyrocketing (due to credit concerns). Thus, at least some investors insisted on getting long term corporate yields from rates based (indirectly and with a lag, in the case of FixedResets) on short-term government policy rates. And it’s happening again!

There is further discussion of the extremely poor performance in the seven months to July 31, 2015, of FixedResets in the post eMail to a Client. Things haven’t really changed since that was written; they’ve just gotten ever so much more so.

What happened, essentially, is that the software assumes a certain amount of efficiency in the market. For instance, in 2013 PerpetualDiscounts were trading to yield 250-300bp over FixedResets (see the chart “PDIE-FR Spread”, below, for the PerpetualDiscount Interest Equivalent – FixedReset Spread), where the yield-to-perpetuity of FixedResets was calculated using the contemporary five-year Canada yield of 1.50%-2.00% (see the chart “Historical Government Yields”, below, for the historical government yields). The software assumes the market will get the big things right, so it therefore assumed that this 250-300bp spread would be maintained; and that a spread in this range represented fair value. Therefore, it would only purchase FixedResets if they were sufficiently cheap to other FixedResets to give a good chance of making up this fairly large yield difference.

When this spread started increasing in 2014, FixedResets started looking more attractive as the system assumes a certain amount of mean reversion and the system started buying those issues that were cheap to other FixedResets. However, the underlying assumption that the market would get the big things more-or-less right appears to have been unjustified in this instance: incredibly, the market was not accounting for changes in the five-year Canada rate (and therefore for changes in the projected dividend rate on reset) during this period. So we can call this period an episode of structural change in the markets – and no quantitative system can account for future structural change unless that is programmed into the system … in which case the analysis is no longer quantitative.

FixedReset vs. PerpetualDiscount YTW
(Interest Equivalent)
PL_160212_App_FR_Chart_55
Click for Big
PL_160212_App_FR_Chart_2
Click for Big

Here’s the two month performance to February 29 for FixedResets that had a YTW Scenario of ‘To Perpetuity’ at mid-February.:

perf_FR_160229_2Mo_IRS
Click for Big

Correlations were good for both the “Pfd-2 Group” and the “Pfd-3 Group”, at 28% and 29%, respectively.

Three month performance correlation for both the Pfd-2 and Pfd-3 groups is also good, at 20% and 22%, respectively:

perf_FR_160229_3Mo_IRS
Click for Big

MAPF Portfolio Composition: February, 2016

March 6th, 2016

Turnover in February remained negligible.

There is extreme segmentation in the marketplace, with OSFI’s NVCC rule changes in February 2011 having had the effect of splitting the formerly relatively homogeneous Straight Perpetual class of preferreds into three parts:

  • Unaffected Straight Perpetuals
  • DeemedRetractibles explicitly subject to the rules (banks)
  • DeemedRetractibles considered by me, but not (yet!) by the market, to be likely to be explicitly subject to the rules in the future (insurers and insurance holding companies)

This segmentation, and the extreme valuation differences between the segments, has cut down markedly on the opportunities for trading.

To make this more clear, it used to be that there were 70-odd Straight Perpetuals and I was more or less indifferent as to which ones I owned (subject, of course, to issuer concentration concerns and other risk management factors). Thus, if any one of these 70 were to go down in price by – say – $0.25, I would quite often have something in inventory that I’d be willing to swap for it. The segmentation means that I am no longer indifferent; in addition to checking the valuation of a potential buy to other Straights, I also have to check its peer group. This cuts down on the potential for trading.

And, of course, the same segmentation has the same effect on trading opportunities between FixedReset issues.

There is no real hope that this situation will be corrected in the near-term. OSFI has indicated that the long-promised “Draft Definition of Capital” for insurers will not be issued “for public consultation in late 2012 or early 2013”, as they fear that it might encourage speculation in the marketplace. It is not clear why OSFI is so afraid of informed speculation, since the constant speculation in the marketplace is currently less informed than it would be with a little bit of regulatory clarity. While the framework has been updated, the modifications focus on the amount of capital required, not the required characteristics of that capital.

As a result of this delay, I have extended the Deemed Maturity date for insurers and insurance holding companies by three years (to 2025-1-31), in the expectation that when OSFI finally does provide clarity, they will allow the same degree of lead-in time for these companies as they did for banks. This had a major effect on the durations of preferred shares subject to the change but, fortunately, not much on their calculated yields as most of these issues were either trading near par when the change was made or were trading at sufficient premium that a par call was expected on economic grounds. However, with the declines in the market over the past nine months, the expected capital gain on redemption of the insurance-issued DeemedRetractibles has become an important component of the calculated yield.

Due to the footdragging by OSFI, I will be extending the DeemedMaturity date for insurance issues by another two years in the near future.

Sectoral distribution of the MAPF portfolio on February 29 was as follows:

MAPF Sectoral Analysis 2016-2-29
HIMI Indices Sector Weighting YTW ModDur
Ratchet 0% N/A N/A
FixFloat 0% N/A N/A
Floater 0% N/A N/A
OpRet 0% N/A N/A
SplitShare 1.5% (0) 6.78% 5.28
Interest Rearing 0% N/A N/A
PerpetualPremium 0% N/A N/A
PerpetualDiscount 15.0% (0) 5.94% 14.00
Fixed-Reset 53.4% (-0.5) 9.48% 9.31
Deemed-Retractible 6.4% (0) 7.43% 6.99
FloatingReset 11.3% (-0.8) 9.39% 10.55
Scraps (Various) 10.8% (0) 7.96% 11.84
Cash +1.7% (+1.4) 0.00% 0.00
Total 100% 8.44% 10.05
Totals and changes will not add precisely due to rounding. Bracketted figures represent change from January month-end. Cash is included in totals with duration and yield both equal to zero.
DeemedRetractibles are comprised of all Straight Perpetuals (both PerpetualDiscount and PerpetualPremium) issued by BMO, BNS, CM, ELF, GWO, HSB, IAG, MFC, NA, RY, SLF and TD, which are not exchangable into common at the option of the company. These issues are analyzed as if their prospectuses included a requirement to redeem at par on or prior to 2022-1-31 (banks) or 2025-1-3 (insurers and insurance holding companies), in addition to the call schedule explicitly defined. See OSFI Does Not Grandfather Extant Tier 1 Capital, CM.PR.D, CM.PR.E, CM.PR.G: NVCC Status Confirmed and the January, February, March and June, 2011, editions of PrefLetter for the rationale behind this analysis. (all recent editions have a short summary of the argument included in the “DeemedRetractible” section)

Note that the estimate for the time this will become effective for insurers and insurance holding companies was extended by three years in April 2013, due to the delays in OSFI’s providing clarity on the issue.

Calculations of resettable instruments are performed assuming a constant GOC-5 rate of 0.66% and a constant 3-Month Bill rate of 0.43%

The “total” reflects the un-leveraged total portfolio (i.e., cash is included in the portfolio calculations and is deemed to have a duration and yield of 0.00.). MAPF will often have relatively large cash balances, both credit and debit, to facilitate trading. Figures presented in the table have been rounded to the indicated precision.

Credit distribution is:

MAPF Credit Analysis 2016-02-29
DBRS Rating Weighting
Pfd-1 0 (0)
Pfd-1(low) 0 (0)
Pfd-2(high) 31.8% (-0.6)
Pfd-2 36.3% (+0.1)
Pfd-2(low) 19.5% (-0.8)
Pfd-3(high) 5.2% (-0.2)
Pfd-3 3.2% (+0.1)
Pfd-3(low) 1.7% (0)
Pfd-4(high) 0% (0)
Pfd-4 0%
Pfd-4(low) 0% (0)
Pfd-5(high) 0.6% (+0.6)
Pfd-5 0.0% (-0.5)
Cash +1.7% (+1.4)
Totals will not add precisely due to rounding. Bracketted figures represent change from January month-end.
The fund holds a position in AZP.PR.B, which is rated P-5(high) by S&P and is unrated by DBRS
A position held in NPI.PR.C is not rated by DBRS, but has been included as “Pfd-3(high)” in the above table on the basis of its S&P rating of P-3(high).
A position held in INE.PR.A is not rated by DBRS, but has been included as “Pfd-3” in the above table on the basis of its S&P rating of P-3.

Liquidity Distribution is:

MAPF Liquidity Analysis 2016-02-29
Average Daily Trading Weighting
<$50,000 1.4% (+0.1)
$50,000 – $100,000 42.9% (+16.1)
$100,000 – $200,000 41.4% (+9.0)
$200,000 – $300,000 8.2% (-20.9)
>$300,000 4.5% (-5.6)
Cash +1.7% (+1.4)
Totals will not add precisely due to rounding. Bracketted figures represent change from January month-end.

MAPF is, of course, Malachite Aggressive Preferred Fund, a “unit trust” managed by Hymas Investment Management Inc. Further information and links to performance, audited financials and subscription information are available the fund’s web page. The fund may be purchased either directly from Hymas Investment Management or through a brokerage account at Odlum Brown Limited. A “unit trust” is like a regular mutual fund, but is sold by offering memorandum rather than prospectus. This is cheaper, but means subscription is restricted to “accredited investors” (as defined by the Ontario Securities Commission). Fund past performances are not a guarantee of future performance. You can lose money investing in MAPF or any other fund.

A similar portfolio composition analysis has been performed on the Claymore Preferred Share ETF (symbol CPD) (and other funds) as of August 31, 2012, and published in the October (mainly methodology), November (most funds), and December (ZPR) 2012, PrefLetter. While direct comparisons are difficult due to the introduction of the DeemedRetractible class of preferred share (see above) it is fair to say:

  • MAPF credit quality is better
  • MAPF liquidity is a bit lower
  • MAPF Yield is higher
  • Weightings
    • MAPF is less exposed to Straight Perpetuals (including DeemedRetractibles)
    • MAPF is less exposed to Operating Retractibles
    • MAPF is more exposed to SplitShares
    • MAPF is less exposed to FixFloat / Floater / Ratchet
    • MAPF is overweighted in FixedResets

March 4, 2016

March 5th, 2016

Jobs, jobs, jobs!

Employers added more workers in February than projected but wages unexpectedly declined, dashing hopes that reduced slack in the labor market was starting to benefit all Americans.

The 242,000 gain followed a 172,000 rise in January that was larger than previously estimated, a Labor Department report showed Friday. The jobless rate held at 4.9 percent as people entered the labor force and found work. Average hourly earnings dropped, the first monthly decline in more than a year, and workers put in fewer hours.

Average hourly earnings dropped by 0.1 percent from the prior month, the first decline since December 2014, the Labor Department’s figures showed. Worker pay increased 2.2 percent over the 12 months ended in February, less than the 2.5 percent forecast in the Bloomberg survey. Wage growth has been hovering just above 2 percent year-over-year on average since the current expansion began in mid-2009.

Payrolls at retailers climbed about 55,000 in February after a 62,000 advance a month earlier, while health care employment increased 57,400.

Payrolls at factories declined by 16,000 after a 23,000 gain and construction companies added 19,000 workers.

The participation rate, which shows the share of working-age people in the labor force, jumped to 62.9 percent, the highest since January 2015.

An otherwise interesting article quantifying projected investor losses from negative yields was spoilt by a misconception about the bond market:

As central bankers in Europe and Japan experiment with negative-rate policies to ignite their economies, investors are essentially being charged a fee to own about $7.7 trillion of sovereign debt.

How big of a tax is this on bond buyers? Well, here’s one way to get a sense of it: Investors would lose about 71 billion euros ($78 billion) if they were to buy all of Germany’s negative-yielding bonds coming due in more than two years and held them to maturity, according to calculations by Bloomberg Intelligence analyst David Powell.

Of course, this is an entirely hypothetical exercise. Many investors aren’t planning to hold this debt until maturity. Some are counting on yields to go even more negative, meaning that prices would increase, allowing them to get out without losses or even a profit if and when they want to.

It’s the last paragraph, of course, that is complete bullshit. This stuff is Fixed Income. It has a fixed coupon (mostly!) and a fixed maturity date and a fixed redemption price.

Therefore, the loss from today’s price to maturity is fixed. OK, so some investors are hoping prices will increase between now and maturity, if only a little bit and if only for a short while. So what? If current investors in German bonds should be so lucky as to unload their stakes with a 71-billion euro profit (from today’s prices) instead of an equally sized loss, all that means is that the buyers will, between transaction date and maturity, realize a 142-billion euro loss.

Because, you see, this stuff is fixed income.

Quibbling that the central banks / government treasuries could be the buyer is meaningless. In that case the central banks and government treasuries are taking the loss, even if they wish to cast it as a redemption.

There has been some philosophizing over productivity:

It’s a paradox that’s been puzzling economists for a while. How can U.S. productivity growth be slowing down at the same time that innovation in everything from smartphones to 3D printing seems to be speeding up?

A trio of economists from the Federal Reserve and the International Monetary Fund think they have the answer and it’s not particularly pretty. They argue in a new paper that the down-shift in productivity is for real. It’s not a mirage of mis-measurement by government statisticians unable to keep up with rapidly changing technology.

The authors — David Byrne from the Fed in Washington, John Fernald from the San Francisco Fed and Marshall Reinsdorf from the International Monetary Fund — also don’t deny that IT has made Americans’ lives easier and more enjoyable in many ways, from calling up directions on Google Maps to trading cat videos on Facebook.

But that doesn’t translate into more economic output. The researchers compare such online services to an old economy innovation: television. It too enhanced Americans’ leisure time but didn’t make them more productive.

There are lots of available critiques of GDP; perhaps the productivity problem is just another one of them.

Matt Levine writes an entertaining piece on the valuation of private equities:

Today’s Wall Street Journal has a terrific story about how mutual funds that bought stakes in large closely held technology companies are now writing down some of those stakes:

BlackRock Inc., Fidelity Investments, T. Rowe Price Group Inc. and Wellington Management run or advise mutual funds that own shares in at least 40 closely held startups valued at $1 billion or more apiece, according to securities filings analyzed by The Wall Street Journal.

For 13 of the startups, at least one mutual-fund firm values its investment at less than what it paid, the Journal’s analysis shows. Those firms are valuing the 13 companies at an average of 28% below their original purchase price.


You know what I think! Private markets are the new public markets, and if you want to run a giant company with hundreds of employees, a multibillion-dollar valuation, and millions of dollars raised from public mutual funds, while still calling it a “startup,” you can do that now. (You can even call it a “unicorn,” if “startup” seems a little low-rent.) But what this means is that private companies are the new public companies, and sometimes public companies’ stocks go down. In a world where venture-funded startups exist in a sort of trial-and-error, proof-of-concept phase, and go public when it turns out the concept works, private valuations shouldn’t fluctuate unpredictably: You raise money, your thing works, you raise more money at a higher valuation, your thing scales a bit, and you go public at a yet higher valuation. (Or: You raise money, your thing fails, you send your venture capitalists a note with your condolences, and that is that.) The problems of running an operating business for the long term, with revenue fluctuations and competitive pressures and changing market conditions, get worked out in your stock price as a public company. Sometimes it goes down!

In a world where venture-funded startups are also mutual-fund-funded multibillion-dollar companies with massive established businesses used by millions of people, that’s not the model any more.

They [privately held companies] can even avoid the discipline of fluctuating stock prices. Just don’t sell to mutual funds! It is an obvious answer, and private companies have noticed:

Some venture capitalists anticipate further markdowns by mutual funds. That could make some startups more reluctant to seek mutual-fund money, since public disclosure of their valuations is watched so closely.

Assiduous Readers will remember that I expect that sooner or later we’re going to see a gigantic juicy private equity valuation scandal … and then we’ll learn which pension funds and which public investment companies (such as insurers) have been naughty.

It was another superb day for the Canadian preferred share market, with PerpetualDiscounts up 51bp, FixedResets winning 75bp and DeemedRetractibles up 36bp. The Performance Highlights table has only three losers. Volume was well below average.

For as long as the FixedReset market is so violently unsettled, I’ll keep publishing updates of the more interesting and meaningful series of FixedResets’ Implied Volatilities. This doesn’t include Enbridge because although Enbridge has a large number of issues outstanding, all of which are quite liquid, the range of Issue Reset Spreads is too small for decent conclusions. The low is 212bp (ENB.PR.H; second-lowest is ENB.PR.D at 237bp) and the high is a mere 268 for ENB.PF.G.

Remember that all rich /cheap assessments are:
» based on Implied Volatility Theory only
» are relative only to other FixedResets from the same issuer
» assume constant GOC-5 yield
» assume constant Implied Volatility
» assume constant spread

Here’s TRP:

impVol_TRP_160304
Click for Big

TRP.PR.E, which resets 2019-10-30 at +235, is bid at 18.22 to be $1.54 rich, while TRP.PR.C, resetting 2021-1-30 at +296, is $1.16 cheap at its bid price of 11.20.

impVol_MFC_160304
Click for Big

Most expensive is MFC.PR.O, resetting at +497bp on 2021-6-19, bid at 25.25 to be 1.32 rich, while MFC.PR.G, resetting at +290bp on 2016-12-19, is bid at 17.21 to be 1.30 cheap.

impVol_BAM_160304
Click for Big

The cheapest issue relative to its peers is BAM.PR.T, resetting at +231bp on 2017-3-31, bid at 14.00 to be $1.06 cheap. BAM.PF.E, resetting at +255 on 2020-3-31 is bid at 17.33 and appears to be $1.06 rich.

impVol_FTS_160304
Click for Big

FTS.PR.K, with a spread of +205bp, and bid at 15.02 looks $0.44 expensive and resets 2019-3-1. FTS.PR.H, with a spread of +145bp and resetting 2020-6-1, is bid at 11.12 and is $0.31 cheap.

pairs_FR_160304
Click for Big

Investment-grade pairs predict an average three-month bill yield over the next five-odd years of -0.96%, with three outliers below -2.00% and one above 0.00%. There are no junk outliers.

pairs_FF_160304
Click for Big

Shall we just say that this exhibits a high level of confidence in the continued rapacity of Canadian banks?

HIMIPref™ Preferred Indices
These values reflect the December 2008 revision of the HIMIPref™ Indices

Values are provisional and are finalized monthly
Index Mean
Current
Yield
(at bid)
Median
YTW
Median
Average
Trading
Value
Median
Mod Dur
(YTW)
Issues Day’s Perf. Index Value
Ratchet 5.34 % 6.49 % 12,958 16.09 1 -0.3150 % 1,466.1
FixedFloater 7.45 % 6.53 % 23,749 15.70 1 -0.0783 % 2,670.3
Floater 4.58 % 4.74 % 77,562 15.88 4 0.5600 % 1,675.5
OpRet 0.00 % 0.00 % 0 0.00 0 -0.0338 % 2,745.4
SplitShare 4.84 % 5.87 % 77,232 2.65 7 -0.0338 % 3,212.6
Interest-Bearing 0.00 % 0.00 % 0 0.00 0 -0.0338 % 2,506.6
Perpetual-Premium 5.81 % 0.98 % 76,539 0.08 6 0.0662 % 2,540.9
Perpetual-Discount 5.72 % 5.77 % 101,095 14.15 33 0.5145 % 2,529.0
FixedReset 5.59 % 5.13 % 196,630 14.49 85 0.7490 % 1,818.3
Deemed-Retractible 5.29 % 5.71 % 113,059 5.14 34 0.3586 % 2,572.6
FloatingReset 3.10 % 5.26 % 41,029 5.46 16 0.5543 % 1,964.5
Performance Highlights
Issue Index Change Notes
BAM.PR.T FixedReset -3.45 % YTW SCENARIO
Maturity Type : Limit Maturity
Maturity Date : 2046-03-04
Maturity Price : 14.00
Evaluated at bid price : 14.00
Bid-YTW : 5.60 %
HSE.PR.G FixedReset -1.66 % YTW SCENARIO
Maturity Type : Limit Maturity
Maturity Date : 2046-03-04
Maturity Price : 16.60
Evaluated at bid price : 16.60
Bid-YTW : 6.61 %
BMO.PR.Q FixedReset -1.39 % YTW SCENARIO
Maturity Type : Hard Maturity
Maturity Date : 2022-01-31
Maturity Price : 25.00
Evaluated at bid price : 18.39
Bid-YTW : 7.64 %
RY.PR.I FixedReset 1.05 % YTW SCENARIO
Maturity Type : Hard Maturity
Maturity Date : 2022-01-31
Maturity Price : 25.00
Evaluated at bid price : 23.15
Bid-YTW : 4.55 %
FTS.PR.I FloatingReset 1.06 % YTW SCENARIO
Maturity Type : Limit Maturity
Maturity Date : 2046-03-04
Maturity Price : 9.50
Evaluated at bid price : 9.50
Bid-YTW : 4.98 %
IFC.PR.C FixedReset 1.08 % YTW SCENARIO
Maturity Type : Hard Maturity
Maturity Date : 2025-01-31
Maturity Price : 25.00
Evaluated at bid price : 15.94
Bid-YTW : 9.70 %
BMO.PR.W FixedReset 1.08 % YTW SCENARIO
Maturity Type : Limit Maturity
Maturity Date : 2046-03-04
Maturity Price : 16.77
Evaluated at bid price : 16.77
Bid-YTW : 4.60 %
ELF.PR.G Perpetual-Discount 1.11 % YTW SCENARIO
Maturity Type : Limit Maturity
Maturity Date : 2046-03-04
Maturity Price : 20.08
Evaluated at bid price : 20.08
Bid-YTW : 6.01 %
RY.PR.H FixedReset 1.12 % YTW SCENARIO
Maturity Type : Limit Maturity
Maturity Date : 2046-03-04
Maturity Price : 17.10
Evaluated at bid price : 17.10
Bid-YTW : 4.57 %
VNR.PR.A FixedReset 1.14 % YTW SCENARIO
Maturity Type : Limit Maturity
Maturity Date : 2046-03-04
Maturity Price : 16.80
Evaluated at bid price : 16.80
Bid-YTW : 5.37 %
SLF.PR.J FloatingReset 1.21 % YTW SCENARIO
Maturity Type : Hard Maturity
Maturity Date : 2025-01-31
Maturity Price : 25.00
Evaluated at bid price : 11.69
Bid-YTW : 11.56 %
CU.PR.C FixedReset 1.21 % YTW SCENARIO
Maturity Type : Limit Maturity
Maturity Date : 2046-03-04
Maturity Price : 15.85
Evaluated at bid price : 15.85
Bid-YTW : 4.95 %
MFC.PR.G FixedReset 1.24 % YTW SCENARIO
Maturity Type : Hard Maturity
Maturity Date : 2025-01-31
Maturity Price : 25.00
Evaluated at bid price : 17.21
Bid-YTW : 8.76 %
TD.PR.Z FloatingReset 1.25 % YTW SCENARIO
Maturity Type : Hard Maturity
Maturity Date : 2022-01-31
Maturity Price : 25.00
Evaluated at bid price : 21.01
Bid-YTW : 5.26 %
CU.PR.H Perpetual-Discount 1.26 % YTW SCENARIO
Maturity Type : Limit Maturity
Maturity Date : 2046-03-04
Maturity Price : 22.94
Evaluated at bid price : 23.35
Bid-YTW : 5.64 %
BAM.PF.C Perpetual-Discount 1.27 % YTW SCENARIO
Maturity Type : Limit Maturity
Maturity Date : 2046-03-04
Maturity Price : 19.99
Evaluated at bid price : 19.99
Bid-YTW : 6.19 %
TD.PR.S FixedReset 1.42 % YTW SCENARIO
Maturity Type : Hard Maturity
Maturity Date : 2022-01-31
Maturity Price : 25.00
Evaluated at bid price : 23.53
Bid-YTW : 3.93 %
MFC.PR.J FixedReset 1.45 % YTW SCENARIO
Maturity Type : Hard Maturity
Maturity Date : 2025-01-31
Maturity Price : 25.00
Evaluated at bid price : 16.75
Bid-YTW : 8.93 %
IAG.PR.G FixedReset 1.46 % YTW SCENARIO
Maturity Type : Hard Maturity
Maturity Date : 2025-01-31
Maturity Price : 25.00
Evaluated at bid price : 17.40
Bid-YTW : 8.58 %
BIP.PR.A FixedReset 1.46 % YTW SCENARIO
Maturity Type : Limit Maturity
Maturity Date : 2046-03-04
Maturity Price : 18.01
Evaluated at bid price : 18.01
Bid-YTW : 5.97 %
MFC.PR.M FixedReset 1.47 % YTW SCENARIO
Maturity Type : Hard Maturity
Maturity Date : 2025-01-31
Maturity Price : 25.00
Evaluated at bid price : 17.29
Bid-YTW : 8.46 %
RY.PR.Z FixedReset 1.47 % YTW SCENARIO
Maturity Type : Limit Maturity
Maturity Date : 2046-03-04
Maturity Price : 17.25
Evaluated at bid price : 17.25
Bid-YTW : 4.47 %
TRP.PR.E FixedReset 1.50 % YTW SCENARIO
Maturity Type : Limit Maturity
Maturity Date : 2046-03-04
Maturity Price : 18.22
Evaluated at bid price : 18.22
Bid-YTW : 4.52 %
BAM.PR.M Perpetual-Discount 1.54 % YTW SCENARIO
Maturity Type : Limit Maturity
Maturity Date : 2046-03-04
Maturity Price : 19.78
Evaluated at bid price : 19.78
Bid-YTW : 6.13 %
BMO.PR.Y FixedReset 1.67 % YTW SCENARIO
Maturity Type : Limit Maturity
Maturity Date : 2046-03-04
Maturity Price : 18.30
Evaluated at bid price : 18.30
Bid-YTW : 4.78 %
BAM.PF.A FixedReset 1.70 % YTW SCENARIO
Maturity Type : Limit Maturity
Maturity Date : 2046-03-04
Maturity Price : 17.96
Evaluated at bid price : 17.96
Bid-YTW : 5.25 %
CM.PR.Q FixedReset 1.74 % YTW SCENARIO
Maturity Type : Limit Maturity
Maturity Date : 2046-03-04
Maturity Price : 18.15
Evaluated at bid price : 18.15
Bid-YTW : 4.86 %
FTS.PR.F Perpetual-Discount 1.74 % YTW SCENARIO
Maturity Type : Limit Maturity
Maturity Date : 2046-03-04
Maturity Price : 21.94
Evaluated at bid price : 22.18
Bid-YTW : 5.55 %
FTS.PR.J Perpetual-Discount 1.76 % YTW SCENARIO
Maturity Type : Limit Maturity
Maturity Date : 2046-03-04
Maturity Price : 21.42
Evaluated at bid price : 21.42
Bid-YTW : 5.58 %
BAM.PF.D Perpetual-Discount 1.77 % YTW SCENARIO
Maturity Type : Limit Maturity
Maturity Date : 2046-03-04
Maturity Price : 20.15
Evaluated at bid price : 20.15
Bid-YTW : 6.20 %
BAM.PR.N Perpetual-Discount 1.80 % YTW SCENARIO
Maturity Type : Limit Maturity
Maturity Date : 2046-03-04
Maturity Price : 19.83
Evaluated at bid price : 19.83
Bid-YTW : 6.11 %
MFC.PR.I FixedReset 1.81 % YTW SCENARIO
Maturity Type : Hard Maturity
Maturity Date : 2025-01-31
Maturity Price : 25.00
Evaluated at bid price : 17.41
Bid-YTW : 8.67 %
HSE.PR.A FixedReset 1.86 % YTW SCENARIO
Maturity Type : Limit Maturity
Maturity Date : 2046-03-04
Maturity Price : 8.76
Evaluated at bid price : 8.76
Bid-YTW : 6.99 %
BMO.PR.M FixedReset 1.89 % YTW SCENARIO
Maturity Type : Hard Maturity
Maturity Date : 2022-01-31
Maturity Price : 25.00
Evaluated at bid price : 23.20
Bid-YTW : 4.20 %
IFC.PR.A FixedReset 2.02 % YTW SCENARIO
Maturity Type : Hard Maturity
Maturity Date : 2025-01-31
Maturity Price : 25.00
Evaluated at bid price : 13.62
Bid-YTW : 11.24 %
MFC.PR.L FixedReset 2.03 % YTW SCENARIO
Maturity Type : Hard Maturity
Maturity Date : 2025-01-31
Maturity Price : 25.00
Evaluated at bid price : 16.10
Bid-YTW : 9.26 %
TD.PF.D FixedReset 2.06 % YTW SCENARIO
Maturity Type : Limit Maturity
Maturity Date : 2046-03-04
Maturity Price : 18.37
Evaluated at bid price : 18.37
Bid-YTW : 4.80 %
PWF.PR.T FixedReset 2.07 % YTW SCENARIO
Maturity Type : Limit Maturity
Maturity Date : 2046-03-04
Maturity Price : 19.70
Evaluated at bid price : 19.70
Bid-YTW : 4.11 %
BNS.PR.C FloatingReset 2.17 % YTW SCENARIO
Maturity Type : Hard Maturity
Maturity Date : 2022-01-31
Maturity Price : 25.00
Evaluated at bid price : 21.22
Bid-YTW : 5.29 %
BAM.PR.Z FixedReset 2.27 % YTW SCENARIO
Maturity Type : Limit Maturity
Maturity Date : 2046-03-04
Maturity Price : 18.05
Evaluated at bid price : 18.05
Bid-YTW : 5.29 %
MFC.PR.N FixedReset 2.37 % YTW SCENARIO
Maturity Type : Hard Maturity
Maturity Date : 2025-01-31
Maturity Price : 25.00
Evaluated at bid price : 17.30
Bid-YTW : 8.39 %
BAM.PF.F FixedReset 2.38 % YTW SCENARIO
Maturity Type : Limit Maturity
Maturity Date : 2046-03-04
Maturity Price : 18.10
Evaluated at bid price : 18.10
Bid-YTW : 5.24 %
TD.PF.E FixedReset 2.43 % YTW SCENARIO
Maturity Type : Limit Maturity
Maturity Date : 2046-03-04
Maturity Price : 19.00
Evaluated at bid price : 19.00
Bid-YTW : 4.76 %
NA.PR.S FixedReset 2.57 % YTW SCENARIO
Maturity Type : Limit Maturity
Maturity Date : 2046-03-04
Maturity Price : 16.76
Evaluated at bid price : 16.76
Bid-YTW : 4.88 %
NA.PR.W FixedReset 2.60 % YTW SCENARIO
Maturity Type : Limit Maturity
Maturity Date : 2046-03-04
Maturity Price : 15.80
Evaluated at bid price : 15.80
Bid-YTW : 5.00 %
PWF.PR.A Floater 2.63 % YTW SCENARIO
Maturity Type : Limit Maturity
Maturity Date : 2046-03-04
Maturity Price : 11.30
Evaluated at bid price : 11.30
Bid-YTW : 4.21 %
TRP.PR.D FixedReset 3.12 % YTW SCENARIO
Maturity Type : Limit Maturity
Maturity Date : 2046-03-04
Maturity Price : 17.51
Evaluated at bid price : 17.51
Bid-YTW : 4.63 %
SLF.PR.H FixedReset 3.19 % YTW SCENARIO
Maturity Type : Hard Maturity
Maturity Date : 2025-01-31
Maturity Price : 25.00
Evaluated at bid price : 14.89
Bid-YTW : 9.78 %
FTS.PR.G FixedReset 3.45 % YTW SCENARIO
Maturity Type : Limit Maturity
Maturity Date : 2046-03-04
Maturity Price : 15.00
Evaluated at bid price : 15.00
Bid-YTW : 4.93 %
TRP.PR.F FloatingReset 3.48 % YTW SCENARIO
Maturity Type : Limit Maturity
Maturity Date : 2046-03-04
Maturity Price : 11.60
Evaluated at bid price : 11.60
Bid-YTW : 5.06 %
CIU.PR.C FixedReset 3.62 % YTW SCENARIO
Maturity Type : Limit Maturity
Maturity Date : 2046-03-04
Maturity Price : 10.60
Evaluated at bid price : 10.60
Bid-YTW : 4.80 %
Volume Highlights
Issue Index Shares
Traded
Notes
SLF.PR.H FixedReset 161,200 Scotia crossed 160,000 at 14.52.
YTW SCENARIO
Maturity Type : Hard Maturity
Maturity Date : 2025-01-31
Maturity Price : 25.00
Evaluated at bid price : 14.89
Bid-YTW : 9.78 %
RY.PR.Q FixedReset 38,817 RBC crossed 15,000 at 25.52.
YTW SCENARIO
Maturity Type : Limit Maturity
Maturity Date : 2046-03-04
Maturity Price : 23.29
Evaluated at bid price : 25.45
Bid-YTW : 5.17 %
TD.PF.G FixedReset 35,839 YTW SCENARIO
Maturity Type : Limit Maturity
Maturity Date : 2046-03-04
Maturity Price : 23.31
Evaluated at bid price : 25.50
Bid-YTW : 5.23 %
MFC.PR.O FixedReset 35,385 Recent new issue.
YTW SCENARIO
Maturity Type : Call
Maturity Date : 2021-06-19
Maturity Price : 25.00
Evaluated at bid price : 25.25
Bid-YTW : 5.45 %
HSE.PR.A FixedReset 34,260 YTW SCENARIO
Maturity Type : Limit Maturity
Maturity Date : 2046-03-04
Maturity Price : 8.76
Evaluated at bid price : 8.76
Bid-YTW : 6.99 %
SLF.PR.G FixedReset 32,056 YTW SCENARIO
Maturity Type : Hard Maturity
Maturity Date : 2025-01-31
Maturity Price : 25.00
Evaluated at bid price : 13.30
Bid-YTW : 10.35 %
There were 21 other index-included issues trading in excess of 10,000 shares.
Wide Spread Highlights
Issue Index Quote Data and Yield Notes
HSE.PR.C FixedReset Quote: 15.17 – 18.00
Spot Rate : 2.8300
Average : 1.5785

YTW SCENARIO
Maturity Type : Limit Maturity
Maturity Date : 2046-03-04
Maturity Price : 15.17
Evaluated at bid price : 15.17
Bid-YTW : 6.69 %

TD.PR.Z FloatingReset Quote: 21.01 – 22.75
Spot Rate : 1.7400
Average : 1.3684

YTW SCENARIO
Maturity Type : Hard Maturity
Maturity Date : 2022-01-31
Maturity Price : 25.00
Evaluated at bid price : 21.01
Bid-YTW : 5.26 %

TRP.PR.I FloatingReset Quote: 10.25 – 11.99
Spot Rate : 1.7400
Average : 1.4284

YTW SCENARIO
Maturity Type : Limit Maturity
Maturity Date : 2046-03-04
Maturity Price : 10.25
Evaluated at bid price : 10.25
Bid-YTW : 4.86 %

BMO.PR.M FixedReset Quote: 23.20 – 23.90
Spot Rate : 0.7000
Average : 0.4183

YTW SCENARIO
Maturity Type : Hard Maturity
Maturity Date : 2022-01-31
Maturity Price : 25.00
Evaluated at bid price : 23.20
Bid-YTW : 4.20 %

FTS.PR.G FixedReset Quote: 15.00 – 15.78
Spot Rate : 0.7800
Average : 0.5113

YTW SCENARIO
Maturity Type : Limit Maturity
Maturity Date : 2046-03-04
Maturity Price : 15.00
Evaluated at bid price : 15.00
Bid-YTW : 4.93 %

FTS.PR.H FixedReset Quote: 11.12 – 11.78
Spot Rate : 0.6600
Average : 0.4031

YTW SCENARIO
Maturity Type : Limit Maturity
Maturity Date : 2046-03-04
Maturity Price : 11.12
Evaluated at bid price : 11.12
Bid-YTW : 4.98 %

March 3, 2016

March 4th, 2016

It seems there’s another way to increase low-end salaries:

Costco Wholesale Corp. will lift its minimum wage for the first time in nine years, by a $1.50 an hour, as the labor market tightens and competitors start giving workers a raise.

The second-largest U.S. retailer will start paying at least $13-to-$13.50 an hour, up from $11.50-to-$12 an hour, the company said Thursday in a conference call with analysts. The increase will cut its earnings per share in the next three months by 1 cent, and by 2 cents in the following three quarters, the Issaquah, Washington-based company said.

Retailers are under pressure to boost wages as unemployment falls below 5 percent and 14 states have raised their minimum wage this year. Wal-Mart Stores Inc., which operates the Sam’s Club warehouse-style chain, a Costco competitor, lifted its pay floor to $10 an hour this year and gave an increase to more than 1 million workers. Costco didn’t say how many of its 117,000 employees would get a raise.

But some might not sign up with Costco – because the fearmongers are winning:

The declining level of trust among Americans may have contributed to reduced flexibility in the U.S. labor market over the last several decades, according to a Federal Reserve working paper.

In the paper, Fed economists Raven Molloy, Christopher Smith and Riccardo Trezzi, along with University of Notre Dame professor Abigail Wozniak, identify a 10 percent to 15 percent decline in U.S. labor market fluidity — a measure that encompasses workers switching jobs and moving states as well as employers creating or cutting positions — since the early 1980s.

In U.S. states where the share of people who said their trust in strangers fell more steeply, labor mobility registered greater declines, according to the paper. The drop in social trust “may have increased the cost of job search or made both parties in the hiring process more risk averse,” it said.

“Regardless of the cause, less fluidity in the labor market leads to fewer opportunities for workers to renegotiate their current employment arrangements using outside options as leverage or to change jobs,” the authors wrote. That means less scope for wage growth, and that U.S. workers may be more reluctant to quit their jobs, “leading to ‘precautionary’ job holding and again an increase in the likelihood that the unemployed are there involuntarily.”

The paper by Raven S. Molloy, Christopher L. Smith, Riccardo Trezzi, and Abigail Wozniak is titled Understanding Declining Fluidity in the U.S. Labor Market. I would quote from it, but there appears to be some kind of incompatible font problem which gives rise to strange effects when copied.

BMO has redeemed a chunk of sub-debt on its pretend-maturity:

Bank of Montreal (TSX:BMO)(NYSE:BMO) today announced its intention to redeem all of its $700,000,000 Series D Medium-Term Notes First Tranche (the “Notes”) on April 21, 2016. The Notes are redeemable at par together with accrued and unpaid interest to, but excluding, the redemption date.

These notes were issued in 2006.

It was a superb day for the Canadian preferred share market, with PerpetualDiscounts gaining 22bp, FixedResets winning 117bp and DeemedRetractibles up 53bp. The Performance Highlights table is, predictably enough, dominated by winning FixedResets, with issues from TRP and BAM leading the pack. Volume was average.

For as long as the FixedReset market is so violently unsettled, I’ll keep publishing updates of the more interesting and meaningful series of FixedResets’ Implied Volatilities. This doesn’t include Enbridge because although Enbridge has a large number of issues outstanding, all of which are quite liquid, the range of Issue Reset Spreads is too small for decent conclusions. The low is 212bp (ENB.PR.H; second-lowest is ENB.PR.D at 237bp) and the high is a mere 268 for ENB.PF.G.

Remember that all rich /cheap assessments are:
» based on Implied Volatility Theory only
» are relative only to other FixedResets from the same issuer
» assume constant GOC-5 yield
» assume constant Implied Volatility
» assume constant spread

Here’s TRP:

impVol_TRP_160303
Click for Big

TRP.PR.E, which resets 2019-10-30 at +235, is bid at 17.95 to be $1.47 rich, while TRP.PR.C, resetting 2021-1-30 at +296, is $1.00 cheap at its bid price of 11.22.

impVol_MFC_160303
Click for Big

Most expensive is MFC.PR.O, resetting at +497bp on 2021-6-19, bid at 25.20 to be 1.41 rich, while MFC.PR.G, resetting at +290bp on 2016-12-19, is bid at 17.00 to be 1.34 cheap.

impVol_BAM_160303
Click for Big

The cheapest issue relative to its peers is BAM.PR.R, resetting at +230bp on 2016-6-30, bid at 14.23 to be $0.70 cheap. BAM.PF.E, resetting at +255 on 2020-3-31 is bid at 17.25 and appears to be $1.07 rich.

impVol_FTS_160303
Click for Big

FTS.PR.K, with a spread of +205bp, and bid at 15.02 looks $0.57 expensive and resets 2019-3-1. FTS.PR.G, with a spread of +213bp and resetting 2018-9-1, is bid at 14.50 and is $0.37 cheap.

pairs_FR_160303
Click for Big

Investment-grade pairs predict an average three-month bill yield over the next five-odd years of -0.99%, with two outliers below -2.00%. Note that the range of the y-axis has changed today. There are no junk outliers.

pairs_FF_160303
Click for Big

Shall we just say that this exhibits a high level of confidence in the continued rapacity of Canadian banks?

HIMIPref™ Preferred Indices
These values reflect the December 2008 revision of the HIMIPref™ Indices

Values are provisional and are finalized monthly
Index Mean
Current
Yield
(at bid)
Median
YTW
Median
Average
Trading
Value
Median
Mod Dur
(YTW)
Issues Day’s Perf. Index Value
Ratchet 5.33 % 6.47 % 12,259 16.12 1 1.6000 % 1,470.7
FixedFloater 7.44 % 6.53 % 23,056 15.71 1 2.1600 % 2,672.4
Floater 4.60 % 4.76 % 78,482 15.84 4 1.5328 % 1,666.1
OpRet 0.00 % 0.00 % 0 0.00 0 0.3572 % 2,746.3
SplitShare 4.84 % 5.69 % 78,466 2.66 7 0.3572 % 3,213.7
Interest-Bearing 0.00 % 0.00 % 0 0.00 0 0.3572 % 2,507.4
Perpetual-Premium 5.81 % 4.21 % 77,077 0.08 6 0.1789 % 2,539.3
Perpetual-Discount 5.75 % 5.79 % 102,111 14.15 33 0.2184 % 2,516.1
FixedReset 5.64 % 5.14 % 198,742 14.54 85 1.1679 % 1,804.8
Deemed-Retractible 5.31 % 5.87 % 116,364 5.14 34 0.5280 % 2,563.5
FloatingReset 3.12 % 5.31 % 42,581 5.46 16 0.3813 % 1,953.6
Performance Highlights
Issue Index Change Notes
PWF.PR.Q FloatingReset -3.23 % YTW SCENARIO
Maturity Type : Limit Maturity
Maturity Date : 2046-03-03
Maturity Price : 10.50
Evaluated at bid price : 10.50
Bid-YTW : 4.89 %
GWO.PR.O FloatingReset -2.31 % YTW SCENARIO
Maturity Type : Hard Maturity
Maturity Date : 2025-01-31
Maturity Price : 25.00
Evaluated at bid price : 11.00
Bid-YTW : 12.20 %
GWO.PR.N FixedReset -1.26 % YTW SCENARIO
Maturity Type : Hard Maturity
Maturity Date : 2025-01-31
Maturity Price : 25.00
Evaluated at bid price : 12.54
Bid-YTW : 11.01 %
RY.PR.H FixedReset 1.02 % YTW SCENARIO
Maturity Type : Limit Maturity
Maturity Date : 2046-03-03
Maturity Price : 16.91
Evaluated at bid price : 16.91
Bid-YTW : 4.62 %
RY.PR.D Deemed-Retractible 1.04 % YTW SCENARIO
Maturity Type : Hard Maturity
Maturity Date : 2022-01-31
Maturity Price : 25.00
Evaluated at bid price : 24.18
Bid-YTW : 5.20 %
RY.PR.I FixedReset 1.06 % YTW SCENARIO
Maturity Type : Hard Maturity
Maturity Date : 2022-01-31
Maturity Price : 25.00
Evaluated at bid price : 22.91
Bid-YTW : 4.75 %
RY.PR.A Deemed-Retractible 1.09 % YTW SCENARIO
Maturity Type : Hard Maturity
Maturity Date : 2022-01-31
Maturity Price : 25.00
Evaluated at bid price : 24.11
Bid-YTW : 5.21 %
CM.PR.P FixedReset 1.10 % YTW SCENARIO
Maturity Type : Limit Maturity
Maturity Date : 2046-03-03
Maturity Price : 16.58
Evaluated at bid price : 16.58
Bid-YTW : 4.72 %
GWO.PR.L Deemed-Retractible 1.12 % YTW SCENARIO
Maturity Type : Hard Maturity
Maturity Date : 2025-01-31
Maturity Price : 25.00
Evaluated at bid price : 24.47
Bid-YTW : 5.94 %
GWO.PR.I Deemed-Retractible 1.12 % YTW SCENARIO
Maturity Type : Hard Maturity
Maturity Date : 2025-01-31
Maturity Price : 25.00
Evaluated at bid price : 20.75
Bid-YTW : 7.09 %
TD.PF.A FixedReset 1.14 % YTW SCENARIO
Maturity Type : Limit Maturity
Maturity Date : 2046-03-03
Maturity Price : 16.89
Evaluated at bid price : 16.89
Bid-YTW : 4.64 %
IAG.PR.G FixedReset 1.18 % YTW SCENARIO
Maturity Type : Hard Maturity
Maturity Date : 2025-01-31
Maturity Price : 25.00
Evaluated at bid price : 17.15
Bid-YTW : 8.78 %
BMO.PR.T FixedReset 1.20 % YTW SCENARIO
Maturity Type : Limit Maturity
Maturity Date : 2046-03-03
Maturity Price : 16.85
Evaluated at bid price : 16.85
Bid-YTW : 4.61 %
BNS.PR.M Deemed-Retractible 1.20 % YTW SCENARIO
Maturity Type : Hard Maturity
Maturity Date : 2022-01-31
Maturity Price : 25.00
Evaluated at bid price : 24.37
Bid-YTW : 5.10 %
BAM.PR.R FixedReset 1.21 % YTW SCENARIO
Maturity Type : Limit Maturity
Maturity Date : 2046-03-03
Maturity Price : 14.23
Evaluated at bid price : 14.23
Bid-YTW : 5.38 %
MFC.PR.I FixedReset 1.24 % YTW SCENARIO
Maturity Type : Hard Maturity
Maturity Date : 2025-01-31
Maturity Price : 25.00
Evaluated at bid price : 17.10
Bid-YTW : 8.92 %
TD.PF.E FixedReset 1.26 % YTW SCENARIO
Maturity Type : Limit Maturity
Maturity Date : 2046-03-03
Maturity Price : 18.55
Evaluated at bid price : 18.55
Bid-YTW : 4.87 %
VNR.PR.A FixedReset 1.28 % YTW SCENARIO
Maturity Type : Limit Maturity
Maturity Date : 2046-03-03
Maturity Price : 16.61
Evaluated at bid price : 16.61
Bid-YTW : 5.44 %
MFC.PR.L FixedReset 1.28 % YTW SCENARIO
Maturity Type : Hard Maturity
Maturity Date : 2025-01-31
Maturity Price : 25.00
Evaluated at bid price : 15.78
Bid-YTW : 9.55 %
CU.PR.C FixedReset 1.36 % YTW SCENARIO
Maturity Type : Limit Maturity
Maturity Date : 2046-03-03
Maturity Price : 15.66
Evaluated at bid price : 15.66
Bid-YTW : 5.01 %
PVS.PR.D SplitShare 1.39 % YTW SCENARIO
Maturity Type : Hard Maturity
Maturity Date : 2021-10-08
Maturity Price : 25.00
Evaluated at bid price : 22.56
Bid-YTW : 6.64 %
BMO.PR.M FixedReset 1.43 % YTW SCENARIO
Maturity Type : Hard Maturity
Maturity Date : 2022-01-31
Maturity Price : 25.00
Evaluated at bid price : 22.77
Bid-YTW : 4.55 %
W.PR.K FixedReset 1.44 % YTW SCENARIO
Maturity Type : Limit Maturity
Maturity Date : 2046-03-03
Maturity Price : 23.03
Evaluated at bid price : 24.60
Bid-YTW : 5.36 %
RY.PR.Z FixedReset 1.49 % YTW SCENARIO
Maturity Type : Limit Maturity
Maturity Date : 2046-03-03
Maturity Price : 17.00
Evaluated at bid price : 17.00
Bid-YTW : 4.54 %
SLF.PR.I FixedReset 1.51 % YTW SCENARIO
Maturity Type : Hard Maturity
Maturity Date : 2025-01-31
Maturity Price : 25.00
Evaluated at bid price : 16.80
Bid-YTW : 8.85 %
TD.PF.C FixedReset 1.57 % YTW SCENARIO
Maturity Type : Limit Maturity
Maturity Date : 2046-03-03
Maturity Price : 16.85
Evaluated at bid price : 16.85
Bid-YTW : 4.63 %
BAM.PR.E Ratchet 1.60 % YTW SCENARIO
Maturity Type : Limit Maturity
Maturity Date : 2046-03-03
Maturity Price : 25.00
Evaluated at bid price : 12.70
Bid-YTW : 6.47 %
FTS.PR.I FloatingReset 1.62 % YTW SCENARIO
Maturity Type : Limit Maturity
Maturity Date : 2046-03-03
Maturity Price : 9.40
Evaluated at bid price : 9.40
Bid-YTW : 5.03 %
TD.PF.B FixedReset 1.69 % YTW SCENARIO
Maturity Type : Limit Maturity
Maturity Date : 2046-03-03
Maturity Price : 16.84
Evaluated at bid price : 16.84
Bid-YTW : 4.64 %
BAM.PF.G FixedReset 1.70 % YTW SCENARIO
Maturity Type : Limit Maturity
Maturity Date : 2046-03-03
Maturity Price : 17.95
Evaluated at bid price : 17.95
Bid-YTW : 5.32 %
FTS.PR.M FixedReset 1.78 % YTW SCENARIO
Maturity Type : Limit Maturity
Maturity Date : 2046-03-03
Maturity Price : 16.60
Evaluated at bid price : 16.60
Bid-YTW : 5.06 %
MFC.PR.K FixedReset 1.85 % YTW SCENARIO
Maturity Type : Hard Maturity
Maturity Date : 2025-01-31
Maturity Price : 25.00
Evaluated at bid price : 15.39
Bid-YTW : 9.77 %
MFC.PR.F FixedReset 1.86 % YTW SCENARIO
Maturity Type : Hard Maturity
Maturity Date : 2025-01-31
Maturity Price : 25.00
Evaluated at bid price : 12.62
Bid-YTW : 10.93 %
MFC.PR.J FixedReset 1.91 % YTW SCENARIO
Maturity Type : Hard Maturity
Maturity Date : 2025-01-31
Maturity Price : 25.00
Evaluated at bid price : 16.51
Bid-YTW : 9.13 %
HSE.PR.G FixedReset 1.99 % YTW SCENARIO
Maturity Type : Limit Maturity
Maturity Date : 2046-03-03
Maturity Price : 16.88
Evaluated at bid price : 16.88
Bid-YTW : 6.50 %
BAM.PR.B Floater 2.03 % YTW SCENARIO
Maturity Type : Limit Maturity
Maturity Date : 2046-03-03
Maturity Price : 10.05
Evaluated at bid price : 10.05
Bid-YTW : 4.77 %
BAM.PR.C Floater 2.05 % YTW SCENARIO
Maturity Type : Limit Maturity
Maturity Date : 2046-03-03
Maturity Price : 9.95
Evaluated at bid price : 9.95
Bid-YTW : 4.82 %
BAM.PF.E FixedReset 2.07 % YTW SCENARIO
Maturity Type : Limit Maturity
Maturity Date : 2046-03-03
Maturity Price : 17.25
Evaluated at bid price : 17.25
Bid-YTW : 5.15 %
BAM.PR.G FixedFloater 2.16 % YTW SCENARIO
Maturity Type : Limit Maturity
Maturity Date : 2046-03-03
Maturity Price : 25.00
Evaluated at bid price : 12.77
Bid-YTW : 6.53 %
HSE.PR.E FixedReset 2.25 % YTW SCENARIO
Maturity Type : Limit Maturity
Maturity Date : 2046-03-03
Maturity Price : 16.79
Evaluated at bid price : 16.79
Bid-YTW : 6.54 %
BAM.PF.F FixedReset 2.49 % YTW SCENARIO
Maturity Type : Limit Maturity
Maturity Date : 2046-03-03
Maturity Price : 17.68
Evaluated at bid price : 17.68
Bid-YTW : 5.37 %
RY.PR.M FixedReset 2.70 % YTW SCENARIO
Maturity Type : Limit Maturity
Maturity Date : 2046-03-03
Maturity Price : 17.87
Evaluated at bid price : 17.87
Bid-YTW : 4.74 %
BAM.PR.Z FixedReset 2.80 % YTW SCENARIO
Maturity Type : Limit Maturity
Maturity Date : 2046-03-03
Maturity Price : 17.65
Evaluated at bid price : 17.65
Bid-YTW : 5.42 %
TRP.PR.B FixedReset 2.88 % YTW SCENARIO
Maturity Type : Limit Maturity
Maturity Date : 2046-03-03
Maturity Price : 10.70
Evaluated at bid price : 10.70
Bid-YTW : 4.65 %
BIP.PR.A FixedReset 2.90 % YTW SCENARIO
Maturity Type : Limit Maturity
Maturity Date : 2046-03-03
Maturity Price : 17.75
Evaluated at bid price : 17.75
Bid-YTW : 6.06 %
HSE.PR.C FixedReset 2.93 % YTW SCENARIO
Maturity Type : Limit Maturity
Maturity Date : 2046-03-03
Maturity Price : 15.10
Evaluated at bid price : 15.10
Bid-YTW : 6.72 %
CM.PR.O FixedReset 3.01 % YTW SCENARIO
Maturity Type : Limit Maturity
Maturity Date : 2046-03-03
Maturity Price : 17.11
Evaluated at bid price : 17.11
Bid-YTW : 4.68 %
MFC.PR.G FixedReset 3.09 % YTW SCENARIO
Maturity Type : Hard Maturity
Maturity Date : 2025-01-31
Maturity Price : 25.00
Evaluated at bid price : 17.00
Bid-YTW : 8.93 %
BAM.PR.K Floater 3.18 % YTW SCENARIO
Maturity Type : Limit Maturity
Maturity Date : 2046-03-03
Maturity Price : 10.06
Evaluated at bid price : 10.06
Bid-YTW : 4.76 %
RY.PR.J FixedReset 3.25 % YTW SCENARIO
Maturity Type : Limit Maturity
Maturity Date : 2046-03-03
Maturity Price : 18.13
Evaluated at bid price : 18.13
Bid-YTW : 4.79 %
BMO.PR.Q FixedReset 3.32 % YTW SCENARIO
Maturity Type : Hard Maturity
Maturity Date : 2022-01-31
Maturity Price : 25.00
Evaluated at bid price : 18.65
Bid-YTW : 7.37 %
TRP.PR.C FixedReset 3.41 % YTW SCENARIO
Maturity Type : Limit Maturity
Maturity Date : 2046-03-03
Maturity Price : 11.22
Evaluated at bid price : 11.22
Bid-YTW : 5.00 %
TRP.PR.F FloatingReset 3.60 % YTW SCENARIO
Maturity Type : Limit Maturity
Maturity Date : 2046-03-03
Maturity Price : 11.21
Evaluated at bid price : 11.21
Bid-YTW : 5.24 %
TRP.PR.E FixedReset 3.64 % YTW SCENARIO
Maturity Type : Limit Maturity
Maturity Date : 2046-03-03
Maturity Price : 17.95
Evaluated at bid price : 17.95
Bid-YTW : 4.59 %
TRP.PR.A FixedReset 3.65 % YTW SCENARIO
Maturity Type : Limit Maturity
Maturity Date : 2046-03-03
Maturity Price : 14.20
Evaluated at bid price : 14.20
Bid-YTW : 4.79 %
BAM.PR.T FixedReset 3.79 % YTW SCENARIO
Maturity Type : Limit Maturity
Maturity Date : 2046-03-03
Maturity Price : 14.50
Evaluated at bid price : 14.50
Bid-YTW : 5.39 %
BAM.PF.B FixedReset 4.11 % YTW SCENARIO
Maturity Type : Limit Maturity
Maturity Date : 2046-03-03
Maturity Price : 16.71
Evaluated at bid price : 16.71
Bid-YTW : 5.27 %
BAM.PF.A FixedReset 4.19 % YTW SCENARIO
Maturity Type : Limit Maturity
Maturity Date : 2046-03-03
Maturity Price : 17.66
Evaluated at bid price : 17.66
Bid-YTW : 5.34 %
TRP.PR.D FixedReset 4.81 % YTW SCENARIO
Maturity Type : Limit Maturity
Maturity Date : 2046-03-03
Maturity Price : 16.98
Evaluated at bid price : 16.98
Bid-YTW : 4.78 %
TRP.PR.G FixedReset 5.08 % YTW SCENARIO
Maturity Type : Limit Maturity
Maturity Date : 2046-03-03
Maturity Price : 18.60
Evaluated at bid price : 18.60
Bid-YTW : 4.96 %
TRP.PR.I FloatingReset 7.44 % YTW SCENARIO
Maturity Type : Limit Maturity
Maturity Date : 2046-03-03
Maturity Price : 10.25
Evaluated at bid price : 10.25
Bid-YTW : 4.86 %
Volume Highlights
Issue Index Shares
Traded
Notes
BMO.PR.W FixedReset 99,180 RBC crossed 68,000 at 16.45.
YTW SCENARIO
Maturity Type : Limit Maturity
Maturity Date : 2046-03-03
Maturity Price : 16.59
Evaluated at bid price : 16.59
Bid-YTW : 4.65 %
TD.PF.G FixedReset 86,302 YTW SCENARIO
Maturity Type : Limit Maturity
Maturity Date : 2046-03-03
Maturity Price : 23.28
Evaluated at bid price : 25.41
Bid-YTW : 5.25 %
BNS.PR.E FixedReset 73,858 YTW SCENARIO
Maturity Type : Limit Maturity
Maturity Date : 2046-03-03
Maturity Price : 23.27
Evaluated at bid price : 25.37
Bid-YTW : 5.18 %
NA.PR.X FixedReset 72,223 Nesbitt crossed 39,000 at 25.17.
YTW SCENARIO
Maturity Type : Limit Maturity
Maturity Date : 2046-03-03
Maturity Price : 23.20
Evaluated at bid price : 25.17
Bid-YTW : 5.51 %
MFC.PR.O FixedReset 66,145 Recent new issue.
YTW SCENARIO
Maturity Type : Call
Maturity Date : 2021-06-19
Maturity Price : 25.00
Evaluated at bid price : 25.20
Bid-YTW : 5.49 %
HSE.PR.A FixedReset 56,150 YTW SCENARIO
Maturity Type : Limit Maturity
Maturity Date : 2046-03-03
Maturity Price : 8.60
Evaluated at bid price : 8.60
Bid-YTW : 7.12 %
There were 30 other index-included issues trading in excess of 10,000 shares.
Wide Spread Highlights
Issue Index Quote Data and Yield Notes
HSE.PR.G FixedReset Quote: 16.88 – 24.50
Spot Rate : 7.6200
Average : 4.2889

YTW SCENARIO
Maturity Type : Limit Maturity
Maturity Date : 2046-03-03
Maturity Price : 16.88
Evaluated at bid price : 16.88
Bid-YTW : 6.50 %

PWF.PR.Q FloatingReset Quote: 10.50 – 12.05
Spot Rate : 1.5500
Average : 1.3123

YTW SCENARIO
Maturity Type : Limit Maturity
Maturity Date : 2046-03-03
Maturity Price : 10.50
Evaluated at bid price : 10.50
Bid-YTW : 4.89 %

CM.PR.Q FixedReset Quote: 17.84 – 18.50
Spot Rate : 0.6600
Average : 0.4432

YTW SCENARIO
Maturity Type : Limit Maturity
Maturity Date : 2046-03-03
Maturity Price : 17.84
Evaluated at bid price : 17.84
Bid-YTW : 4.95 %

MFC.PR.L FixedReset Quote: 15.78 – 16.39
Spot Rate : 0.6100
Average : 0.4169

YTW SCENARIO
Maturity Type : Hard Maturity
Maturity Date : 2025-01-31
Maturity Price : 25.00
Evaluated at bid price : 15.78
Bid-YTW : 9.55 %

MFC.PR.K FixedReset Quote: 15.39 – 16.01
Spot Rate : 0.6200
Average : 0.4367

YTW SCENARIO
Maturity Type : Hard Maturity
Maturity Date : 2025-01-31
Maturity Price : 25.00
Evaluated at bid price : 15.39
Bid-YTW : 9.77 %

BNS.PR.C FloatingReset Quote: 20.77 – 21.59
Spot Rate : 0.8200
Average : 0.6386

YTW SCENARIO
Maturity Type : Hard Maturity
Maturity Date : 2022-01-31
Maturity Price : 25.00
Evaluated at bid price : 20.77
Bid-YTW : 5.69 %

New Issue: BNS FixedReset, 5.50%+472, NVCC

March 3rd, 2016

The Bank of Nova Scotia has announced:

a domestic public offering of Non-cumulative 5-Year Rate Reset Preferred Shares Series 36 (Non-Viability Contingent Capital (NVCC)) (the “Preferred Shares Series 36”).

Scotiabank has agreed to sell 12 million of Preferred Shares Series 36 to a syndicate of underwriters led by Scotia Capital Inc. on a bought deal basis. Scotiabank has granted the Underwriters an option, exercisable in whole or in part up to 48 hours before closing, to purchase up to an additional 2 million Preferred Shares Series 36 at the same offering price.

Scotiabank will issue Preferred Shares Series 36 priced at $25 per share and holders will be entitled to receive a non-cumulative quarterly fixed dividend, as and when declared by the Board of Directors of Scotiabank, for the initial period ending on and including July 25, 2021 at an annual rate of $1.3750 per share to yield 5.50 per cent annually.

On July 26, 2021 and on July 26 every five years thereafter, Scotiabank may, at its option, with the prior approval of the Superintendent of Financial Institutions (Canada), redeem all or any number of the then outstanding Preferred Shares Series 36 at a redemption price which is equal to par. Thereafter, the dividend rate will reset every five years at a rate equal to 4.72% over the 5-year Government of Canada bond yield. Holders of Preferred Shares Series 36 will, subject to certain conditions, have the right to convert all or any part of their shares to Non-cumulative Floating Rate Preferred Shares Series 37 (Non-Viability Contingent Capital (NVCC)) (the “Preferred Shares Series 37”) of Scotiabank on July 26, 2021 and on July 26 every five years thereafter.

Holders of the Preferred Shares Series 37 will be entitled to receive a non-cumulative quarterly floating dividend at a rate equal to the 3-month Government of Canada Treasury Bill yield plus 4.72%, as and when declared by the Board of Directors of Scotiabank. Holders of Preferred Shares Series 37 will, subject to certain conditions, have the right to convert all or any part of their shares to Preferred Shares Series 36 on July 26, 2026 and on July 26 every five years thereafter.

Closing is expected to occur on or after March 14, 2016. This domestic public offering is part of Scotiabank’s ongoing and proactive management of its Tier 1 capital structure.

Net proceeds from this transaction will be added to Scotiabank’s funds and will be used for general business purposes.

They later announced:

that as a result of strong investor demand for its previously announced domestic public offering of Non-cumulative 5-Year Rate Reset Preferred Shares Series 36 (Non-Viability Contingent Capital (NVCC)) (the “Preferred Shares Series 36”), the size of the offering has been increased to 20 million shares. The gross proceeds of the offering will now be $500 million. The offering will be underwritten by a syndicate of underwriters led by Scotia Capital Inc.

Closing is expected to occur on or after March 14, 2016. This domestic public offering is part of Scotiabank’s ongoing and proactive management of its Tier 1 capital structure. Scotiabank intends to file a prospectus supplement to its June 27, 2014 base shelf prospectus in respect of this issue.

Net proceeds from this transaction will be added to Scotiabank’s funds and will be used for general business purposes.

$500-million is good size!

Implied Volatility analysis is not very useful for the BNS series, but when performed anyway yields the following chart:

impVol_BNS_160303
Click for Big

The reason this analysis is not particularly useful is that the four lower-spread issues are NVCC Non-Compliant while the two higher-spread issues are compliant (the new issue is one of these, with a deemed price of 25.00). So there are really two separate series, with not enough data to examine the compliant issues only.

However, this new issue appears to be quite cheap relative to BNS.PR.E, which is a FixedReset, 5.50%+451, that commenced trading 2016-12-17 after being announced 2015-12-8. At today’s closing bid of 25.37, BNS.PR.E has an Expected Future Current Yield (EFCY) of 5.11%, compared to 5.40% for the new issue given a deemed price of 25.00. So the 21bp of extra spread are resulting in an expected EFCY pick-up of 29bp compared to a normally expected (as of the February PrefLetter, Table FR-11, Charts FR-31 and FR-58) pick-up of 2-8bp.

To make the EFCY pick-up for the new issue equal to 5bp – to strike a happy medium – its price would have to be about 26.15 (given a price of 25.37 for BNS.PR.E) so I suspect we’ll see a certain amount of price adjustment between the two issues!

Regrettably, BNS does not have any NVCC-compliant Straight Perpetuals trading, so it is impossible to compute Break Even Rate Shock.