A weak jobs number pushed up Treasuries:
Treasuries surged, sending yields to two-month lows, after a report showed the economy added the fewest jobs since December 2013, damping the outlook for the timing of interest-rate increases by the Federal Reserve.
Futures showed traders pushed out expectations for central bank to begin tightening monetary policy into next year. The 126,000 increase in March was weaker than the most pessimistic forecast in a Bloomberg survey. Traders had speculated that the Fed could raise rates as soon as September with strength in the labor market offsetting weakness elsewhere.
…
Yields on benchmark 10-year notes fell seven basis points to 1.84 percent at 12:00 p.m. New York time, according to Bloomberg Bond Trader prices. The yield dropped as low as 1.80 percent, the least since Feb. 6. The 2 percent benchmark note due in February 2025 rose 21/32, or $6.56 per $1,000 face value, to 101 14/32.The rate for fed funds futures for December fell four basis points to 0.34 percent, indicating about one-in-three odds of a rate increase by the Fed’s meeting that month.
…
The median forecast in a Bloomberg survey called for a 245,000 increase. The unemployment rate held steady at 5.5 percent. Average hourly earnings rose 2.1 percent from a year earlier.
Atlanta Fed president Lockhart suggests a Fed hike in late summer:
Federal Reserve Bank of Atlanta President Dennis Lockhart said while recent economic weakness probably won’t persist, he favors pushing out the central bank’s first rate increase beyond the next two meetings.
“I would probably be biased toward the July or September dates as opposed to June,” Lockhart, who votes on monetary policy this year, said in an interview Monday. “We will have more data and we will give the economy a little more time to prove out the thesis that I laid out, that the first quarter was anomalous again, just like a year ago.”
…
“I’m not ready yet to conclude a slowdown is underway,” Lockhart said. He said he still expects “a moderate pace of growth between 2.5 percent and 3 percent” with “continued progress on employment and a firming up of the price data.”“I’m holding to the view that we will see a rebound in the second quarter and that we will see a resumption of stronger growth,” Lockhart said.
“It is still reasonable” for the Federal Open Market Committee to “deliberate about liftoff in the middle meetings of the year,” with June, July and September each meriting discussion. “I still think they should be on the table.”
New York Fed president Dudley is even more vague:
Federal Reserve Bank of New York President William C. Dudley said the path of interest-rate increases is likely to be “shallow” once the Fed starts to tighten, and recent economic weakness probably won’t persist.
The timing of the first rate increase since 2006 “will be data dependent and remains uncertain because the future evolution of the economy cannot be fully anticipated,” Dudley said in a speech Monday in Newark, New Jersey. “I anticipate that the path will be relatively shallow” as “headwinds in the aftermath of the financial crisis are still in evidence.”
…
If we raise interest rates and portfolios perform poorly, that’s likely to slow us down,” Dudley said in response to a question. On the other hand, “if financial market conditions do not tighten much in response to higher short-term interest rates, we might have to move more quickly,” he said in his prepared remarks.Stocks rebounded after Dudley’s comments. The Standard & Poor’s 500 Index climbed 0.8 percent to 2,083.87 at 12:23 p.m. after opening 0.5 percent lower.
I’m way behind on responding to comments. I will catch up.
It was a mixed day for the Canadian preferred share market, with PerpetualDiscounts off 3bp, FixedResets down 25bp and DeemedRetractibles gaining 7bp. FixedResets were dominant losers on the Performance Highlights table, particularly BAM issues. Volume was high.
For as long as the FixedReset market is so violently unsettled, I’ll keep publishing updates of the more interesting and meaningful series of FixedResets’ Implied Volatilities. This doesn’t include Enbridge because although Enbridge has a large number of issues outstanding, all of which are quite liquid, the range of Issue Reset Spreads is too small for decent conclusions. The low is 212bp (ENB.PR.H; second-lowest is ENB.PR.D at 237bp) and the high is a mere 268 for ENB.PF.G.
Remember that all rich /cheap assessments are:
» based on Implied Volatility Theory only
» are relative only to other FixedResets from the same issuer
» assume constant GOC-5 yield
» assume constant Implied Volatility
» assume constant spread
Here’s TRP:

Click for Big
TRP.PR.E, which resets 2019-10-30 at +235, is bid at 23.25 to be $0.65 rich, while TRP.PR.C, resetting 2016-01-30 at +154, is $1.01 cheap at its bid price of 16.00.

Click for Big
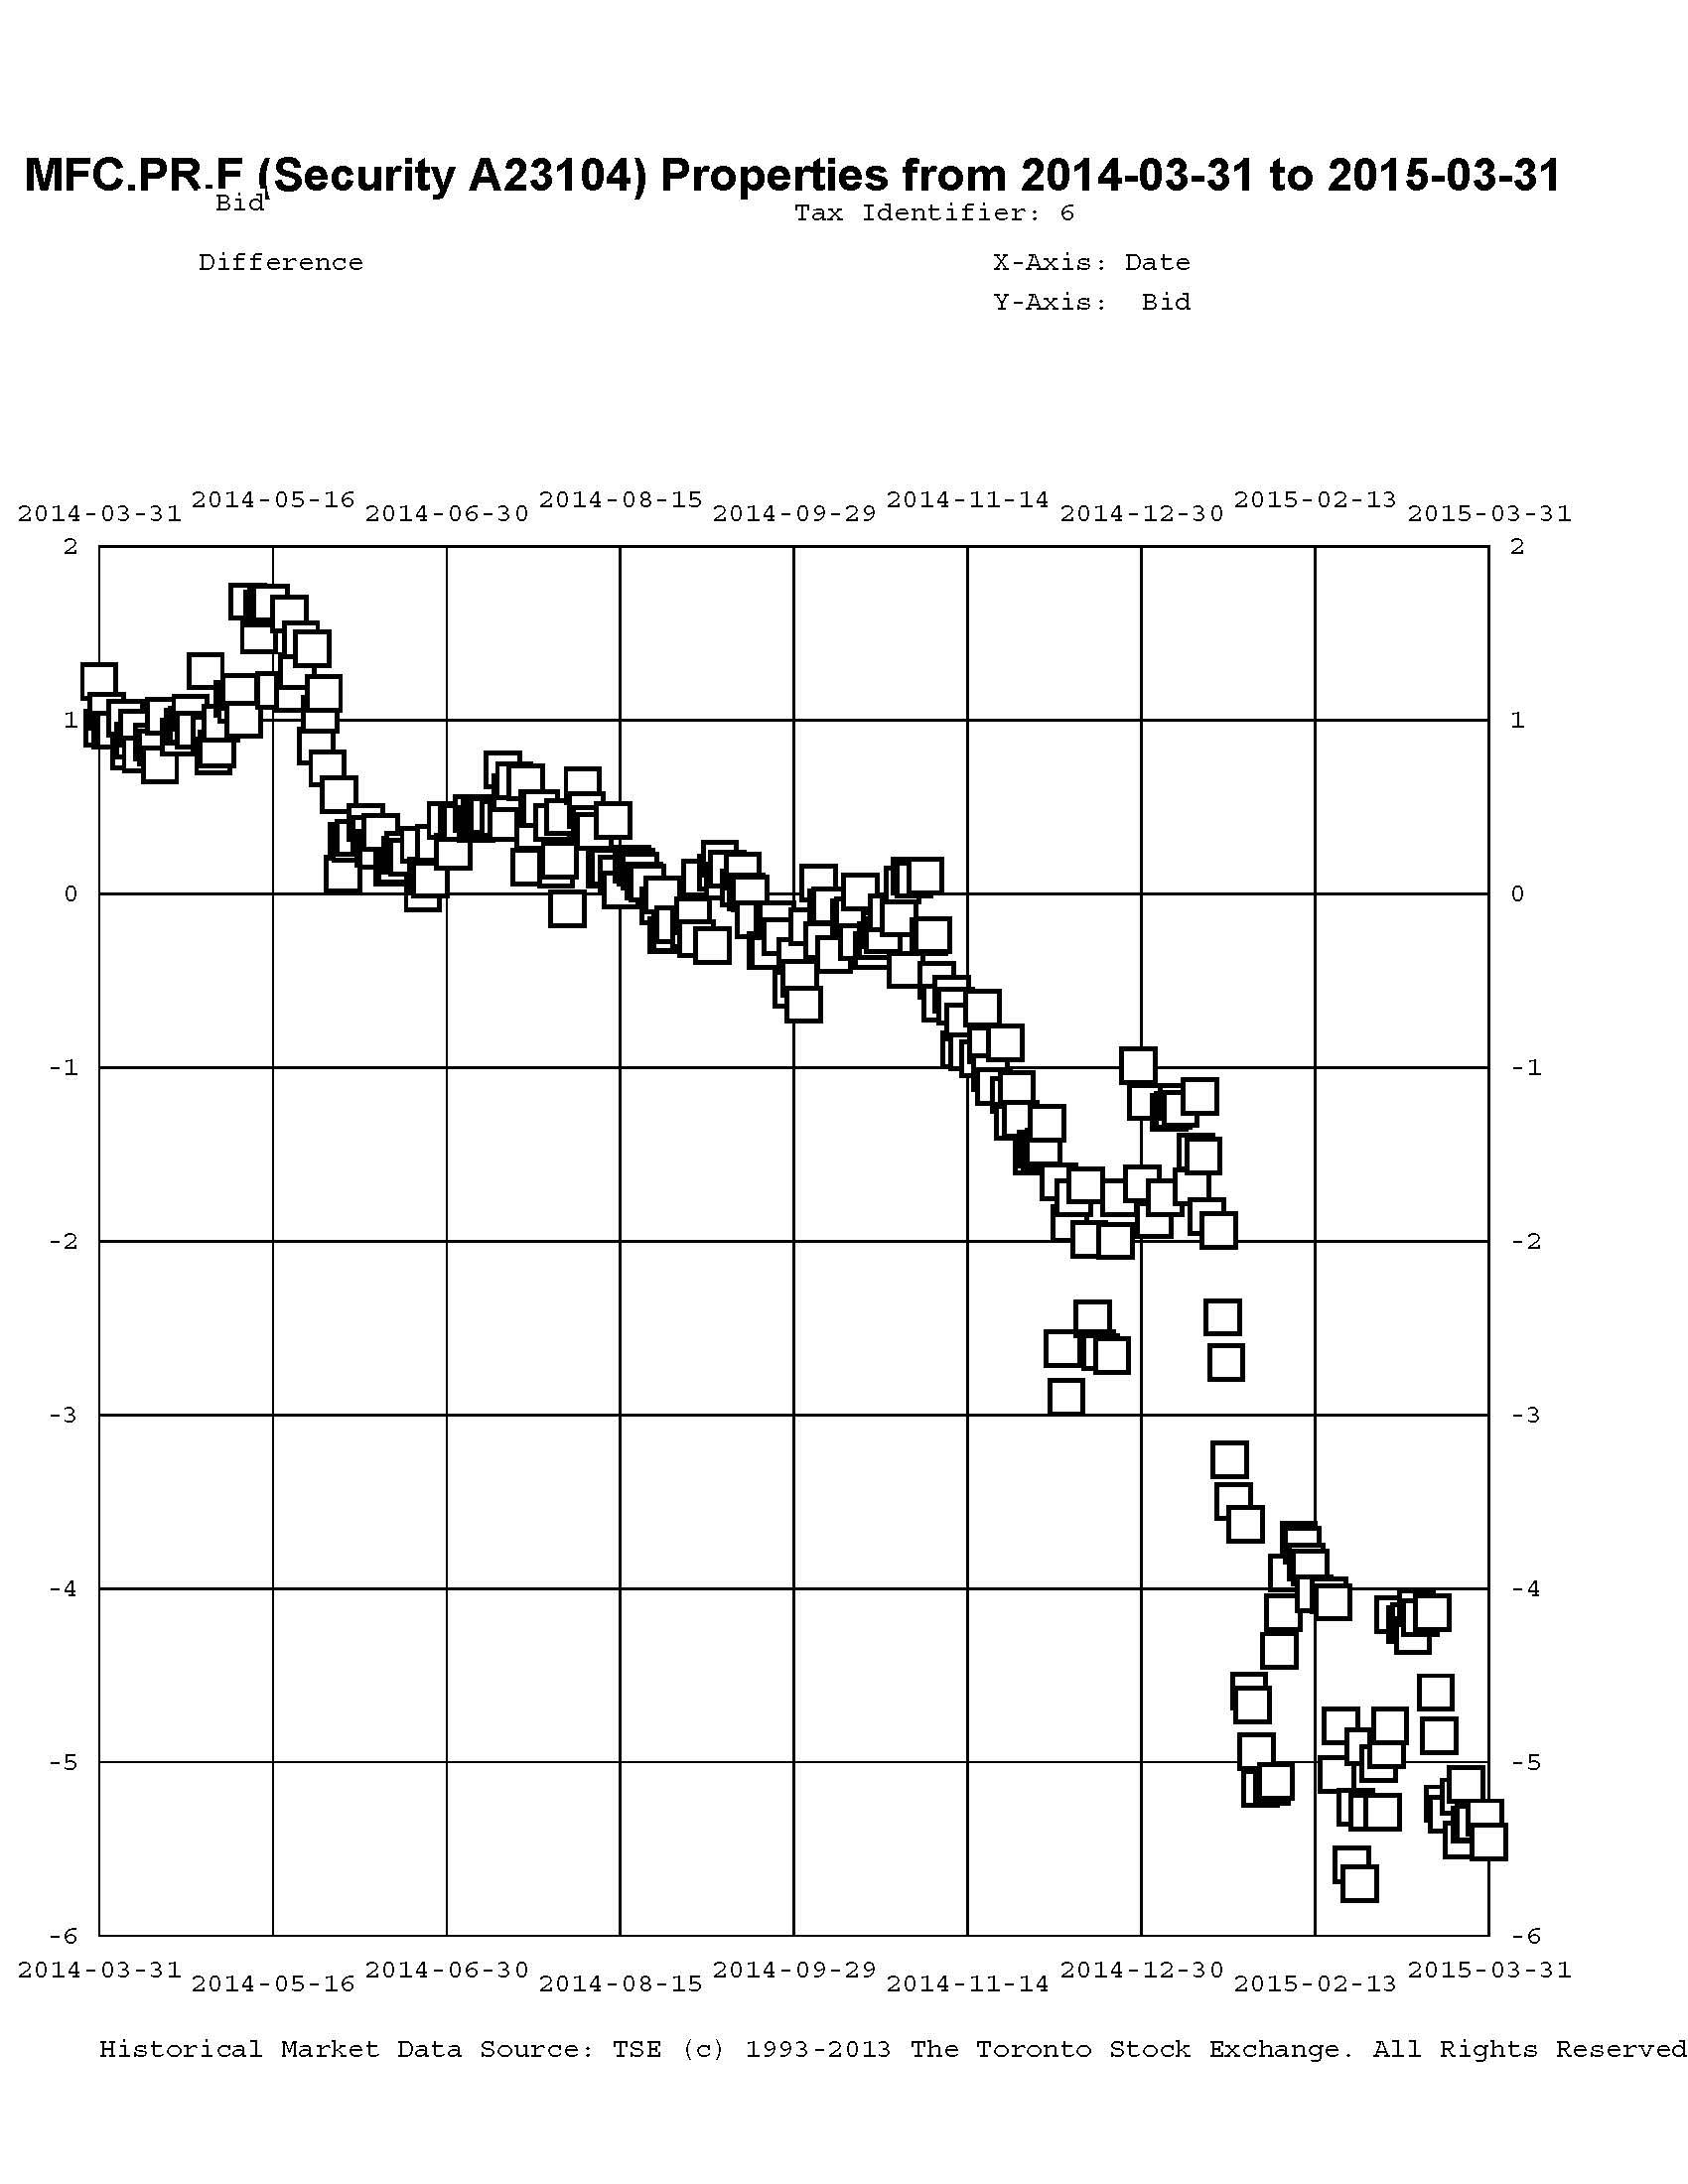
Another excellent fit, but the numbers are perplexing. Implied Volatility for MFC continues to be a conundrum, although it declined substantially today. It is still too high if we consider that NVCC rules will never apply to these issues; it is still too low if we consider them to be NVCC non-compliant issues (and therefore with Deemed Maturities in the call schedule).
Most expensive is MFC.PR.L, resetting at +216 on 2019-6-19, bid at 23.76 to be $0.64 rich, while MFC.PR.H, resetting at +313bp on 2017-3-19, is bid at 25.31 to be $0.76 cheap.

Click for Big
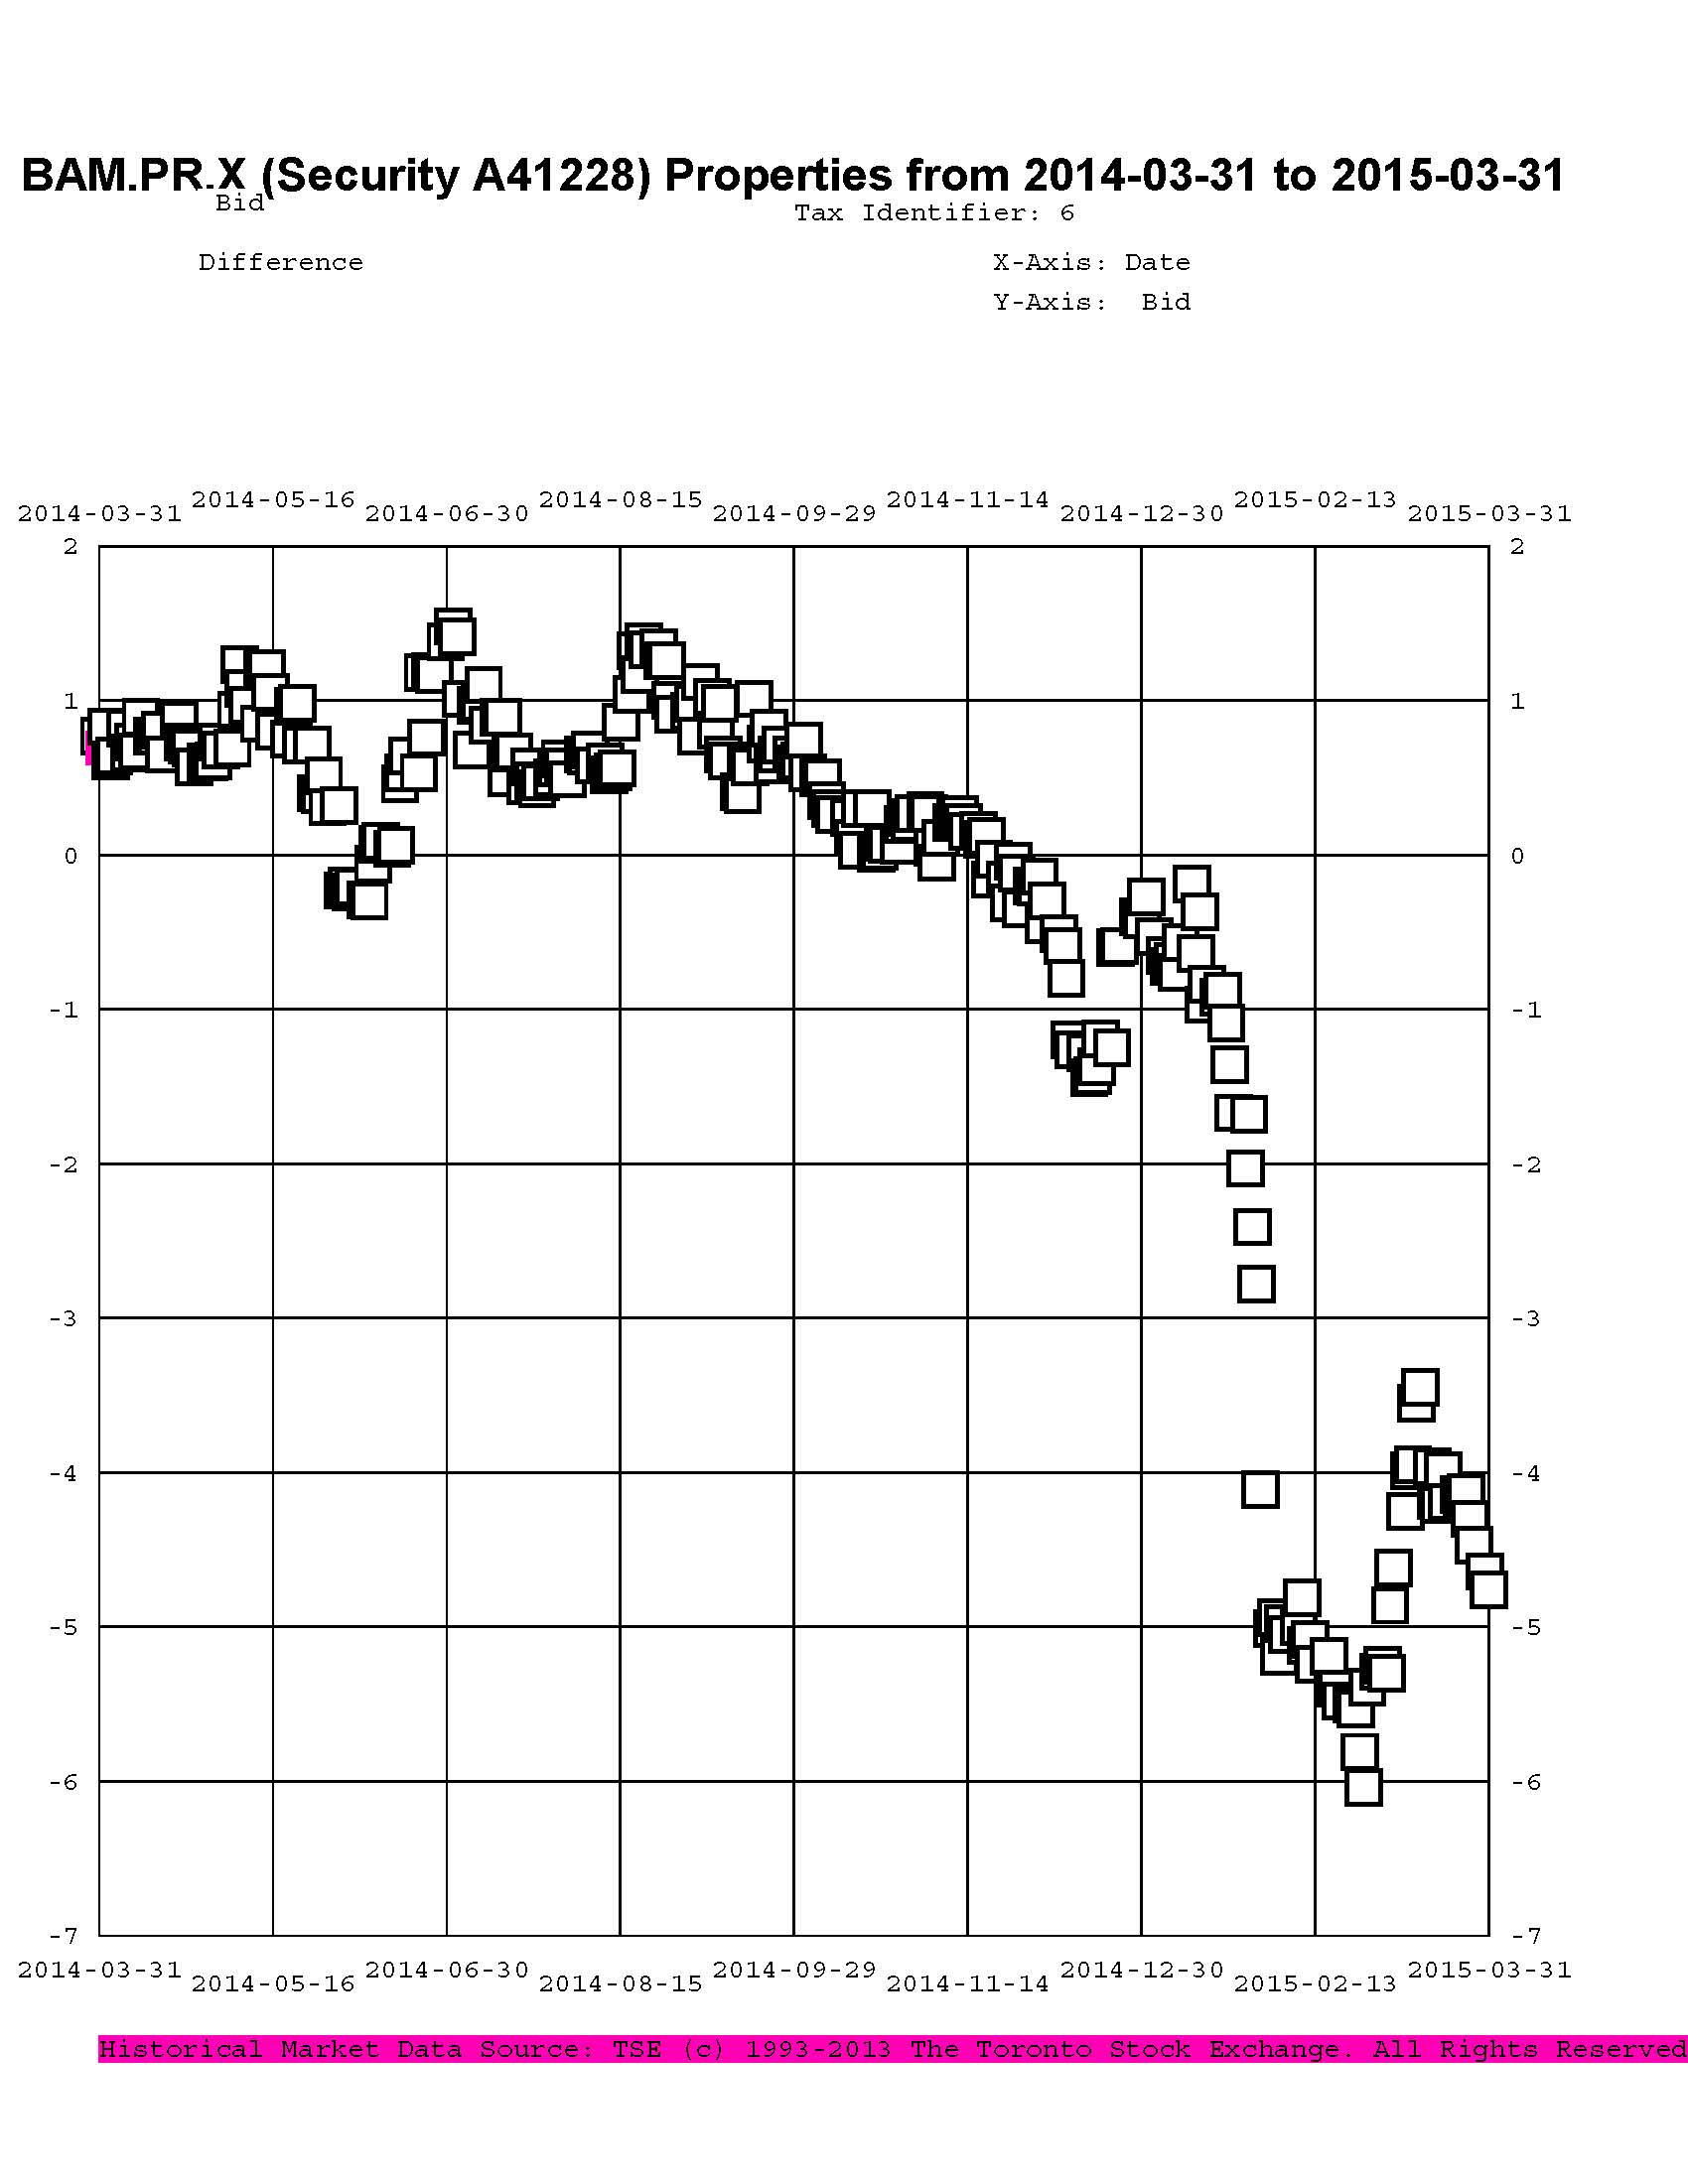
The fit on this series has suddenly become atrocious. It will be most interesting to see how long it takes for things to readjust.
The cheapest issue relative to its peers is BAM.PR.R, resetting at +230bp on 2016-6-30, bid at 19.21 to be $1.30 cheap. BAM.PF.E, resetting at +255bp 2020-3-31 is bid at 23.90 and appears to be $1.72 rich.

Click for Big
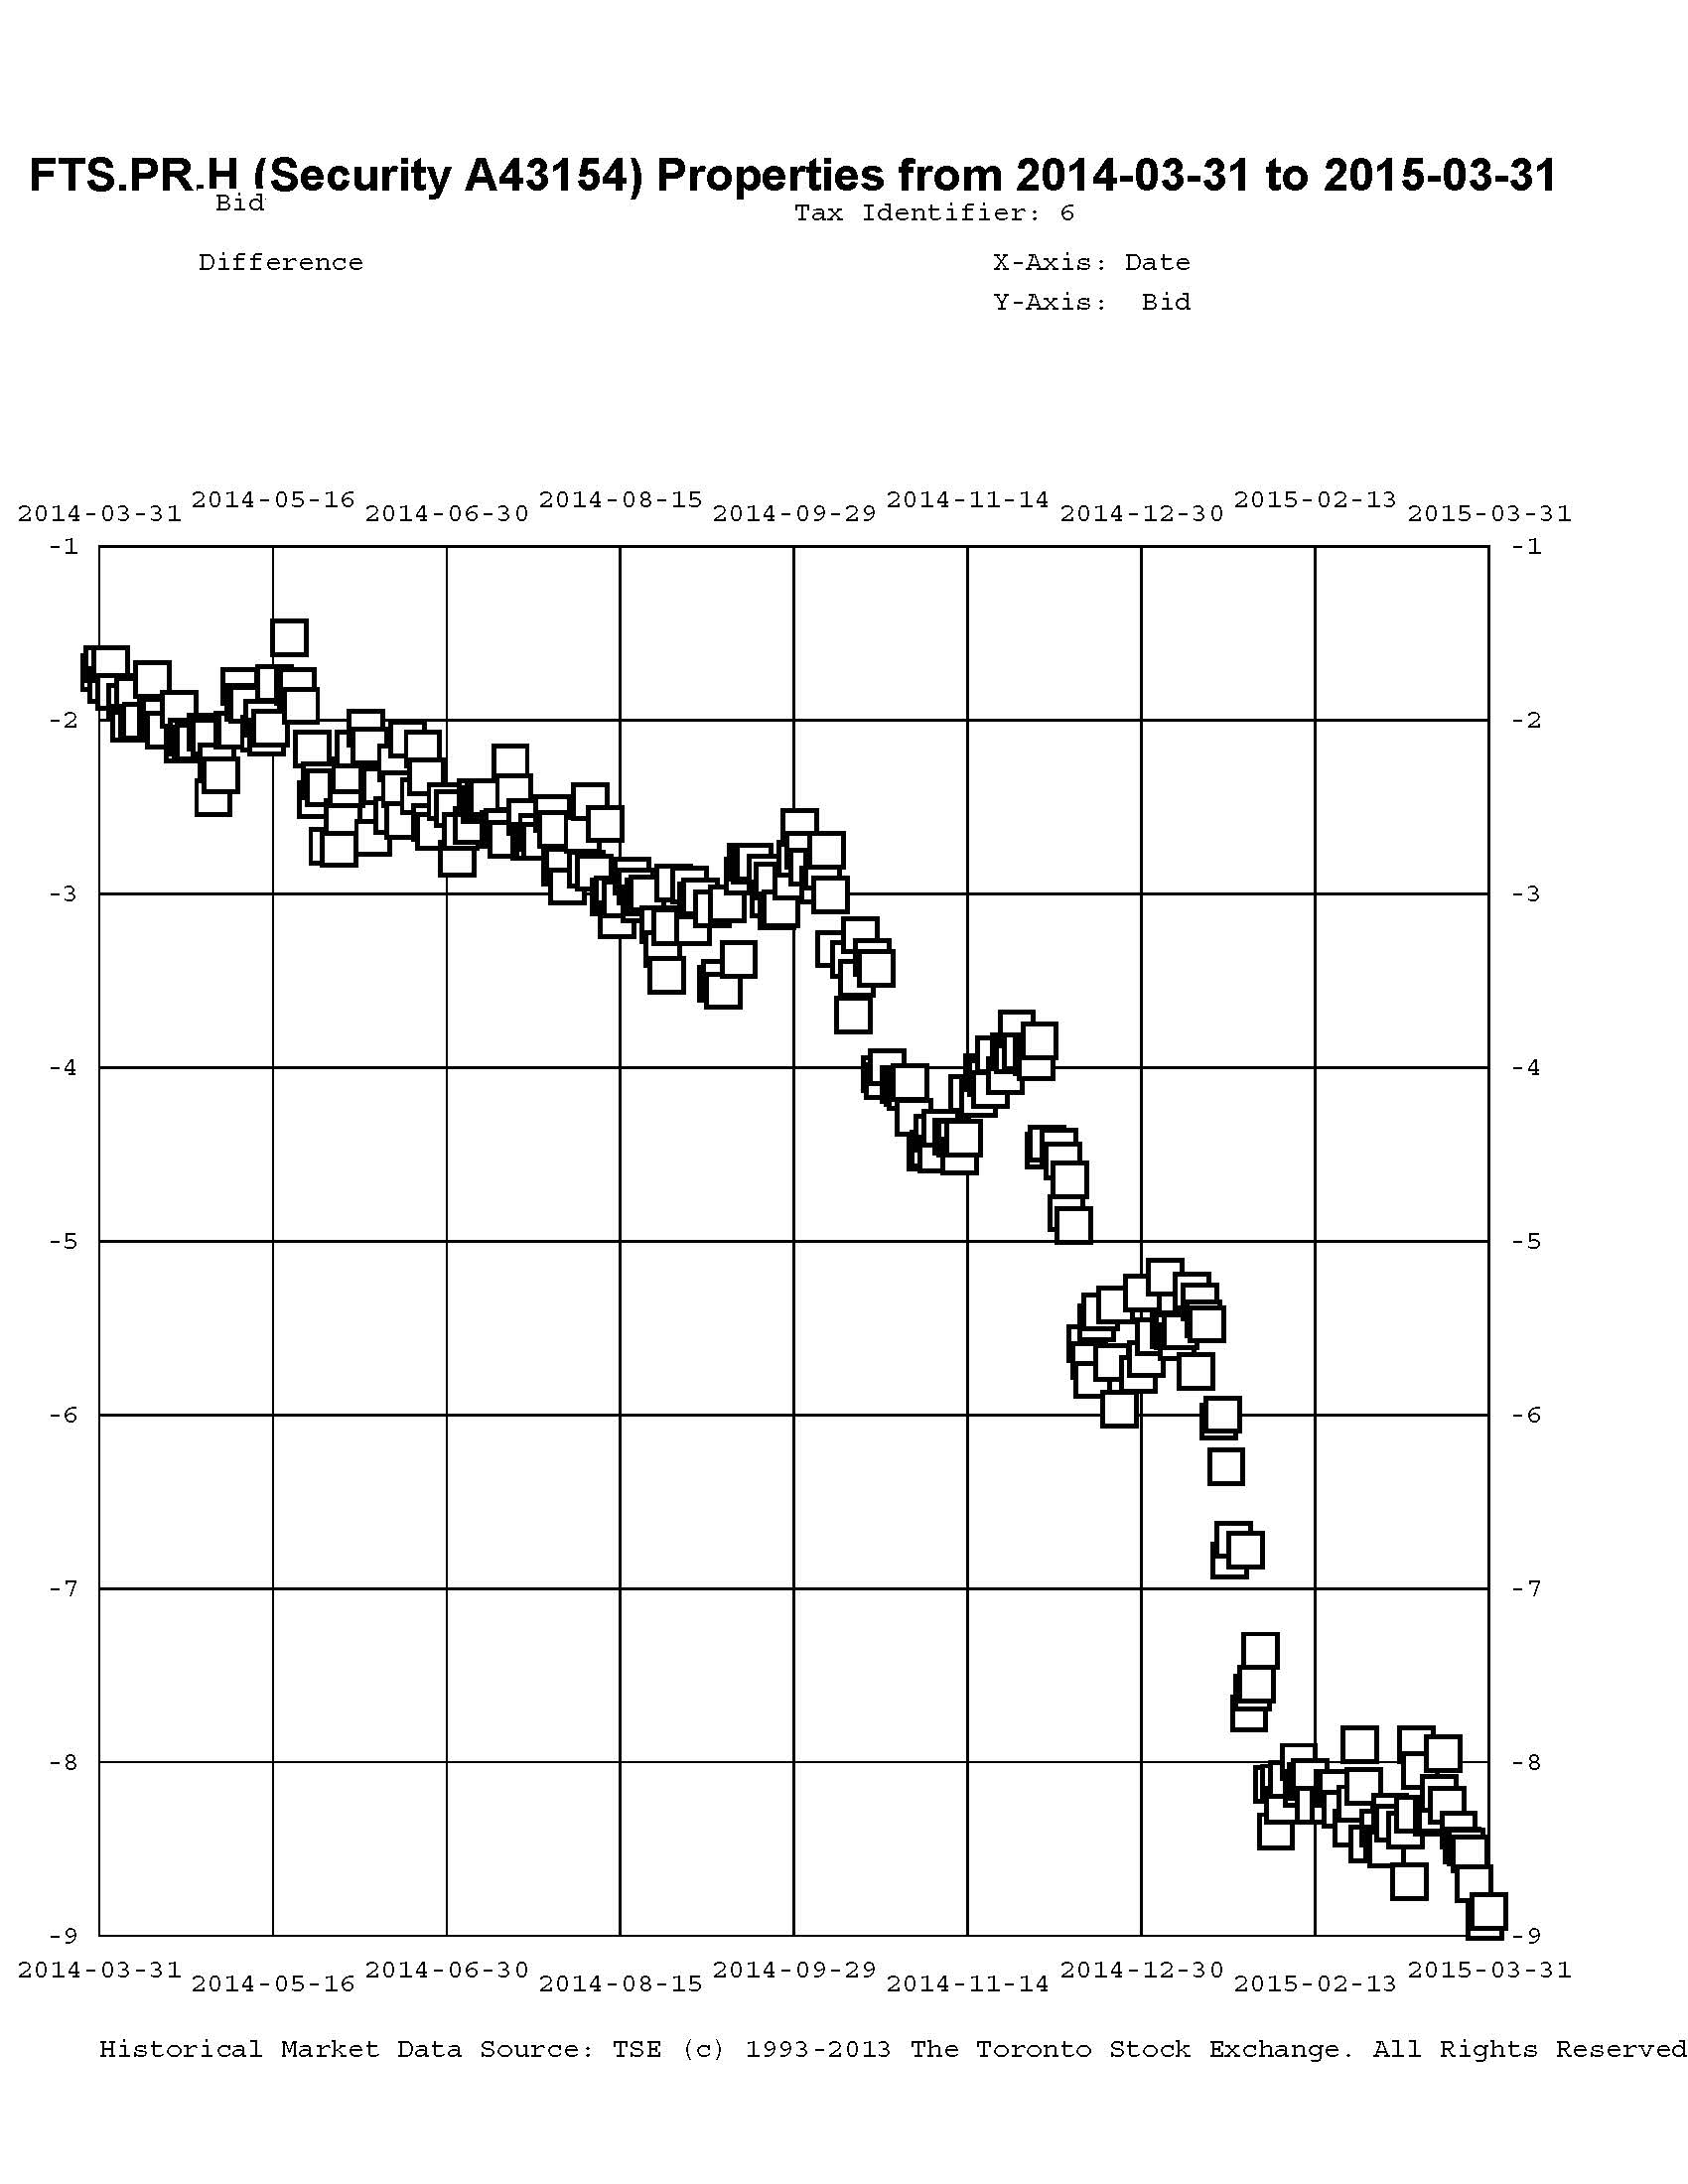
This is just weird because the middle is expensive and the ends are cheap but anyway … FTS.PR.H, with a spread of +145bp, and bid at 16.00, looks $1.65 cheap and resets 2015-6-1. FTS.PR.K, with a spread of +205bp and resetting 2019-3-1, is bid at 23.70 and is $1.29 rich.

Click for Big
Investment-grade pairs now predict an average over the next five years of about 0.35%, continuing the increase of last week. The DC.PR.B / DC.PR.D pair is still off the charts and now predicts an average bill rate over the next 4 3/4 years of -2.34%.

Click for Big
Shall we just say that this exhibits a high level of confidence in the continued rapacity of Canadian banks?
| HIMIPref™ Preferred Indices These values reflect the December 2008 revision of the HIMIPref™ Indices Values are provisional and are finalized monthly |
|||||||
| Index | Mean Current Yield (at bid) |
Median YTW |
Median Average Trading Value |
Median Mod Dur (YTW) |
Issues | Day’s Perf. | Index Value |
| Ratchet | 0.00 % | 0.00 % | 0 | 0.00 | 0 | -2.1678 % | 2,277.9 |
| FixedFloater | 0.00 % | 0.00 % | 0 | 0.00 | 0 | -2.1678 % | 3,982.8 |
| Floater | 3.18 % | 3.32 % | 59,639 | 18.98 | 4 | -2.1678 % | 2,421.6 |
| OpRet | 4.42 % | -4.81 % | 31,428 | 0.16 | 2 | 0.0982 % | 2,769.7 |
| SplitShare | 4.57 % | 4.68 % | 59,200 | 3.45 | 3 | 0.0534 % | 3,227.6 |
| Interest-Bearing | 0.00 % | 0.00 % | 0 | 0.00 | 0 | 0.0982 % | 2,532.6 |
| Perpetual-Premium | 5.27 % | 2.88 % | 59,248 | 0.09 | 25 | 0.0518 % | 2,529.1 |
| Perpetual-Discount | 5.06 % | 5.02 % | 149,974 | 15.18 | 9 | -0.0280 % | 2,820.3 |
| FixedReset | 4.48 % | 3.63 % | 264,485 | 16.45 | 85 | -0.2535 % | 2,383.2 |
| Deemed-Retractible | 4.91 % | 1.65 % | 111,208 | 0.14 | 37 | 0.0737 % | 2,661.1 |
| FloatingReset | 2.48 % | 2.89 % | 78,943 | 6.29 | 8 | 0.0521 % | 2,360.7 |
| Performance Highlights | |||
| Issue | Index | Change | Notes |
| BAM.PR.X | FixedReset | -4.01 % | YTW SCENARIO Maturity Type : Limit Maturity Maturity Date : 2045-04-06 Maturity Price : 17.01 Evaluated at bid price : 17.01 Bid-YTW : 4.11 % |
| BAM.PR.B | Floater | -3.58 % | YTW SCENARIO Maturity Type : Limit Maturity Maturity Date : 2045-04-06 Maturity Price : 15.10 Evaluated at bid price : 15.10 Bid-YTW : 3.32 % |
| BAM.PR.C | Floater | -2.72 % | YTW SCENARIO Maturity Type : Limit Maturity Maturity Date : 2045-04-06 Maturity Price : 15.00 Evaluated at bid price : 15.00 Bid-YTW : 3.34 % |
| BAM.PR.K | Floater | -2.30 % | YTW SCENARIO Maturity Type : Limit Maturity Maturity Date : 2045-04-06 Maturity Price : 14.85 Evaluated at bid price : 14.85 Bid-YTW : 3.37 % |
| HSE.PR.A | FixedReset | -1.80 % | YTW SCENARIO Maturity Type : Limit Maturity Maturity Date : 2045-04-06 Maturity Price : 16.41 Evaluated at bid price : 16.41 Bid-YTW : 3.93 % |
| IFC.PR.A | FixedReset | -1.78 % | YTW SCENARIO Maturity Type : Hard Maturity Maturity Date : 2025-01-31 Maturity Price : 25.00 Evaluated at bid price : 20.45 Bid-YTW : 5.45 % |
| BAM.PR.T | FixedReset | -1.72 % | YTW SCENARIO Maturity Type : Limit Maturity Maturity Date : 2045-04-06 Maturity Price : 19.43 Evaluated at bid price : 19.43 Bid-YTW : 4.14 % |
| BAM.PF.G | FixedReset | -1.42 % | YTW SCENARIO Maturity Type : Limit Maturity Maturity Date : 2045-04-06 Maturity Price : 22.89 Evaluated at bid price : 24.30 Bid-YTW : 3.85 % |
| ENB.PF.E | FixedReset | -1.23 % | YTW SCENARIO Maturity Type : Limit Maturity Maturity Date : 2045-04-06 Maturity Price : 20.81 Evaluated at bid price : 20.81 Bid-YTW : 4.47 % |
| TRP.PR.D | FixedReset | -1.21 % | YTW SCENARIO Maturity Type : Limit Maturity Maturity Date : 2045-04-06 Maturity Price : 22.23 Evaluated at bid price : 22.82 Bid-YTW : 3.57 % |
| BAM.PF.F | FixedReset | -1.11 % | YTW SCENARIO Maturity Type : Limit Maturity Maturity Date : 2045-04-06 Maturity Price : 22.86 Evaluated at bid price : 24.10 Bid-YTW : 3.88 % |
| ENB.PF.G | FixedReset | -1.05 % | YTW SCENARIO Maturity Type : Limit Maturity Maturity Date : 2045-04-06 Maturity Price : 20.83 Evaluated at bid price : 20.83 Bid-YTW : 4.50 % |
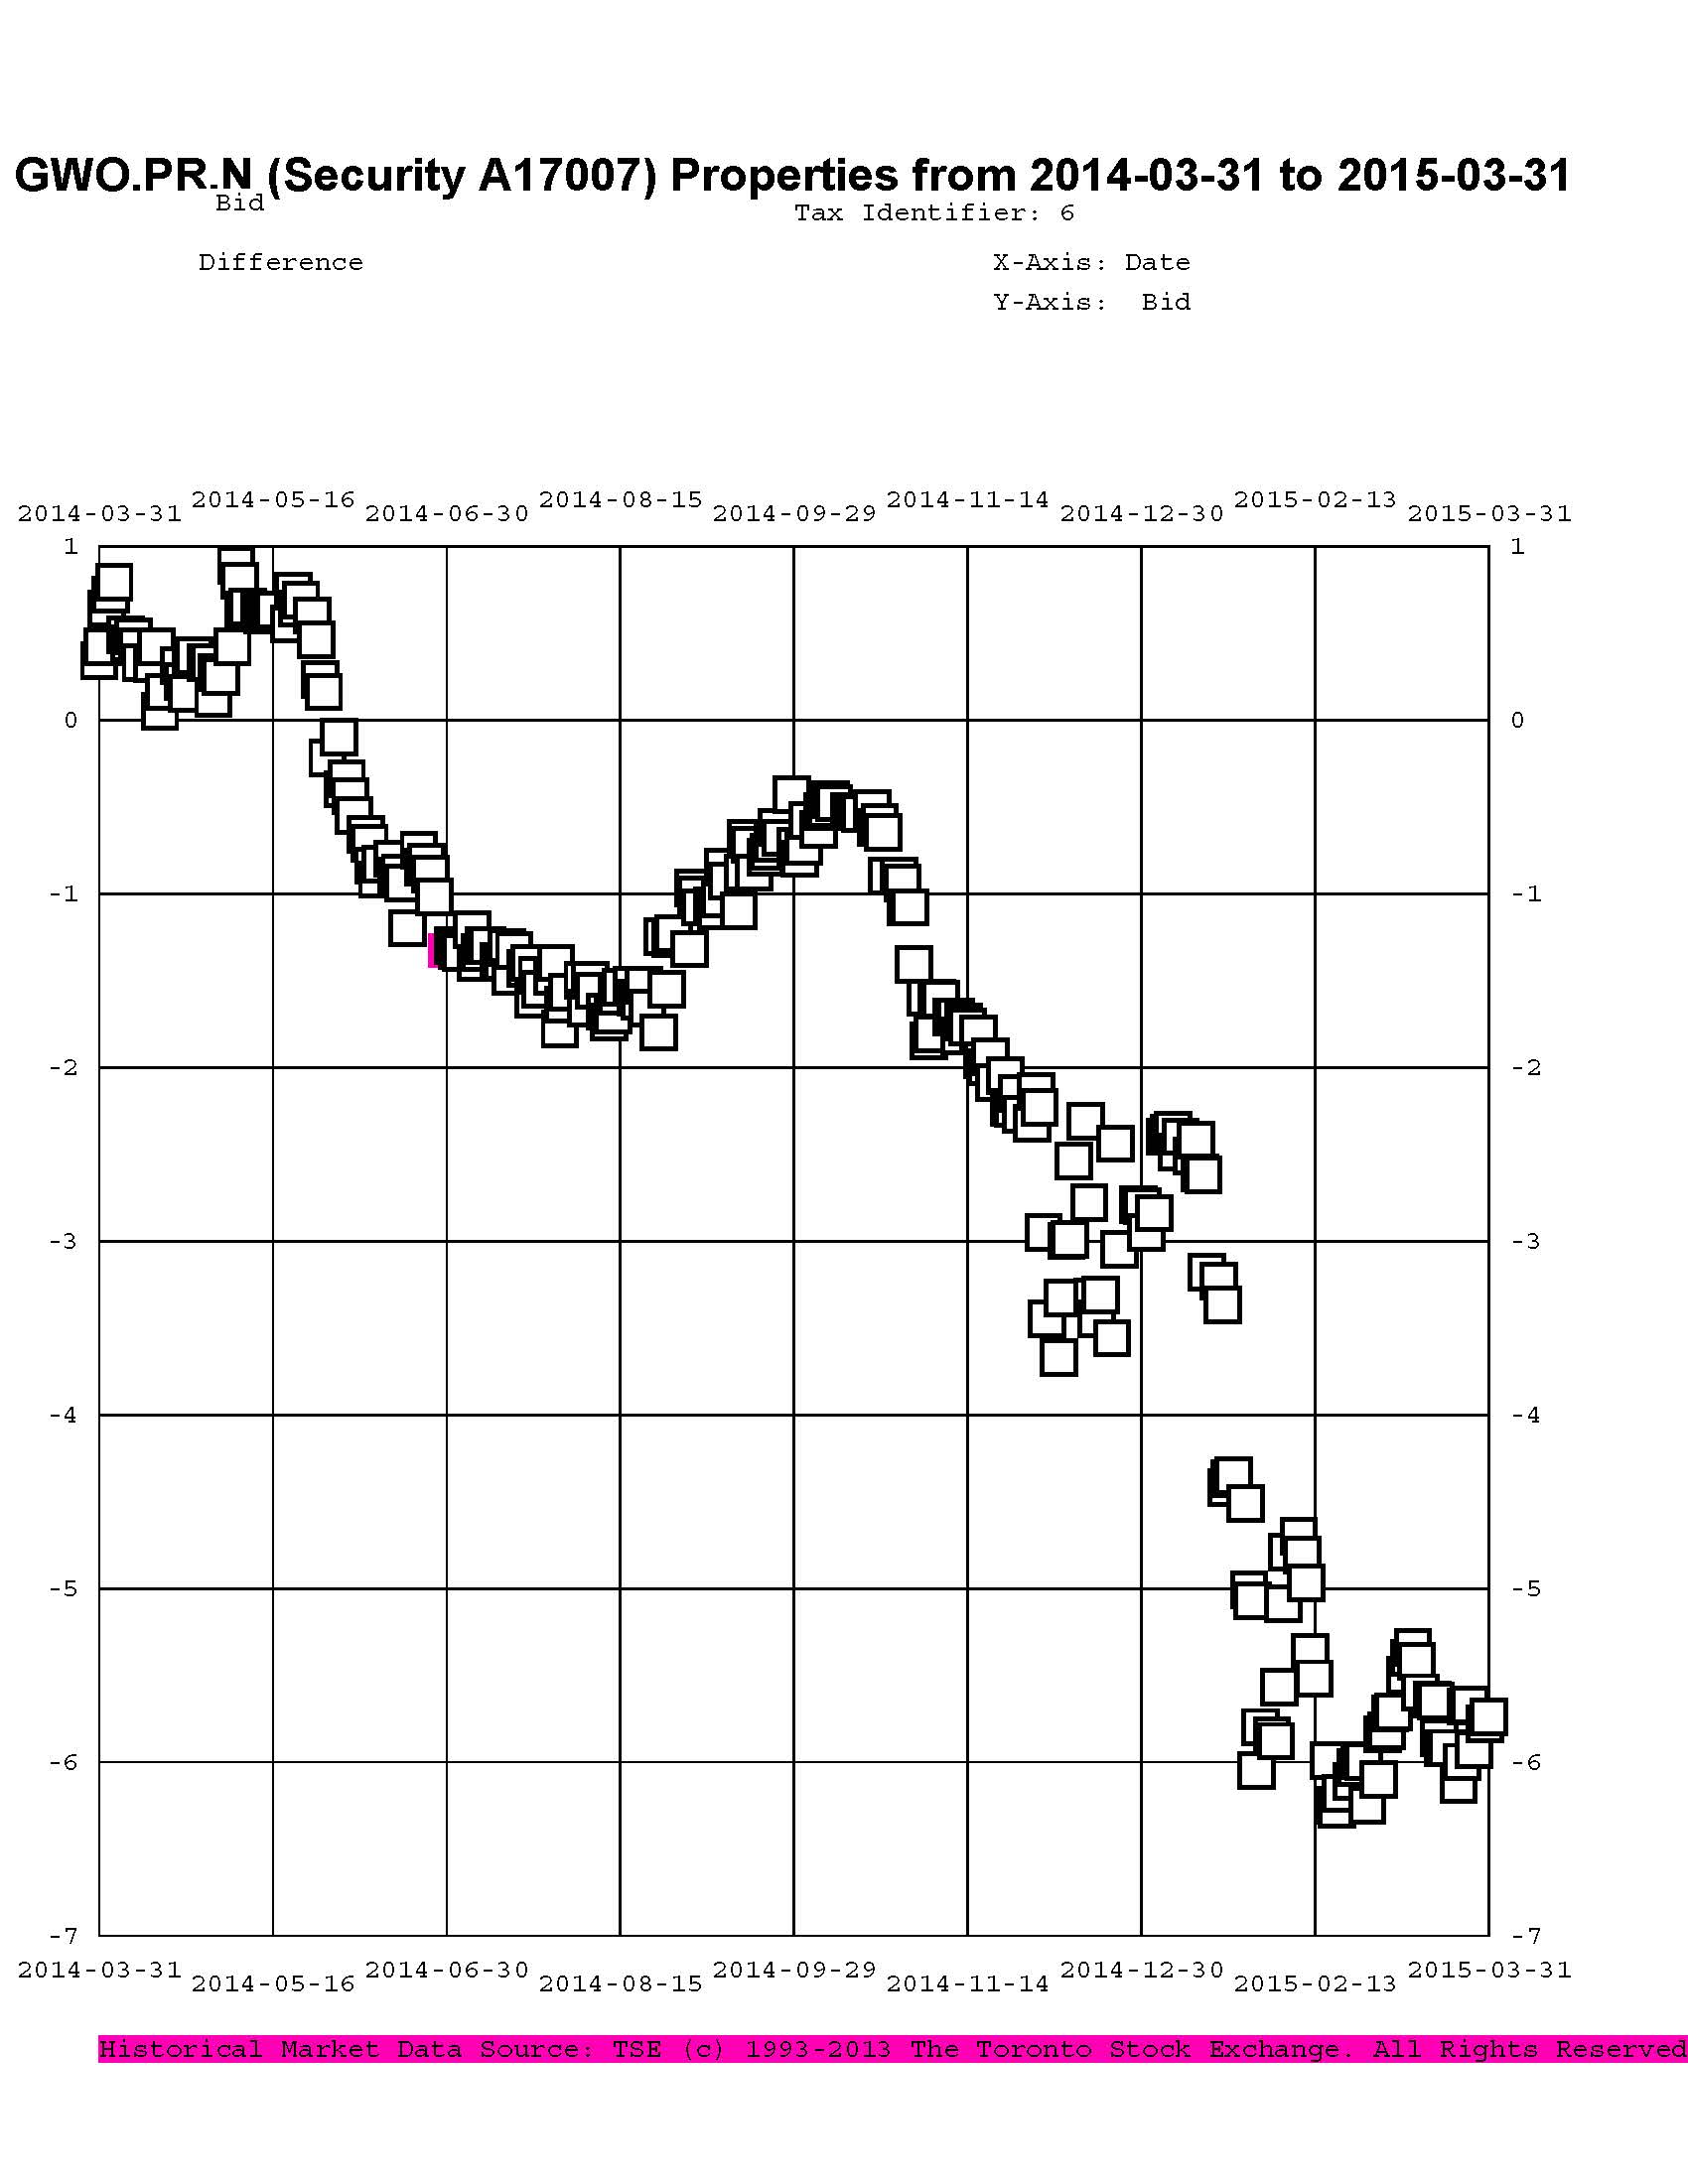
| MFC.PR.N | FixedReset | -1.04 % | YTW SCENARIO Maturity Type : Hard Maturity Maturity Date : 2025-01-31 Maturity Price : 25.00 Evaluated at bid price : 23.75 Bid-YTW : 4.12 % |
| CU.PR.D | Perpetual-Premium | 1.00 % | YTW SCENARIO Maturity Type : Limit Maturity Maturity Date : 2045-04-06 Maturity Price : 24.69 Evaluated at bid price : 25.16 Bid-YTW : 4.90 % |
| Volume Highlights | |||
| Issue | Index | Shares Traded |
Notes |
| RY.PR.M | FixedReset | 262,500 | Recent new issue. YTW SCENARIO Maturity Type : Limit Maturity Maturity Date : 2045-04-06 Maturity Price : 23.00 Evaluated at bid price : 24.65 Bid-YTW : 3.38 % |
| POW.PR.D | Perpetual-Discount | 83,323 | RBC bought blocks of 10,000 and 20,000 from GMP at 24.95, then crossed 39,000 at the same price. YTW SCENARIO Maturity Type : Limit Maturity Maturity Date : 2045-04-06 Maturity Price : 24.68 Evaluated at bid price : 24.95 Bid-YTW : 5.02 % |
| ENB.PR.F | FixedReset | 77,981 | Desjardins crossed 60,000 at 19.25. YTW SCENARIO Maturity Type : Limit Maturity Maturity Date : 2045-04-06 Maturity Price : 19.25 Evaluated at bid price : 19.25 Bid-YTW : 4.45 % |
| CM.PR.Q | FixedReset | 60,910 | Recent new issue. YTW SCENARIO Maturity Type : Limit Maturity Maturity Date : 2045-04-06 Maturity Price : 23.13 Evaluated at bid price : 24.96 Bid-YTW : 3.45 % |
| BNS.PR.M | Deemed-Retractible | 55,009 | Desjardins bought 39,300 from GMP at 25.30. \YTW SCENARIO Maturity Type : Call Maturity Date : 2015-07-27 Maturity Price : 25.25 Evaluated at bid price : 25.35 Bid-YTW : 2.21 % |
| CM.PR.G | Perpetual-Discount | 50,547 | Called for redemption effective April 30. YTW SCENARIO Maturity Type : Call Maturity Date : 2015-05-06 Maturity Price : 25.00 Evaluated at bid price : 24.98 Bid-YTW : 2.06 % |
| There were 42 other index-included issues trading in excess of 10,000 shares. | |||
| Wide Spread Highlights | ||
| Issue | Index | Quote Data and Yield Notes |
| PVS.PR.B | SplitShare | Quote: 25.25 – 26.25 Spot Rate : 1.0000 Average : 0.5479 YTW SCENARIO |
| BAM.PR.X | FixedReset | Quote: 17.01 – 17.47 Spot Rate : 0.4600 Average : 0.3255 YTW SCENARIO |
| CIU.PR.C | FixedReset | Quote: 16.65 – 17.63 Spot Rate : 0.9800 Average : 0.8879 YTW SCENARIO |
| ENB.PR.P | FixedReset | Quote: 19.37 – 19.62 Spot Rate : 0.2500 Average : 0.1634 YTW SCENARIO |
| BNS.PR.O | Deemed-Retractible | Quote: 25.71 – 25.97 Spot Rate : 0.2600 Average : 0.1796 YTW SCENARIO |
| BIP.PR.A | FixedReset | Quote: 24.62 – 24.82 Spot Rate : 0.2000 Average : 0.1271 YTW SCENARIO |