Archive for June, 2014

June 23, 2014

Monday, June 23rd, 2014

Matt Levine of Bloomberg ran a thoughtful – if disjointed – piece on bond market structure philosophy titled SEC Wants to Give Everyone a Chance to Be a Bond Trader:

There are more fundamental structural worries about declining liquidity in the bond markets: What will happen if investors want to sell and there are no dealers to buy?7 How risky is it to have so many bonds held by ETFs? Should big bond managers such as BlackRock and Pimco be regulated as too-big-to-fail risks to financial stability?

These are tough questions, but one plausible way of addressing them might be to open up trading of bonds somewhat. The current model of investors calling dealers for quotes makes sense if dealers provide a lot of liquidity; but if the dealers are just working as well-paid, information-hoarding middlemen between investors, then maybe there are more efficient ways for investors to interact. And in fact there have been efforts to develop electronic, inter-institution trading platforms that would make the bond markets a bit more like the stock markets, by allowing investors and dealers to post quotes in the same place, and trade directly with each other.

But what’s gotten attention was [chairman of the Securities and Exchange Commission Mary Jo] White’s call for more transparency in bond markets. In particular, White wants more technology-supported pre-trade transparency: That is, she wants more publicly available, electronically distributed, quotes for bonds, so you can know before you trade what prices are being offered in the market for the bond you want to buy. This would be a move toward making the bond market more like the equity market, with publicly posted quotes and potentially electronic (and high-frequency! maybe) trading.

The SEC’s job is to regulate the financial markets. One way to approach that job would be to put a priority on optimizing market efficiency and stability. Another way to approach it would be to put a priority on protecting retail investors and preventing two-bit frauds. Obviously both are good but one is more important. If you think about bond market structure in terms of protecting the little guy, you will make one set of choices; if you think about it in terms of providing a stable liquid platform for massive flows of capital, you will make a second, probably somewhat different, set of choices.14 The second set of choices is probably right.

Quite right, and this is something I have reiterated in PrefBlog to the point of boredom. Increased price transparency will result in shallower, more brittle bond markets; there’s tons of evidence supporting this thesis. But the SEC is leaning in the other direction:

The main U.S. securities regulator is ramping up calls to democratize a $40 trillion bond market, proposing that smaller investors receive more price information to avoid getting fleeced when buying less-traded debt.

The Securities and Exchange Commission wants retail investors to have the same access to privately negotiated bond prices as big institutions, allowing them to make better decisions about how much to pay for the securities, Chair Mary Jo White said yesterday. Releasing such information on corporate and municipal transactions would promote competition and better execution, she said.

Finra is expanding its bond-price reporting into the $1.5 trillion market for private company debt, which is only sold to institutional buyers.

Another effect will be the continued acceleration of the current trend towards private placements. So retail will be able to get lots of pricing information on every publicly traded bond there is, but there won’t be too many. So we’ll see even more retail portfolios highly concentrated with big household names – the GMACs and GMs of this world, as worked out so well during the Credit Crunch. Another possibility, that I would like to see more of, would be institutional accounts trading directly with each other, bypassing the dealers completely. Naturally, you’ll get a few institutional houses running hedge-fund-like actively managed bond portfolios dominating the market – I see nothing wrong with that.

There are few inflation worries in the Treasury market:

In the past 13 months, the gap between yields of two- and five-year Treasuries has doubled to 1.22 percentage points, according to data compiled by Bloomberg. At the same time, the difference between those of five- and 30-year securities has narrowed to the least since 2009 as the long bond rallied.

Because yields on longer-dated debt usually rise more than shorter-term notes when investors see faster inflation spurring rate increases, the moves suggest a more sanguine outlook, according to Priya Misra, the New York-based head of U.S. rates strategy at Bank of America Corp., one of 22 primary dealers obligated to bid at U.S. debt auctions.

Taken together, the relationship now implies that while investors anticipate the Fed will eventually lift its benchmark rate after holding it close to zero for six years, they don’t foresee the central bank’s stimulus measures creating the kind of inflationary pressures that would force its hand, she said.

“The bond vigilantes have all been quieted,” Misra said by telephone on June 19. “The idea that just the act of printing money gets you inflation has been debunked.”

That view also indicates there’s little concern over a repeat of 1994, one of the worst years for bonds when Treasuries lost more than 4 percent in the first six months as the Fed began to double its benchmark rate to 6 percent, according to the Bank of America Merrill Lynch U.S. Treasury Index. In part because of the Fed’s success as an inflation fighter, Treasuries generated returns in 2004, 2005 and 2006 even though the bank boosted rates to 5.25 percent from 1 percent.

This year, Treasuries have advanced 2.58 percent in the biggest year-to-date gain since 2011, even as the Fed began to pare back its $85 billion-a-month bond buying program.

I’ll believe it’s not 1994 all over again when the Fed actually hikes its policy rate! But we’ll see.

There is some concern about the bond market’s vulnerability to mass ETF redemptions – particularly in odd sectors:

It’s never been easier for individuals to enter some of the most esoteric debt markets. Wall Street’s biggest firms are worried that it’ll be just as simple for them to leave.

Investors have piled more than $900 billion into taxable bond funds since the 2008 financial crisis, buying stock-like shares of mutual and exchange-traded funds to gain access to infrequently-traded markets. This flood of cash has helped cause prices to surge and yields to plunge.

Now, as the Federal Reserve discusses ending its easy-money policies, concern is mounting that the withdrawal of stimulus will lead to an exodus that’ll cause credit markets to freeze up. While new regulations have forced banks to reduce their balance-sheet risk, analysts at JPMorgan Chase & Co. (JPM) are focusing on the problems that individual investors could cause by yanking money from funds.

That concern is also revealed in BlackRock Inc.’s pitch in a paper published last month that regulators should consider redemption restrictions for some bond mutual funds, including extra fees for large redeemers.

A year ago, bond funds suffered record withdrawals amid hysteria about a sudden increase in benchmark yields. A 0.8 percentage point rise in the 10-year Treasury yield in May and June last year spurred a sell-off that caused $248 billion of market value losses on the Bank of America Merrill Lynch U.S. Corporate and High Yield Index.

Of course, yields on 10-year Treasuries (USGG10YR) have since fallen to 2.6 percent from 3 percent at the end of December and company bonds have resumed their rally. Analysts are worrying about what happens when the gift of easy money goes away for good.

US municipalities are a little gun-shy when it comes to infrastructure:

Across the U.S., localities are refraining from raising new funds in the $3.7 trillion municipal-bond market after the worst financial crisis since the Great Depression left them with unprecedented deficits. Rather than take advantage of Federal Reserve (FDTR) policy that’s held benchmark interest rates at historic lows since December 2008, they’re repaying obligations by the most on record.

Issuance this year has tumbled to $123 billion nationwide through June 13, down 20 percent from the 2013 pace, according to data compiled by Bloomberg. It’s also 30 percent below levels seen in 2010, the final year of the federally subsidized Build America Bonds program, which was designed to spur infrastructure investment.

Since 2010, states and localities have lowered their bond load by $111 billion, the most since the Fed began keeping records in 1945. They’ve paid down the liabilities even as yields on 20-year general obligations have averaged 4.25 percent in the five years since the recession, the lowest since 1969, according to Bond Buyer data.

America’s governments would need to spend about $3.6 trillion through 2020 to put everything from roads and water to sewers and electricity networks into adequate shape, according to the American Society of Civil Engineers, based in Reston, Virginia. That’s about $1.6 trillion more than governments are expected to dispense.

Meanwhile, the Minister of Asset Allocation has market-timing advice:

Canada’s Finance Minister Joe Oliver warned on Monday that investors could be mispricing risk as they hunt for better investment returns, and said policymakers should keep the issue under close review.

Oliver is in London to promote trade and investment, and told Reuters in an interview that the global economy remained vulnerable to financial shocks.

“We’ve said again and again … that international financial markets are still fragile. Part of that is macroeconomic and monetary issues, but there is a geopolitical issue,” he said at the London residence of Canada’s envoy to London.

James Langton of Investment Executive highlights some interesting research in his piece Video better than text in boosting financial literacy:

New research finds that online video may be a particularly effective way of bolstering financial literacy.

According to a new paper (Visual Tools and Narratives: New Ways to Improve Financial Literacy) published by the U.S. National Bureau of Economic Research (NBER), video appears to be better at improving basic financial literacy than text-based approaches. The conclusion is based on an experiment financed by a grant from the U.S. Social Security Administration (SSA), and funded as part of the Financial Literacy Research Consortium.

Researchers developed four different online approaches to explaining the concept of risk diversification — a brochure, an interactive visual tool, a written narrative, and a video — and then tested them with a sample of 900 people. Overall, they found that video performed the best at both improving financial literacy scores and increasing people’s levels of confidence in their financial knowledge.

The actual paper is titled Visual Tools and Narratives: New Ways to Improve Financial Literacy:

We developed and experimentally evaluated four novel educational programs delivered online: an informational brochure, a visual interactive tool, a written narrative, and a video narrative. The programs were designed to inform people about risk diversification, an essential concept for financial decision- making. The effectiveness of these programs was evaluated using the RAND American Life Panel. Participants were exposed to one of the programs, and then asked to answer questions measuring financial literacy and self-efficacy. All of the programs were found to be effective at increasing self-efficacy, and several improved financial literacy, providing new evidence for the value of programs designed to help individuals make financial decisions. The video was more effective at improving financial literacy scores than the written narrative, highlighting the power of online media in financial education.

Institutional subscribers to the NBER working paper series, and residents of developing countries may download this paper without additional charge at www.nber.org.

Well, I’m not paying for it.

Anyway, I had been hoping to read it to check what their actual conclusion regarding videos is. I suspect – although without reading the paper this is mere speculation, of course – that what they have measured is people’s ease of learning via different media, rather than anything specific to financial literacy. I hate videos and lectures. If I’m going to learn anything, I’ve got to read it. It’s entirely possible that all that has been discovered is that I am in the minority, which I knew already.

Nice to see such work being done, though. Here in Canada, potential funding for such research is instead splashed out to cronies with zero public benefit.

It was a modestly good day for the Canadian preferred share market, with PerpetualDiscounts gaining 7bp, FixedResets winning 9bp and DeemedRetractibles up 8bp. Volatility was average, skewed to winners. Volume was below average.

HIMIPref™ Preferred Indices
These values reflect the December 2008 revision of the HIMIPref™ Indices

Values are provisional and are finalized monthly
Index Mean
Current
Yield
(at bid)
Median
YTW
Median
Average
Trading
Value
Median
Mod Dur
(YTW)
Issues Day’s Perf. Index Value
Ratchet 0.00 % 0.00 % 0 0.00 0 0.4787 % 2,491.4
FixedFloater 4.43 % 3.69 % 28,816 17.95 1 -0.0932 % 3,873.3
Floater 2.94 % 3.06 % 44,199 19.58 4 0.4787 % 2,690.0
OpRet 4.38 % -9.03 % 23,129 0.08 2 0.0195 % 2,711.6
SplitShare 4.83 % 4.41 % 58,130 4.09 5 -0.0399 % 3,106.5
Interest-Bearing 0.00 % 0.00 % 0 0.00 0 0.0195 % 2,479.5
Perpetual-Premium 5.52 % -0.94 % 80,996 0.09 17 0.0739 % 2,406.6
Perpetual-Discount 5.26 % 5.26 % 112,725 14.97 20 0.0664 % 2,556.1
FixedReset 4.46 % 3.69 % 206,436 6.66 78 0.0855 % 2,543.8
Deemed-Retractible 4.99 % 1.30 % 132,472 0.17 43 0.0751 % 2,538.6
FloatingReset 2.67 % 2.39 % 123,281 3.94 6 -0.1579 % 2,495.2
Performance Highlights
Issue Index Change Notes
TRP.PR.A FixedReset -1.03 % YTW SCENARIO
Maturity Type : Limit Maturity
Maturity Date : 2044-06-23
Maturity Price : 22.29
Evaluated at bid price : 23.06
Bid-YTW : 3.83 %
BAM.PR.B Floater 1.01 % YTW SCENARIO
Maturity Type : Limit Maturity
Maturity Date : 2044-06-23
Maturity Price : 17.05
Evaluated at bid price : 17.05
Bid-YTW : 3.07 %
FTS.PR.J Perpetual-Discount 1.02 % YTW SCENARIO
Maturity Type : Limit Maturity
Maturity Date : 2044-06-23
Maturity Price : 23.40
Evaluated at bid price : 23.75
Bid-YTW : 5.03 %
GWO.PR.N FixedReset 1.21 % YTW SCENARIO
Maturity Type : Hard Maturity
Maturity Date : 2025-01-31
Maturity Price : 25.00
Evaluated at bid price : 21.76
Bid-YTW : 4.62 %
W.PR.H Perpetual-Premium 1.33 % YTW SCENARIO
Maturity Type : Limit Maturity
Maturity Date : 2044-06-23
Maturity Price : 24.84
Evaluated at bid price : 25.07
Bid-YTW : 5.58 %
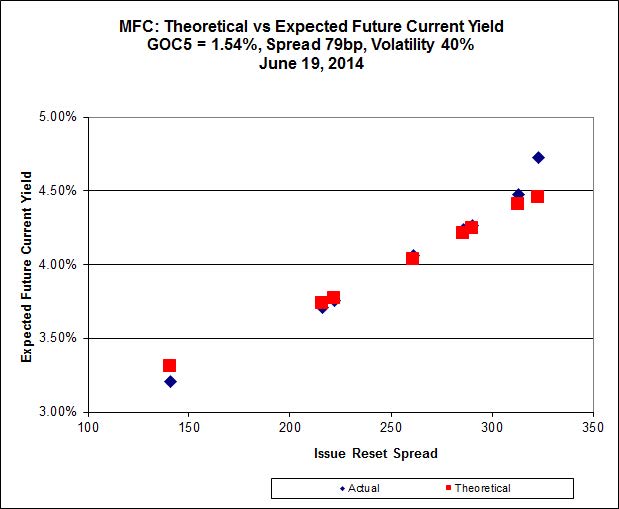
MFC.PR.B Deemed-Retractible 2.14 % YTW SCENARIO
Maturity Type : Hard Maturity
Maturity Date : 2025-01-31
Maturity Price : 25.00
Evaluated at bid price : 23.40
Bid-YTW : 5.49 %
Volume Highlights
Issue Index Shares
Traded
Notes
RY.PR.H FixedReset 292,590 Recent new issue.
YTW SCENARIO
Maturity Type : Limit Maturity
Maturity Date : 2044-06-23
Maturity Price : 23.21
Evaluated at bid price : 25.19
Bid-YTW : 3.74 %
ENB.PF.C FixedReset 215,075 Nesbitt crossed blocks of 45,000 and 100,000, both at 25.14. Scotia crossed 50,000 at the same price.
YTW SCENARIO
Maturity Type : Limit Maturity
Maturity Date : 2044-06-23
Maturity Price : 23.16
Evaluated at bid price : 25.13
Bid-YTW : 4.19 %
RY.PR.L FixedReset 108,216 Nesbitt crossed 100,000 at 26.30.
YTW SCENARIO
Maturity Type : Call
Maturity Date : 2019-02-24
Maturity Price : 25.00
Evaluated at bid price : 26.35
Bid-YTW : 3.10 %
TD.PF.A FixedReset 101,430 Recent new issue.
YTW SCENARIO
Maturity Type : Limit Maturity
Maturity Date : 2044-06-23
Maturity Price : 23.21
Evaluated at bid price : 25.22
Bid-YTW : 3.72 %
CM.PR.O FixedReset 99,425 Recent new issue.
YTW SCENARIO
Maturity Type : Limit Maturity
Maturity Date : 2044-06-23
Maturity Price : 23.22
Evaluated at bid price : 25.19
Bid-YTW : 3.78 %
GWO.PR.I Deemed-Retractible 75,201 TD crossed 70,000 at 22.80.
YTW SCENARIO
Maturity Type : Hard Maturity
Maturity Date : 2025-01-31
Maturity Price : 25.00
Evaluated at bid price : 22.51
Bid-YTW : 5.79 %
There were 24 other index-included issues trading in excess of 10,000 shares.
Wide Spread Highlights
Issue Index Quote Data and Yield Notes
MFC.PR.F FixedReset Quote: 23.06 – 23.85
Spot Rate : 0.7900
Average : 0.6585

YTW SCENARIO
Maturity Type : Hard Maturity
Maturity Date : 2025-01-31
Maturity Price : 25.00
Evaluated at bid price : 23.06
Bid-YTW : 4.21 %

BAM.PR.X FixedReset Quote: 22.12 – 22.44
Spot Rate : 0.3200
Average : 0.2372

YTW SCENARIO
Maturity Type : Limit Maturity
Maturity Date : 2044-06-23
Maturity Price : 21.84
Evaluated at bid price : 22.12
Bid-YTW : 4.06 %

BNA.PR.C SplitShare Quote: 24.79 – 25.00
Spot Rate : 0.2100
Average : 0.1341

YTW SCENARIO
Maturity Type : Hard Maturity
Maturity Date : 2019-01-10
Maturity Price : 25.00
Evaluated at bid price : 24.79
Bid-YTW : 4.63 %

CU.PR.G Perpetual-Discount Quote: 22.29 – 22.53
Spot Rate : 0.2400
Average : 0.1642

YTW SCENARIO
Maturity Type : Limit Maturity
Maturity Date : 2044-06-23
Maturity Price : 22.01
Evaluated at bid price : 22.29
Bid-YTW : 5.08 %

CIU.PR.C FixedReset Quote: 20.87 – 21.25
Spot Rate : 0.3800
Average : 0.3183

YTW SCENARIO
Maturity Type : Limit Maturity
Maturity Date : 2044-06-23
Maturity Price : 20.87
Evaluated at bid price : 20.87
Bid-YTW : 3.69 %

GWO.PR.I Deemed-Retractible Quote: 22.51 – 22.80
Spot Rate : 0.2900
Average : 0.2286

YTW SCENARIO
Maturity Type : Hard Maturity
Maturity Date : 2025-01-31
Maturity Price : 25.00
Evaluated at bid price : 22.51
Bid-YTW : 5.79 %

New Issue: ALA FixedReset, 4.75%+306

Monday, June 23rd, 2014

AltaGas Ltd. has announced:

that it will issue 6,000,000 Cumulative Redeemable Rate Reset Preferred Shares, Series G (the “Series G Preferred Shares”), at a price of $25.00 per Series G Preferred Share (“the Offering”) for aggregate gross proceeds of $150 million on a bought deal basis. The Series G Preferred Shares will be offered to the public through a syndicate of underwriters co-led by RBC Capital Markets, Scotiabank and TD Securities Inc.

Holders of the Series G Preferred Shares will be entitled to receive a cumulative quarterly fixed dividend for the initial period ending on but excluding September 30, 2019 (the “Initial Period”) at an annual rate of 4.75%, payable on the last day of March, June, September and December, as and when declared by the Board of Directors of AltaGas. The first quarterly dividend payment is payable on September 30, 2014 and shall be $0.2896 per Series G Preferred Share. The dividend rate will reset on September 30, 2019 and every five years thereafter at a rate equal to the sum of the then five-year Government of Canada bond yield plus 3.06%. The Series G Preferred Shares are redeemable by AltaGas, at its option, on September 30, 2019 and on September 30 of every fifth year thereafter.

Holders of Series G Preferred Shares will have the right to convert all or any part of their shares into Cumulative Redeemable Floating Rate Preferred Shares, Series H (the “Series H Preferred Shares”), subject to certain conditions, on September 30, 2019 and on September 30 every fifth year thereafter. Holders of Series H Preferred Shares will be entitled to receive a cumulative quarterly floating dividend at a rate equal to the sum of the then 90-day Government of Canada Treasury Bill yield plus 3.06%, as and when declared by the Board of Directors of AltaGas.

The Offering is expected to close on or about July 3, 2014. Net proceeds will be used to reduce outstanding indebtedness and for general corporate purposes. AltaGas has granted to the underwriters an option, exercisable in whole or in part at any time up to 48 hours prior to closing of the Offering, to purchase up to an additional 2,000,000 Series G Preferred Shares at a price of $25.00 per share.

The Series G Preferred Shares will be issued pursuant to a prospectus supplement that will be filed with securities regulatory authorities in Canada under AltaGas’ short form base shelf prospectus dated August 23, 2013. The Offering is only made by way of a prospectus. The prospectus contains important detailed information about the securities being offered. The Offering is subject to receipt of all necessary regulatory and stock exchange approvals.

This looks like it is being issued with some concession to the market – ALA.PR.E, which is a FixedReset 5.00%+317, closed today at 25.46-55, 2×21, on heavy volume.

June 20, 2014

Friday, June 20th, 2014

The hot news today was an unexpectedly high inflation number:

Inflation exceeded the Bank of Canada’s target last month for the first time in more than two years, an unexpected acceleration led by energy costs that sparked increases in the currency and bond yields.

The consumer price index rose 2.3 percent in May from a year ago following April’s 2 percent pace, Statistics Canada said today from Ottawa. The core rate, which excludes eight volatile products, increased 1.7 percent after a gain of 1.4 percent the prior month. Both increases were higher than all forecasts in Bloomberg economist surveys that called for total inflation of 2 percent and core prices to rise 1.5 percent.

Which had an effect on policy expectations which had an effect on the dollar:

The loonie, nicknamed for the image of the aquatic bird on the C$1 coin, appreciated 0.6 percent to C$1.0758 per U.S. dollar at 5 p.m. in Toronto. It touched C$1.0752, the strongest since Jan. 7, after weakening on March 20 to C$1.1279. One loonie buys 92.95 U.S. cents. The Canadian dollar gained 0.9 percent this week in its second five-day advance.

The currency is the top performer for the past three months in a basket of 10 developed-market currencies tracked by the Bloomberg Correlation Weighted Index, strengthening 4.5 percent. It has lost 2 percent this year.

The Canadian government’s two-year note dropped, pushing the yield to as high as 1.15 percent, the most since Jan. 6. Benchmark 10-year bond yields rose as much as seven basis points, or 0.07 percentage point, the most since March 19, to 2.33 percent before trading at 2.29 percent. The 2.5 percent security maturing in June 2024 lost 29 cents to C$101.84.

The yield on June 2015 bankers’ acceptance contracts reached 1.46 percent today, the highest since April 4, suggesting investors are moving up their expected date for the Bank of Canada to begin raising interest rates.

David Parkinson of the Globe dismisses Exchange Rate Pass Through (ERPT) as the rationale:

Meanwhile, one has to wonder how long “exchange-rate pass-through” should be expected to distort the inflation trend. The Canadian dollar did fall more than 10 cents against its U.S. counterpart in the span of a year – but for the past five months the currency has actually been stable, in the 90 to 92 cents (U.S.) range. Certainly it would take a while for last year’s decline in the loonie to work its way fully through pricing for imported goods (and goods dependent on imported inputs), but presumably the impact should already be softening in the month-to-month numbers as the currency continues to hold its footing. Yet on a month-to-month basis, core CPI was up 0.5 per cent (unadjusted for seasonal effects) in May, in a month when the dollar actually rose.

The BoC has lots of research that suggests ERPT is not really all that important. F’rinstance, a 2004 review by Jeannine Bailliu and Hafedh Bouakez titled Exchange Rate Pass-Through in Industrialized Countries:

    • Although estimates of exchange rate passthrough vary both by industry and by country, it appears that the full effect of a depreciation or appreciation of the domestic currency is not passed through to local currency import prices across industrialized countries.

  • • Many industrialized countries seem to have experienced a decline in exchange rate passthrough to consumer prices in the 1990s, despite large exchange rate depreciations in many of them.
  • • The fact that this documented decline in exchange rate pass-through has coincided with the low-inflation period that most industrialized countries entered a decade or so ago has popularized the view that these two phenomena could be linked.
  • • Assessing the extent of exchange rate passthrough, and whether it has indeed declined, has important implications for the conduct and design of monetary policy.

    Assuming for a moment that the prices of domestically produced goods do not respond to exchange rate changes, there are at least two reasons why passthrough to consumer prices might not equal the share of imports in the consumption basket even if passthrough to import prices is complete. First, local distribution costs, such as transportation costs, marketing, and services, will cause import and consumer prices to diverge, and the wedge between the two prices will fluctuate if distributors adjust their profit margins in response to movements in the exchange rate. Second, as discussed in Bacchetta and vanWincoop (2002), differences in the optimal pricing strategies of foreign wholesalers and domestic retailers can explain why pass-through to consumer prices is lower than the share of imports in the CPI even when pass-through to import prices is complete. Indeed, this discrepancy can occur if foreign exporting firms price their goods in the exporter’s currency, while domestic retailers resell these goods priced in domestic currency

… and Stephen Murchison’s October 2009 paper Exchange Rate Pass-through and Monetary Policy: How Strong is the Link?:

Several authors have presented reduced-form evidence suggesting that the degree of exchange rate pass-through to the consumer price index has declined in Canada since the early 1980s and is currently close to zero. Taylor (2000) suggests that this phenomenon, which has been observed for several other countries, may be due to a change in the behaviour of inflation. Specifically, moving from a high to a low-inflation environment has reduced the expected persistence of cost changes and, by consequence, the degree of pass-through to prices. This paper extends his argument, suggesting that this change in persistence is due to a change in the parameters of the central bank’s policy rule. Evidence is presented for Canada indicating that policy has responded more aggressively to inflation deviations over the low pass-through period relative to the high pass-through period. We test the quantitative importance of this change in policy for exchange rate pass-through by varying the parameters of a simple monetary policy rule embedded in an open economy, dynamic stochastic general equilibrium model. Results suggest that increases in the aggressiveness of policy consistent with that observed for Canada are sufficient to effectively eliminate measured pass-through. However, this conclusion depends critically on the inclusion of price-mark-up shocks in the model. When these are excluded, a more modest decline to pass-through is predicted.

… and a review by Jeannine Bailliu, Wei Dong and John Murray titled Has Exchange Rate Pass-Through Really Declined? Some Recent Insights from the Literature:

  • • A substantial empirical literature has shown that the correlation between changes in consumer prices and changes in the nominal exchange rate has been quite low and declining over the past two decades for a broad group of countries.
  • • The issue of exchange rate pass-through (ERPT) has recently been explored more fully in the context of sticky-price, open-economy, dynamic stochastic general-equilibrium (DSGE) models. The findings of these studies put into question results from previous work based on reduced-form equations. In particular, ERPT to import prices may remain larger than the estimated parameters from
    reduced-form regressions would indicate, owing to an econometric bias related to the endogeneity of the exchange rate.

  • • Nevertheless, there is fairly convincing evidence to suggest that measured short-term ERPT to consumer prices has declined because of a shift to more credible monetary policy regimes, and, in this case, the findings from DSGE models confirm the results of reduced-form models.
  • • Studies using microdata are a promising area of research, since they provide additional insights that help us to better understand the phenomenon of ERPT by providing evidence of some of its drivers at the micro level.


If the price of an imported good rises because of a depreciation, domestic importers may simply switch suppliers. This would be measured as low pass-through, even though pass-through may be complete.

As discussed by Bacchetta and van Wincoop (2003), the insensitivity of consumer prices to changes in the exchange rate may be the outcome of an optimal strategy from the retailer’s perspective. Indeed, when there is rising competition in the local market, it may be optimal for retailers to absorb some of the fluctuations in the exchange rate into their margins, regardless of the sensitivity of border prices to exchange rates. Moreover, when there is limited substitution between non-tradable goods and imported goods, the prices of non-tradable goods can be very sticky, even after large exchange rate movements, leading to very little response in aggregate consumer prices.

… and a paper by Abdul ALEEM and Amine LAHIANI from 2010, Monetary Policy Credibility and Exchange Rate Pass-Through: Some evidence from Emerging Countries:

Considering external constraints on monetary policy in emerging countries, we propose a vector autoregressive model with exogenous variables (VARX) to examine the exchange rate pass-through to domestic prices. We demonstrate that a lower exchange rate pass-through is associated with a credible monetary policy aiming at price stability. The empirical results suggest that the exchange rate pass-through is higher in Latin American countries than in East Asian countries. The exchange rate pass-through has declined after the adoption of inflation targeting monetary policy.

All this talk of distributors and retailers absorbing exchange rate fluctuations is fascinating in view of the federal government’s musing on price controls:

Minister Flaherty has once again proven that the Competition Act is vulnerable to politically expedient amendments developed to respond to perceived exploitative conduct. Following on statements in the 2013 Throne Speech, Minister Flaherty indicated in the 2014 Budget that the government will introduce legislation to address geographic price discrimination “that is not justified by higher operating costs in Canada, and to empower the Commissioner of Competition to enforce the new framework.” While Canadians will not know what this really means until the proposed legislation is disclosed, the language in the 2014 Economic Action Plan suggests the Commissioner of Competition may become a price regulator in addition to its role as enforcer of Canada’s competition law.

The 2014 Budget tabled in Parliament on February 11 states that the Harper government

“proposes to address another source of the price gap identified by the Senate Committee: country pricing strategies—that is, when companies use their market power to charge higher prices in Canada that are not reflective of legitimate higher costs. Evidence suggests that some companies charge higher prices in Canada than in the U.S. for the same goods, beyond what could be justified by higher operating costs. Higher prices brought on by excessive market power hurt Canadian consumers.

The Government intends to introduce legislation to address price discrimination that is not justified by higher operating costs in Canada, and to empower the Commissioner of Competition to enforce the new framework. Details will be announced in the coming months.”

Not surprisingly, there was no mention of this mechanism in the Pack of Useless Hacks, Has-Beens and Bag-Men’s report The Canada-USA Price Gap, although it seems to me that if distribution/retail margins are reduced when purchasing power goes down, then distribution/retail margins should be _____________ when purchasing power goes up. [Fill in the blank: Three Marks]

The government’s plan was attacked by my old school buddy Andrew Coyne:

You might have wondered quite how this mad scheme could have been produced by a government that occasionally proclaims its belief in a free market economy, but only if you had not been paying attention: This was simply the latest expression of how far populism has displaced market liberalism in the Conservatives’ thinking. Still, this was taking things, as they say, to another level: an expensive, bureaucratic muddle that, on its own, would undo much of whatever good the late Jim Flaherty might have achieved in his time at Finance.

But don’t take my word on it. The C.D. Howe Institute has just released a report, drawing on the advice of a panel of the country’s foremost competition policy experts. They include three former directors of investigation at the Competition Bureau, a former Commissioner of Competition, as well as leading economists and practitioners in competition law. Their conclusion: the plan is “profoundly wrong-headed,” “wholly impractical,” “misguided” and “unenforceable” and probably illegal under international trade law. In sum, they said, it was “destined for costly failure” and “should be abandoned forthwith.”

It is, in sum, a thoroughgoing policy debacle in the making; the government would do well to heed to the panel’s advice, and deep-six it. Will it? Or will it once again treat overwhelming expert opposition to one of its policies as evidence, not that the policy is wrong, but that the experts are biased against it?

In other news, retail sales increased:

This came as a separate reading by the agency showed Canadian shoppers out in force in April, as retail sales climbed 1.1 per cent, driven by cars and car parts.

Still, the gains across Canada were exceptionally broad-based, with sales up in 10 of 11 sectors measured, or 98 per cent.

“The advance in retail volumes is welcome news, and suggest Canadian consumers are bouncing back after a tepid first quarter,” said senior economist Krishen Rangasamy of National Bank.

“The overall picture for April is good, with a trifecta of volume gains in retailing, wholesaling and manufacturing, enough in our view to prop up GDP by around 0.2 per cent in the month.”

Bloomberg carries an interesting exchange of views on High-Frequency Trading. In his piece Slow Your Judgments on Fast Trading, Noah Smith conflates slippage and market impact, claiming that:

Slippage, also called implementation shortfall, is the difference between the price that triggers the decision to trade and the actual execution price. It matters for people who use market orders, or the best immediate price. Price impact matters to people who split their trades into pieces.

This, not to put too fine a point on it, is bullshit. From the links:

slippage is the difference between where the computer signaled the entry and exit for a trade and where actual clients, with actual money, entered and exited the market using the computer’s signals.[1] Market-impacted, liquidity, and frictional costs may also contribute.

and

market impact is the effect that a market participant has when it buys or sells an asset. It is the extent to which the buying or selling moves the price against the buyer or seller, i.e. upward when buying and downward when selling. It is closely related to market liquidity; in many cases “liquidity” and “market impact” are synonymous.

So it should be clear that “slippage” is almost always merely bafflegab spouted by useless pseudo-quants of the ‘Look mummy, I gotta spreadsheet’ school of investing. Any trading decision is binary: you either do it or you don’t do it, given the market prices. If a properly written quantitative investment programme tells you it would be a good thing if you sold A and bought B at a take-out of $1.00 and no less, you can’t do the trade at $0.95 and then whimper to your gullible clients about “slippage”. If you can do some of the desired trade at a take-out of $1.00 or better, great! If the market impact of the first part of your trade moves the take-out to $0.95, YOU DON’T FUCKEN DO THE SECOND PART OF THE TRADE!

There is only sequence of events for which I can imagine “slippage” being a legitimate concept. Exchange trades are independent; you can’t make one contingent on another – you can do this with a dealer, but then he’s going to be building in a margin. So it is possible that you see your take-out of $1.00, execute your sale of A, and then be chagrined to learn that the offer of B you were counting on doesn’t exist any more, leaving you with the grim choice of buying back your A (almost certainly at a loss), or gritting your teeth and executing the purchase of B at the higher price anyway. This can be minimized by algorithmic trading, with which you can execute the two sides of the trade with as little time separation as possible, and by reducing your trade sizes to minimize the harmful impact of such a disappearance … and note that the latter strategy might give HFT the signals it needs to scoop things up, so be careful!

So “slippage” is not another word for “implementation shortfall”. “Slippage” is, in fact, another word for “gross incompetence”. And, in fact, the cited paper by Jones defines:

These price impacts can be measured by looking at the response of share prices to a particular trade. However, the preferred trading cost measure for institutions is known as implementation shortfall. It is calculated as the average execution price for the large order compared to the price of the stock prior to the start of execution. As with spreads, implementation shortfalls are usually calculated on a proportional basis relative to the amount traded, and implementation shortfall is usually reported in basis points.

This definition is OK, but brings with it the potential for more incompetent bafflegab. Let us say we are competent investment managers running assets as well as we can. “A” can be swapped into “B” on favourable terms with a take-out of $1.05, but we don’t do it, because we’re looking for $1.10. Suddenly there’s a discontinuity in the market – a policy announcement, or a large trade or new issue somewhere changes the overall pricing in an entire sector, could be anything – and our desired take-out changes to $1.00, even though the relative prices of A and B haven’t changed. Hurray! We’re generating a trade signal, so let’s get to work … we do half the desired trade size at $1.05, but then our price impact moves the price to takeout of $0.95. So what do you do?

If you are a moron, you do the other half at $0.95, and then ring up your mummy and tell her you just did a gigantic trade at an average take-out of your desired $1.00. If you are a reasonably rational person (not employed by a bank, obviously), you stop trading, satisfied that you did half the trade at better than necessary prices, and recommence running your programme, hoping for another opportunity. You don’t do a trade on unfavourable terms just because the price ten minutes ago, with your portfolio as of ten minutes ago, was favourable. That’s just stupid.

So the moral of the story is: let’s ignore Noah Smith’s use of the word slippage and see if his essay makes any sense with proper terminology.

As it turns out, it doesn’t really matter: one of the major assertions in his essay Slow Your Judgments on Fast Trading is:

If HFTs have big speed advantages and very good guesses about the decisions of non-HFT investors, they might theoretically be able to increase slippage and price impact for non-HFTs. That would increase total trading costs for non-HFTs, thus discouraging them from trading. If non-HFTs are bringing important information to the market by their trading, then the net effect of HFT could reduce the informational efficiency of markets.

But a word of caution — the decrease in slippage and price impact might be happening because informed traders are now staying out of the market in response to HFT itself. If that’s happening, it isn’t a reason for celebration — it’s like saying the Spanish flu decreased the death rate from heart disease. The problem is that it’s very hard, if not impossible, to tell how much information is getting pumped into market prices via trading. The increase in the use of dark pools might be the result of informed traders fleeing the public exchanges in an effort to escape HFTs.

OK, so yes, it is possible for an HFT to increase the price impact of the first moiety of my trade at $1.05; I could do a portion at $1.05, but before I can do my second portion at $1.04, HFT swoops in and the take-out is suddenly $0.95, even though I’ve traded a quarter of my desired size when in the absence of HFT I could have done half. The problem with his reasoning is the next sentence:

That would increase total trading costs for non-HFTs, thus discouraging them from trading.

No, it doesn’t increase total trading costs for all non-HFTs; it only increases the trading costs for morons, who insist on doing all their trade, even at prices that don’t make sense any more. It certainly doesn’t increase my trading costs; it might even be said to decrease them, since I did one-quarter of my desired trade at 1.05, instead of half at an average take-out of $1.045.

It would have been nicer, of course, to have scooped up all the available trade, but that’s my fault. If I had been a little quicker, a little smarter, then I actually would have scooped up everything available; but as it was, my sluggishness and stupidity gave HFT the opportunity the chance to (i) read my signal, (ii) interpret my signal and (iii) get his own trade in. So my clients are less happy than they might otherwise be and his clients are happier than they might otherwise be, and this has come about because he was smarter than me (this time!). And that’s exactly the way it should be. I see no problems here. I’ll just have to get better at what I do.

In his counterpoint Why I Love High-Speed Trading, Clifford S. Asness makes some very good points:

Smith’s lead point is that I claim HFTs don’t front-run because I used an outdated definition of the term. That is, I take “front-running” to mean using information you’ve been entrusted with and promised not to use to the disadvantage of whoever entrusted that information to you (usually a paying client). Smith says the definition must be broadened to encompass “order anticipation with speed advantages.” Therefore, he says, it is legitimate to say that HFTs engage in front-running.

He’s wrong. First, you can’t just change the definition of a word used to describe a crime and apply it to something that’s both legal and ethical. Perhaps all of us should have used the more straightforward term “guessing,” because that is all “order anticipation” means. Traders have always made educated guesses about who is going to buy and sell what, and they’ve always tried to do it faster than the other guy. They did this long before HFT. In fact, what are traders doing if not trying to make educated guesses about who plans to buy and sell what and then act before other traders? If these traders — HFT or not — are using legal, public information, this is exactly what they’re supposed to be doing. To say “we’ll call that front-running as we’ve broadened the term” is ridiculous.

Yes, very good. It’s much like the Peter ‘My Word Is My Bond, Sometimes’ MacKay’s attempt to reclassify prostitutes’ clients as “perverts”.

Asness’ other good point is:

But Smith is creative! He advances the untestable hypothesis that perhaps fewer people are bothering to become informed traders because HFTs will just take their profits, and as a result markets are less efficient. As we have pointed out, HFTs shouldn’t be judged against an unattainable nirvana of zero bid-ask spreads and infinite liquidity, but against the system that preceded it. Before the advent of HFTs, human market-makers engaged in order anticipation and moved prices away from large traders all while earning much fatter profits.1 Any informed trader discouraged because potential profits are syphoned away by HFTs would have been even more discouraged under the old trading regime.

Yes, yes and yes again! As I have often pointed out, much of the controversy regarding HFT is fuelled by the pique and despair of the old-money smiley-boy crowd, dismayed that some parvenus are eating their lunch. Since they don’t have the talent to do their jobs properly, they prefer to whine to teacher.

The paper on implementation costs was by Charles M. Jones, by the way, and titled What Do We Know About High-Frequency Trading?:

This paper reviews recent theoretical and empirical research on high-frequency trading (HFT). Economic theory identifies several ways that HFT could affect liquidity. The main positive is that HFT can intermediate trades at lower cost. However, HFT speed could disadvantage other investors, and the resulting adverse selection could reduce market quality.

Over the past decade, HFT has increased sharply, and liquidity has steadily improved. But correlation is not necessarily causation. Empirically, the challenge is to measure the incremental effect of HFT beyond other changes in equity markets. The best papers for this purpose isolate market structure changes that facilitate HFT. Virtually every time a market structure change results in more HFT, liquidity and market quality have improved because liquidity suppliers are better able to adjust their quotes in response to new information.

Does HFT make markets more fragile? In the May 6, 2010 Flash Crash, for example, HFT initially stabilized prices but were eventually overwhelmed, and in liquidating their positions, HFT exacerbated the downturn. This appears to be a generic feature of equity markets: similar events have occurred in manual markets, even with affirmative market-maker obligations. Well-crafted individual stock price limits and trading halts have been introduced since. Similarly, kill switches are a sensible response to the Knight trading episode.

Many of the regulatory issues associated with HFT are the same issues that arose in more manual markets. Now regulators in the US are appropriately relying on competition to minimize abuses. Other regulation is appropriate if there are market failures. For instance, consolidated order-level audit trails are key to robust enforcement. If excessive messages impose negative externalities on others, fees are appropriate. But a message tax may act like a transaction tax, reducing share prices, increasing volatility, and worsening liquidity. Minimum order exposure times would also severely discourage liquidity provision.

And in other, other news, Jed Kolko of Trulia addresses fears that boomer downsizing will devastate house prices in his piece Baby-Boomer Downsizing? Perhaps Not So Fast:

Let’s start by looking at the age when older households move from single-family homes to multi-unit buildings. Based on the 2013 Current Population Survey’s Annual Social and Economic Supplement (CPS ASEC) – the most recent detailed demographic data available – baby boomers (born between 1946 and 1964, which means 50-68 years old in 2014) are less likely than almost any other age group to live in multi-unit buildings as opposed to single-family homes. The only age group less likely to live in multi-unit buildings is 70-74 year-olds, which is the age group that baby boomers will start to enter in the coming years.

In later years, the share of households in multi-unit buildings rises, but by less than you might guess. Just 25% of households headed by 80-84 year-olds live in multi-unit buildings – which is a lower share than 40-44 year-olds. Even among households headed by adults aged 85 and older, only one-third live in multi-unit buildings – and that’s only counting those who head their own household are not living with adult children or in institutions.

Therefore, as today’s baby boomers age, they’ll grow into age groups first with a lower likelihood of living in multi-unit buildings (70-74 year-olds). Multi-unit living starts rising slightly at age 75-79, and rises more notably only when heads of household reach their 80s.

It was a mixed day for the Canadian preferred share market, with PerpetualDiscounts down 6bp, FixedResets gaining 3bp and DeemedRetractibles off 1bp. Volatility wasn’t much – boosted by Floaters reversing yesterday’s jump. Volume was very low.

HIMIPref™ Preferred Indices
These values reflect the December 2008 revision of the HIMIPref™ Indices

Values are provisional and are finalized monthly
Index Mean
Current
Yield
(at bid)
Median
YTW
Median
Average
Trading
Value
Median
Mod Dur
(YTW)
Issues Day’s Perf. Index Value
Ratchet 0.00 % 0.00 % 0 0.00 0 -0.8239 % 2,479.5
FixedFloater 4.43 % 3.68 % 29,984 17.97 1 0.1401 % 3,876.9
Floater 2.96 % 3.08 % 44,727 19.52 4 -0.8239 % 2,677.2
OpRet 4.38 % -8.59 % 24,084 0.08 2 0.0779 % 2,711.1
SplitShare 4.82 % 4.30 % 58,447 4.11 5 -0.2307 % 3,107.8
Interest-Bearing 0.00 % 0.00 % 0 0.00 0 0.0779 % 2,479.0
Perpetual-Premium 5.52 % -0.53 % 81,978 0.08 17 -0.1269 % 2,404.9
Perpetual-Discount 5.26 % 5.27 % 113,553 14.97 20 -0.0621 % 2,554.4
FixedReset 4.46 % 3.70 % 208,740 6.68 78 0.0327 % 2,541.6
Deemed-Retractible 4.99 % -0.21 % 132,821 0.11 43 -0.0111 % 2,536.7
FloatingReset 2.66 % 2.33 % 123,702 3.95 6 0.0000 % 2,499.2
Performance Highlights
Issue Index Change Notes
MFC.PR.B Deemed-Retractible -1.93 % YTW SCENARIO
Maturity Type : Hard Maturity
Maturity Date : 2025-01-31
Maturity Price : 25.00
Evaluated at bid price : 22.91
Bid-YTW : 5.75 %
FTS.PR.J Perpetual-Discount -1.55 % YTW SCENARIO
Maturity Type : Limit Maturity
Maturity Date : 2044-06-20
Maturity Price : 23.18
Evaluated at bid price : 23.51
Bid-YTW : 5.08 %
BAM.PR.B Floater -1.46 % YTW SCENARIO
Maturity Type : Limit Maturity
Maturity Date : 2044-06-20
Maturity Price : 16.88
Evaluated at bid price : 16.88
Bid-YTW : 3.10 %
W.PR.H Perpetual-Premium -1.39 % YTW SCENARIO
Maturity Type : Limit Maturity
Maturity Date : 2044-06-20
Maturity Price : 24.51
Evaluated at bid price : 24.74
Bid-YTW : 5.65 %
BAM.PR.K Floater -1.34 % YTW SCENARIO
Maturity Type : Limit Maturity
Maturity Date : 2044-06-20
Maturity Price : 16.90
Evaluated at bid price : 16.90
Bid-YTW : 3.10 %
BAM.PR.C Floater -1.16 % YTW SCENARIO
Maturity Type : Limit Maturity
Maturity Date : 2044-06-20
Maturity Price : 17.00
Evaluated at bid price : 17.00
Bid-YTW : 3.08 %
Volume Highlights
Issue Index Shares
Traded
Notes
RY.PR.H FixedReset 362,196 Recent new issue.
YTW SCENARIO
Maturity Type : Limit Maturity
Maturity Date : 2044-06-20
Maturity Price : 23.17
Evaluated at bid price : 25.05
Bid-YTW : 3.75 %
TD.PF.A FixedReset 314,340 Recent new issue.
YTW SCENARIO
Maturity Type : Limit Maturity
Maturity Date : 2044-06-20
Maturity Price : 23.20
Evaluated at bid price : 25.18
Bid-YTW : 3.70 %
BAM.PF.F FixedReset 62,801 Recent new issue.
YTW SCENARIO
Maturity Type : Call
Maturity Date : 2019-09-30
Maturity Price : 25.00
Evaluated at bid price : 25.35
Bid-YTW : 4.27 %
GWO.PR.N FixedReset 57,326 Desjardins crossed 50,000 at 21.78.
YTW SCENARIO
Maturity Type : Hard Maturity
Maturity Date : 2025-01-31
Maturity Price : 25.00
Evaluated at bid price : 21.50
Bid-YTW : 4.73 %
ENB.PR.J FixedReset 55,100 Scotia crossed 48,900 at 25.27.
YTW SCENARIO
Maturity Type : Limit Maturity
Maturity Date : 2044-06-20
Maturity Price : 23.27
Evaluated at bid price : 25.26
Bid-YTW : 4.07 %
TD.PR.R Deemed-Retractible 32,523 Scotia crossed 31,100 at 26.45.
YTW SCENARIO
Maturity Type : Call
Maturity Date : 2014-07-20
Maturity Price : 25.75
Evaluated at bid price : 26.43
Bid-YTW : -16.43 %
There were 17 other index-included issues trading in excess of 10,000 shares.
Wide Spread Highlights
Issue Index Quote Data and Yield Notes
BAM.PF.A FixedReset Quote: 25.55 – 26.24
Spot Rate : 0.6900
Average : 0.4175

YTW SCENARIO
Maturity Type : Call
Maturity Date : 2018-09-30
Maturity Price : 25.00
Evaluated at bid price : 25.55
Bid-YTW : 3.93 %

MFC.PR.B Deemed-Retractible Quote: 22.91 – 23.55
Spot Rate : 0.6400
Average : 0.3998

YTW SCENARIO
Maturity Type : Hard Maturity
Maturity Date : 2025-01-31
Maturity Price : 25.00
Evaluated at bid price : 22.91
Bid-YTW : 5.75 %

MFC.PR.F FixedReset Quote: 23.00 – 23.65
Spot Rate : 0.6500
Average : 0.5143

YTW SCENARIO
Maturity Type : Hard Maturity
Maturity Date : 2025-01-31
Maturity Price : 25.00
Evaluated at bid price : 23.00
Bid-YTW : 4.21 %

FTS.PR.J Perpetual-Discount Quote: 23.51 – 23.90
Spot Rate : 0.3900
Average : 0.2645

YTW SCENARIO
Maturity Type : Limit Maturity
Maturity Date : 2044-06-20
Maturity Price : 23.18
Evaluated at bid price : 23.51
Bid-YTW : 5.08 %

FTS.PR.H FixedReset Quote: 21.40 – 21.75
Spot Rate : 0.3500
Average : 0.2363

YTW SCENARIO
Maturity Type : Limit Maturity
Maturity Date : 2044-06-20
Maturity Price : 21.40
Evaluated at bid price : 21.40
Bid-YTW : 3.64 %

W.PR.H Perpetual-Premium Quote: 24.74 – 25.10
Spot Rate : 0.3600
Average : 0.2470

YTW SCENARIO
Maturity Type : Limit Maturity
Maturity Date : 2044-06-20
Maturity Price : 24.51
Evaluated at bid price : 24.74
Bid-YTW : 5.65 %

UST.PR.B Upgraded to Pfd-2 by DBRS

Friday, June 20th, 2014

DBRS has announced that it:

has today upgraded the rating of the Class B Preferred Securities issued by Utility Split Trust (the Fund) to Pfd-2 from Pfd-2 (low). Approximately 1.2 million Class B Preferred Securities were issued on December 19, 2011, following the redemption of the previously outstanding Preferred Securities in accordance with their original terms as part of a share capital reorganization. The final redemption date for the Class B Preferred Securities is December 31, 2016.

Based on the current dividend yields on the underlying portfolio entities, the dividend coverage ratio (net of expenses) is approximately 0.77 times. Shortfalls are expected to be funded through the sale of portfolio securities or drawing upon a loan facility. Holders of the Capital Units are currently receiving $0.05 per unit each month after the Class B Preferred Securities distributions and other expenses of the Fund have been paid.

Since the rating was confirmed in December 2013, Fund performance has been steadily improving. The net asset value (NAV) of the Fund has increased to $29.54 from $26.32,, with downside protection available to holders of the Class B Preferred Securities increasing to approximately 66.2%. From time to time the Portfolio has had a large cash and cash equivalents position that has decreased the income received by the Fund, resulting in a grind on the Portfolio. The Pfd-2 rating of the Class B Preferred Securities is based primarily on the downside protection available, as well as on the measures in place to protect the distributions to and repayment of the Class B Preferred Securities (i.e., the Class B Preferred Security Test, which does not permit any distributions to the Capital Unit holders if the NAV of the Portfolio is less than 1.5 times the outstanding principal amount for the Class B Preferred Securities).

UST.PR.B was last mentioned on PrefBlog when it was issued in a refunding transaction. The issue is not tracked by HIMIPref™ since, with a market capitalization of about $12.3-million, it is too small.

June 19, 2014

Friday, June 20th, 2014

I periodically get asked why my assets under management are so small. Perhaps I should behave more like the big boys:

Staff of the Compliance and Registrant Regulation Branch (Staff or we) of the Ontario Securities Commission (OSC) recently conducted a targeted review or sweep of a sample of large investment fund managers (IFMs), based on assets under management. The reviews focused on the IFMs’ compliance with Ontario securities law in key operational areas. This Notice provides a summary of our findings and related guidance.

Aside from the issuance of deficiency reports, the sweep did not result in further regulatory action on any of the IFMs reviewed. However, we identified areas where deficiencies were more prevalent and additional guidance is needed. These areas are discussed in dedicated parts below and include:

  • I. sales practices
  • II. allocation of expenses to investment funds
  • III. mutual fund borrowings
  • IV. prohibited cross trades
  • V. outsourcing and oversight of service providers


Section 5.1 permits IFMs to pay a portion of the costs of a sales communication, investor conference or investor seminar (collectively, cooperative marketing practices) that participating dealers organize and present to investors.

The major findings in this area, shown along with their incidence rate, were:

  • • cooperative marketing practices did not meet the primary purpose of promoting or providing educational information concerning a mutual fund, a mutual fund family or mutual funds generally in order to be eligible for support (25%)
  • • inadequate disclosure on cooperative marketing materials to indicate that the IFM paid for a portion of the costs of the cooperative marketing practice (25%)
  • • inconsistent application of the IFM’s methodology to calculate primary purpose across all cooperative marketing practice requests (13%)

ii) Section 5.2 — Mutual fund sponsored conferences

Section 5.2 outlines the conditions under which IFMs may provide a non-monetary benefit to a sales representative of a participating dealer to attend a conference or seminar organized and presented by the IFM.

The major findings in this area, shown along with their incidence rate, were:

  • • IFMs paid for expenses of the sales representatives, such as travel and accommodation, not permitted under section 5.2 (50%)
  • • the non-monetary benefits relating to the mutual fund sponsored conference, such as meals and entertainment, were excessive having regard to the purpose of the conference (25%)

iii) Section 5.5 — Participating dealer sponsored events

Section 5.5 permits IFMs to pay a portion of the costs of conferences and seminars organized and presented by dealers (that are not investor conferences or seminars referred to in section 5.1), within certain parameters.

The major findings in this area, shown along with their incidence rate, were:

  • • IFMs provided support for dealer organized conferences which included amounts related to meals and entertainment that were excessive having regard to the purpose of the conference (25%)
  • • IFMs provided support for dealer organized conferences in excess of the 10% reimbursement limit of direct costs incurred by the dealer relating to the conference (25%)

The municipal pension wars are starting:

Police officers and firefighters lighting a bonfire on the street in front of Montreal’s City Hall are an unusual sight. They were among several hundred union members protesting the Quebec government’s intention to reform the pension plans for municipal workers.

One of the proposals is a 50-50 split between Quebec’s cities and their 122,000 employees when it comes to premiums and covering future shortfalls. Indexation would be partly frozen. Current plan members and retirees would be tapped to pay down past deficits. The aim is to reach a negotiated settlement within 12 months.

Municipal Affairs Minister Pierre Moreau estimated the pension plans have a combined deficit of $3.9-billion – late last year it was pegged at north of $5-billion – when he unveiled draft legislation last week.

Eighty Montreal firefighters retired on the spot, causing the brief closure of two stations.

The OMERS deficit is being erased … slowly:

OMERS manages $65.1-billion in pension assets for 440,000 employees and retirees of municipal governments across Ontario. The fund said its assets climbed by over $4-billion from $60.8-billion in 2012, and its funded ratio improved last year by three per cent to 88 per cent, which means the fund has assets equal to 88 per cent of its long-term obligation to fund members’ pensions on a solvency basis.

The pension manager said the remaining $8.6-billion deficit will probably be erased at some point between 2021 and 2025 depending on investment returns. OMERS plan members have increased their pension contributions since 2011 to help improve plan funding, but the increases are expected to be removed when OMERS returns to a surplus.

… which is OK, but:

OMERS needs to earn a long-term annualized return of 7 per cent on its investments to meet its pension obligations.

Mr. Nobrega, who is retiring on April 1, said the introduction of the new “risk-balanced” portfolio last year was the final step in a restructuring launched in 2004 to reduce volatility risk in the investment portfolio. The fund now has 57 per cent of its investments in public markets and 43 per cent in private markets, and is working toward a goal of 53 per cent public market holdings.

Split Share aficionados will be familiar with the concept of Sequence of Returns risk – average return doesn’t mean as much as one might think in the presence of cash flows and portfolio volatility. And let’s just hope they are very conservative with the private equity valuations. Ha ha. By the way – the CPPIB’s return assumption is:

The Chief Actuary’s projections are based on the assumption that the fund will attain an average annual real rate of return, which takes into account the impact of inflation, of 4% over the 75-year projection period in his report, to help sustain the plan at the current contribution rate.

Today’s redemption of MFC.PR.D hasn’t changed anything with respect to the MFC FixedReset Implied Volatility … still 40%+:

ImpVol_MFC_FR_140619
Click for Big

It was a positive day for the Canadian preferred share market, with PerpetualDiscounts winning 13bp, FixedResets gaining 1bp and DeemedRetractibles up 10bp. Volatility was very low, except for the illiquid and hypervolatile Floaters. Volume was average.

HIMIPref™ Preferred Indices
These values reflect the December 2008 revision of the HIMIPref™ Indices

Values are provisional and are finalized monthly
Index Mean
Current
Yield
(at bid)
Median
YTW
Median
Average
Trading
Value
Median
Mod Dur
(YTW)
Issues Day’s Perf. Index Value
Ratchet 0.00 % 0.00 % 0 0.00 0 0.9445 % 2,500.1
FixedFloater 4.44 % 3.69 % 31,111 17.96 1 -0.6032 % 3,871.4
Floater 2.93 % 3.05 % 44,740 19.62 4 0.9445 % 2,699.5
OpRet 4.38 % -7.84 % 23,106 0.08 2 -0.0389 % 2,709.0
SplitShare 4.81 % 4.25 % 60,749 4.11 5 -0.1033 % 3,114.9
Interest-Bearing 0.00 % 0.00 % 0 0.00 0 -0.0389 % 2,477.1
Perpetual-Premium 5.52 % -2.64 % 83,293 0.09 17 0.2036 % 2,407.9
Perpetual-Discount 5.26 % 5.27 % 115,133 14.97 20 0.1277 % 2,556.0
FixedReset 4.46 % 3.70 % 214,611 6.69 78 0.0113 % 2,540.8
Deemed-Retractible 4.99 % -0.30 % 134,595 0.11 43 0.1002 % 2,537.0
FloatingReset 2.66 % 2.37 % 124,928 3.95 6 0.2772 % 2,499.2
Performance Highlights
Issue Index Change Notes
IFC.PR.A FixedReset -1.20 % YTW SCENARIO
Maturity Type : Hard Maturity
Maturity Date : 2025-01-31
Maturity Price : 25.00
Evaluated at bid price : 23.81
Bid-YTW : 4.22 %
BAM.PR.B Floater 1.18 % YTW SCENARIO
Maturity Type : Limit Maturity
Maturity Date : 2044-06-19
Maturity Price : 17.13
Evaluated at bid price : 17.13
Bid-YTW : 3.06 %
BAM.PR.C Floater 1.36 % YTW SCENARIO
Maturity Type : Limit Maturity
Maturity Date : 2044-06-19
Maturity Price : 17.20
Evaluated at bid price : 17.20
Bid-YTW : 3.05 %
BAM.PR.K Floater 1.42 % YTW SCENARIO
Maturity Type : Limit Maturity
Maturity Date : 2044-06-19
Maturity Price : 17.13
Evaluated at bid price : 17.13
Bid-YTW : 3.06 %
Volume Highlights
Issue Index Shares
Traded
Notes
CM.PR.O FixedReset 173,845 Recent new issue.
YTW SCENARIO
Maturity Type : Limit Maturity
Maturity Date : 2044-06-19
Maturity Price : 23.21
Evaluated at bid price : 25.18
Bid-YTW : 3.76 %
ENB.PF.C FixedReset 167,618 Recent new issue.
YTW SCENARIO
Maturity Type : Limit Maturity
Maturity Date : 2044-06-19
Maturity Price : 23.14
Evaluated at bid price : 25.06
Bid-YTW : 4.18 %
TD.PR.K FixedReset 110,240 Called for redemption.
YTW SCENARIO
Maturity Type : Call
Maturity Date : 2014-07-31
Maturity Price : 25.00
Evaluated at bid price : 25.38
Bid-YTW : 0.51 %
TD.PF.A FixedReset 93,810 Recent new issue.
YTW SCENARIO
Maturity Type : Limit Maturity
Maturity Date : 2044-06-19
Maturity Price : 23.19
Evaluated at bid price : 25.17
Bid-YTW : 3.70 %
ENB.PR.J FixedReset 83,600 Scotia crossed 75,000 at 25.30.
YTW SCENARIO
Maturity Type : Limit Maturity
Maturity Date : 2044-06-19
Maturity Price : 23.27
Evaluated at bid price : 25.25
Bid-YTW : 4.07 %
RY.PR.H FixedReset 78,797 Recent new issue.
YTW SCENARIO
Maturity Type : Limit Maturity
Maturity Date : 2044-06-19
Maturity Price : 23.20
Evaluated at bid price : 25.17
Bid-YTW : 3.72 %
There were 33 other index-included issues trading in excess of 10,000 shares.
Wide Spread Highlights
Issue Index Quote Data and Yield Notes
SLF.PR.B Deemed-Retractible Quote: 24.01 – 24.25
Spot Rate : 0.2400
Average : 0.1474

YTW SCENARIO
Maturity Type : Hard Maturity
Maturity Date : 2025-01-31
Maturity Price : 25.00
Evaluated at bid price : 24.01
Bid-YTW : 5.31 %

TRP.PR.B FixedReset Quote: 20.15 – 20.48
Spot Rate : 0.3300
Average : 0.2481

YTW SCENARIO
Maturity Type : Limit Maturity
Maturity Date : 2044-06-19
Maturity Price : 20.15
Evaluated at bid price : 20.15
Bid-YTW : 3.63 %

SLF.PR.I FixedReset Quote: 25.70 – 25.99
Spot Rate : 0.2900
Average : 0.2129

YTW SCENARIO
Maturity Type : Call
Maturity Date : 2016-12-31
Maturity Price : 25.00
Evaluated at bid price : 25.70
Bid-YTW : 3.05 %

BAM.PR.G FixedFloater Quote: 21.42 – 21.79
Spot Rate : 0.3700
Average : 0.3059

YTW SCENARIO
Maturity Type : Limit Maturity
Maturity Date : 2044-06-19
Maturity Price : 21.79
Evaluated at bid price : 21.42
Bid-YTW : 3.69 %

POW.PR.A Perpetual-Premium Quote: 25.07 – 25.26
Spot Rate : 0.1900
Average : 0.1266

YTW SCENARIO
Maturity Type : Call
Maturity Date : 2014-07-19
Maturity Price : 25.00
Evaluated at bid price : 25.07
Bid-YTW : -2.64 %

ENB.PR.H FixedReset Quote: 23.70 – 23.97
Spot Rate : 0.2700
Average : 0.2093

YTW SCENARIO
Maturity Type : Limit Maturity
Maturity Date : 2044-06-19
Maturity Price : 22.70
Evaluated at bid price : 23.70
Bid-YTW : 3.93 %

June 18, 2014

Wednesday, June 18th, 2014

An audit of the Chinese Sovereign Wealth Fund has brought an amusing nugget:

Auditors also found irregularities at Beijing-based CIC’s domestic units. Among them, Central Huijin Investment Ltd. lost 1.26 billion yuan ($202 million) in potential investment gains in 2011 by selling a stake in a local securities company at the cost price and not conducting an asset appraisal as required, according to the report.

It would be most interesting to learn who the buyer was!

Today’s FOMC statement was ‘steady as she goes’:

nformation received since the Federal Open Market Committee met in April indicates that growth in economic activity has rebounded in recent months. Labor market indicators generally showed further improvement. The unemployment rate, though lower, remains elevated. Household spending appears to be rising moderately and business fixed investment resumed its advance, while the recovery in the housing sector remained slow. Fiscal policy is restraining economic growth, although the extent of restraint is diminishing. Inflation has been running below the Committee’s longer-run objective, but longer-term inflation expectations have remained stable.

The Committee currently judges that there is sufficient underlying strength in the broader economy to support ongoing improvement in labor market conditions. In light of the cumulative progress toward maximum employment and the improvement in the outlook for labor market conditions since the inception of the current asset purchase program, the Committee decided to make a further measured reduction in the pace of its asset purchases. Beginning in July, the Committee will add to its holdings of agency mortgage-backed securities at a pace of $15 billion per month rather than $20 billion per month, and will add to its holdings of longer-term Treasury securities at a pace of $20 billion per month rather than $25 billion per month. The Committee is maintaining its existing policy of reinvesting principal payments from its holdings of agency debt and agency mortgage-backed securities in agency mortgage-backed securities and of rolling over maturing Treasury securities at auction. The Committee’s sizable and still-increasing holdings of longer-term securities should maintain downward pressure on longer-term interest rates, support mortgage markets, and help to make broader financial conditions more accommodative, which in turn should promote a stronger economic recovery and help to ensure that inflation, over time, is at the rate most consistent with the Committee’s dual mandate.

To support continued progress toward maximum employment and price stability, the Committee today reaffirmed its view that a highly accommodative stance of monetary policy remains appropriate. In determining how long to maintain the current 0 to 1/4 percent target range for the federal funds rate, the Committee will assess progress–both realized and expected–toward its objectives of maximum employment and 2 percent inflation.

Thoughts of how the Great Moderation ended are causing some nervousness:

The Chicago Board Options Exchange Volatility Index, a gauge of S&P 500 swings, fell to the lowest since early 2007. Foreign-exchange volatility also has slowed, falling to an almost seven-year low.

Low financial-market volatility has stirred concern among some policy makers. New York Fed President William C. Dudley said last month it may signal investor complacency about risk, making him “a little nervous.”

… and has a notable effect on the Treasury market:

Just because U.S. Treasuries (USGG10YR) look more and more stable doesn’t mean they are.

With trading volumes plunging, the lack of volatility may be more a result of the market becoming less liquid as the Federal Reserve hoards trillions of dollars of bonds and banks pull back from debt trading, not because there’s less risk.

Historically, lower volatility has meant more — not less – – trading. What’s happening instead is unprecedented central-bank stimulus has sent everyone into the same risk-on bets, while it’s also becoming more difficult to trade as banks shore up their balance sheets in the face of new regulations.

“We blame the wave of central-bank liquidity, which has pushed up asset prices irrespective of fundamentals,” Citigroup Inc. (C) strategists led by Matt King in London wrote in a note today. “This creates a vicious circle: ever-higher prices, ever-less trading and liquidity.”

Lower volatility used to lead to more trading before the 2008 financial crisis. The opposite has been the case since then, as the Fed has held its benchmark rate near zero and bought trillions of dollars of Treasuries and mortgage debt.

The average volume of Treasuries traded each day has fallen to $504 billion this year from $545 billion in 2013 and as high as $570 billion in 2007, according to data compiled by the Securities Industry and Financial Markets Association. From 2002 to 2006, U.S. government-debt volumes rose 43 percent.

The drop in trading comes as a measure of volatility in Treasury yields has fallen 69 percent since 2008, according to Bank of America Merrill Lynch’s MOVE Index.

The explosion of fixed-income derivatives trading also speaks to the difficulty investors are having buying and selling bonds. As bond trading has slumped, the notional value of over-the-counter futures contracts has soared, based on the latest data from the Bank for International Settlements compiled by Deutsche Bank AG.

Meanwhile, yields on riskier assets are dropping faster than those on safer securities as investors pile into already crowded trades. The gap between yields on junk bonds and investment-grade notes has shrunk to 2.99 percentage points, the least since 2007, Bank of America Merrill Lynch index data show.

Apparently we may soon see the reappearance of Bank Sub-Debt New Issues:

The banks are also getting ready to issue a type of subordinated debt. In March Royal Bank of Canada chief financial officer Janice Fukakusa said she and her counterparts at rival lenders are working with regulators to determine what triggers should be used to determine when these issues are converted to common shares, and how the resulting shareholder dilution should be managed.

The big question is: will these non-bonds get foisted into the indices, so little Granny Oakum can contribute to bank capital with her $5,000 investment in a bond ETF? I’ve warned about the potential for this. Hmmm … let’s see … I should lobby the main index-maker to ensure that only bonds are in the bond indices … even better, lobby the owner of the index maker … so the main pension performance target indices are the PC Bond Canadian Debt Market Indices … that’s a division of the Toronto Stock Exchange … and the Toronto Stock Exchange is owned by … well, never mind. Thanks for the equity, Granny!

A Bloomberg editorial lauds the batch-auction idea:

Fixing the problems will require more than a tweak here and there. One idea that’s winning converts would replace the 24-hour, continuous trading of stocks with frequent auctions at regular intervals.

The idea has a good pedigree. It has been around at least since 1960, when Milton Friedman proposed a version for the sale of U.S. Treasury bonds. Researchers led by the University of Chicago’s Eric Budish refined the concept in a paper last year.

Under their system, orders would be sent to the exchanges, as they are now, but instead of being processed immediately, they’d be collected into batches, based on when they arrived at the exchange. A computer would then use an algorithm to match the orders. Auctions would take place at least every second (for 23,400 auctions per day, per stock), matching supply with demand at the midpoint, or the uniform price. Orders that don’t get matched — either because they exceeded the volume of shares available or because their buy or sell quotes didn’t conform to the uniform price — would automatically be included in the next auction.

Goldman Sachs Group Inc., among others, is interested enough in frequent batch auctions that it’s working with Budish to find an exchange that will conduct a pilot program and a regulatory agency that will monitor the results. Mary Jo White, the Securities and Exchange Commission chair, indicated in a June 5 speech her interest in batch auctions. She should make it a priority to conduct a test program. It’s a promising idea.

This editorial contains two assertions that surprise me:

As well as prioritizing price over speed, this approach would make another flash crash less likely. That’s because it would stem the flood of buy, sell and cancel commands that high-frequency traders issue every second in their efforts to probe the market.

I have never seen any evidence at all that a ‘flood of buy, sell and cancel commands’ had anything to do with the Flash Crash.

Auctions would also reduce the need for dark pools, because the orders of institutional investors wouldn’t be visible to other participants. The fear among big investors such as mutual funds — that placing an order will move the price against them — is the reason dark pools caught on in the first place. The result should be lower transaction costs and higher investment returns for 401(k) owners and other savers.

Lower transaction costs … well, maybe. It could well be that a small (retail) market order to buy enters the same auction as a major sale – we could assume that this will force the price down to bid levels, and so Granny gets to buy her shares at the bid. Maybe. And frankly, I fail to see how making the exchange dark – by not publishing resting limit orders (of institutional investors only?) – will assist in price discovery. This is all a little strange.

The paper by Budish, et al, was discussed on PrefBlog on March 19.

More immediately, it looks like maker-taker exchange pricing is in trouble:

Executives from exchange operators and fund companies are starting to join lawmakers and regulators in warning that the world’s largest equities market is beset with conflicts that can harm investors and undermine confidence.

Support for a solution increased yesterday at a hearing led by Senator Carl Levin as representatives from New York Stock Exchange owner Intercontinental Exchange Inc. (ICE), IEX Group Inc. and Vanguard Group Inc. said trading rebates and payments to brokers for investor trades warrant greater government scrutiny. The systems, embedded in market plumbing over the last two decades, were cited as one of the reasons high-frequency firms now account for about half of volume.

“Hopefully the regulatory agencies are going to take action,” Levin, a Michigan Democrat, said at the end of the half-day hearing of the Senate’s Permanent Subcommittee on Investigations. “There are steps which must be taken either by regulators or by Congress to deal with conflicts and to deal with the other kinds of problems which exist in the current market, because it’s clear there can be improvements.”

I’ll have to give the question some thought; I feel quite certain there are wheels within wheels here. It may be simply that this is the just another battle in the struggle of established market-makers to defend their turf against HFT, much of which profits a lot by maker-taker pricing. You know, by actually making a market. A better one than the big bank smiley-boys.

There’s a shake-up at Harvard’s captive investment manager:

After years of subpar results at Harvard Management Co., three high-level managers have exited the $32.7 billion endowment and the university is searching for new leadership.

Apoorva K. Koticha, 48, among the highest-paid traders at Harvard Management in 2011, has left, according to two people familiar with the matter. News of his departure comes a week after Jane Mendillo, chief executive officer of the university’s investment company since July 2008, said she will resign at the end of the year. Mark McKenna, 43, a money manager at the endowment, moved to BlackRock Inc. (BLK) this month to start an event-driven hedge fund. Since April 2013, Harvard Management has also parted ways with two heads of its private-equity unit.

It was a good day for the Canadian preferred share market, with PerpetualDiscounts up 15pb, FixedResets winning 19bp and DeemedRetractibles gaining 9bp. Volatility was quite good, all winners, dominated by FixedResets. Volume was well above average.

PerpetualDiscounts now yield 5.27%, equivalent to 6.85% interest at the standard equivalency factor of 1.3x. Long Corporates now yield a little under 4.4%, so the pre-tax interest-equivalent spread (in this context, the “Seniority Spread”) is now about 245bp, a slight (and perhaps spurious) tightening from the 250bp reported June 11.

HIMIPref™ Preferred Indices
These values reflect the December 2008 revision of the HIMIPref™ Indices

Values are provisional and are finalized monthly
Index Mean
Current
Yield
(at bid)
Median
YTW
Median
Average
Trading
Value
Median
Mod Dur
(YTW)
Issues Day’s Perf. Index Value
Ratchet 0.00 % 0.00 % 0 0.00 0 0.0705 % 2,476.8
FixedFloater 4.41 % 3.66 % 30,344 18.01 1 0.8895 % 3,894.9
Floater 2.96 % 3.09 % 44,507 19.52 4 0.0705 % 2,674.2
OpRet 4.38 % -8.89 % 24,060 0.08 2 0.0585 % 2,710.0
SplitShare 4.81 % 4.21 % 61,014 4.11 5 0.1353 % 3,118.2
Interest-Bearing 0.00 % 0.00 % 0 0.00 0 0.0585 % 2,478.0
Perpetual-Premium 5.51 % 1.52 % 81,231 0.09 17 -0.1106 % 2,403.0
Perpetual-Discount 5.26 % 5.27 % 116,059 14.97 20 0.1457 % 2,552.8
FixedReset 4.49 % 3.71 % 211,485 6.69 79 0.1928 % 2,540.5
Deemed-Retractible 4.99 % 0.45 % 139,543 0.12 43 0.0910 % 2,534.5
FloatingReset 2.66 % 2.42 % 126,471 3.95 6 0.0660 % 2,492.3
Performance Highlights
Issue Index Change Notes
ENB.PR.P FixedReset 1.04 % YTW SCENARIO
Maturity Type : Limit Maturity
Maturity Date : 2044-06-18
Maturity Price : 22.96
Evaluated at bid price : 24.40
Bid-YTW : 4.10 %
IFC.PR.A FixedReset 1.18 % YTW SCENARIO
Maturity Type : Hard Maturity
Maturity Date : 2025-01-31
Maturity Price : 25.00
Evaluated at bid price : 24.10
Bid-YTW : 4.08 %
ENB.PR.N FixedReset 1.26 % YTW SCENARIO
Maturity Type : Call
Maturity Date : 2018-12-01
Maturity Price : 25.00
Evaluated at bid price : 24.98
Bid-YTW : 4.08 %
FTS.PR.J Perpetual-Discount 1.28 % YTW SCENARIO
Maturity Type : Limit Maturity
Maturity Date : 2044-06-18
Maturity Price : 23.45
Evaluated at bid price : 23.80
Bid-YTW : 5.01 %
ENB.PR.T FixedReset 1.28 % YTW SCENARIO
Maturity Type : Limit Maturity
Maturity Date : 2044-06-18
Maturity Price : 22.97
Evaluated at bid price : 24.46
Bid-YTW : 4.08 %
BAM.PR.X FixedReset 1.63 % YTW SCENARIO
Maturity Type : Limit Maturity
Maturity Date : 2044-06-18
Maturity Price : 21.51
Evaluated at bid price : 21.88
Bid-YTW : 4.07 %
Volume Highlights
Issue Index Shares
Traded
Notes
TD.PF.A FixedReset 283,330 Recent new issue.
YTW SCENARIO
Maturity Type : Limit Maturity
Maturity Date : 2044-06-18
Maturity Price : 23.18
Evaluated at bid price : 25.14
Bid-YTW : 3.71 %
FTS.PR.H FixedReset 122,663 Nesbitt crossed blocks of 73,000 and 40,000, both at 21.35.
YTW SCENARIO
Maturity Type : Limit Maturity
Maturity Date : 2044-06-18
Maturity Price : 21.40
Evaluated at bid price : 21.40
Bid-YTW : 3.63 %
ENB.PR.B FixedReset 111,447 TD crossed 50,000 at 24.45. Scotia crossed 45,000 at the same price.
YTW SCENARIO
Maturity Type : Limit Maturity
Maturity Date : 2044-06-18
Maturity Price : 23.20
Evaluated at bid price : 24.50
Bid-YTW : 4.01 %
BMO.PR.T FixedReset 102,825 Recent new issue.
YTW SCENARIO
Maturity Type : Limit Maturity
Maturity Date : 2044-06-18
Maturity Price : 23.17
Evaluated at bid price : 25.07
Bid-YTW : 3.72 %
ENB.PF.C FixedReset 78,623 Recent new issue.
YTW SCENARIO
Maturity Type : Limit Maturity
Maturity Date : 2044-06-18
Maturity Price : 23.13
Evaluated at bid price : 25.02
Bid-YTW : 4.19 %
MFC.PR.L FixedReset 55,140 Scotia crossed blocks of 10,000 and 25,000, both at 24.91.
YTW SCENARIO
Maturity Type : Hard Maturity
Maturity Date : 2025-01-31
Maturity Price : 25.00
Evaluated at bid price : 24.99
Bid-YTW : 3.85 %
There were 41 other index-included issues trading in excess of 10,000 shares.
Wide Spread Highlights
Issue Index Quote Data and Yield Notes
MFC.PR.F FixedReset Quote: 22.92 – 23.57
Spot Rate : 0.6500
Average : 0.5030

YTW SCENARIO
Maturity Type : Hard Maturity
Maturity Date : 2025-01-31
Maturity Price : 25.00
Evaluated at bid price : 22.92
Bid-YTW : 4.24 %

PWF.PR.P FixedReset Quote: 23.57 – 23.98
Spot Rate : 0.4100
Average : 0.2784

YTW SCENARIO
Maturity Type : Limit Maturity
Maturity Date : 2044-06-18
Maturity Price : 23.16
Evaluated at bid price : 23.57
Bid-YTW : 3.51 %

IAG.PR.A Deemed-Retractible Quote: 23.13 – 23.48
Spot Rate : 0.3500
Average : 0.2330

YTW SCENARIO
Maturity Type : Hard Maturity
Maturity Date : 2025-01-31
Maturity Price : 25.00
Evaluated at bid price : 23.13
Bid-YTW : 5.55 %

RY.PR.F Deemed-Retractible Quote: 25.77 – 26.07
Spot Rate : 0.3000
Average : 0.1860

YTW SCENARIO
Maturity Type : Call
Maturity Date : 2014-07-18
Maturity Price : 25.50
Evaluated at bid price : 25.77
Bid-YTW : -4.79 %

MFC.PR.D FixedReset Quote: 25.00 – 25.25
Spot Rate : 0.2500
Average : 0.1415

YTW SCENARIO
Maturity Type : Hard Maturity
Maturity Date : 2025-01-31
Maturity Price : 25.00
Evaluated at bid price : 25.00
Bid-YTW : 6.20 %

IFC.PR.C FixedReset Quote: 25.71 – 26.00
Spot Rate : 0.2900
Average : 0.2042

YTW SCENARIO
Maturity Type : Call
Maturity Date : 2016-09-30
Maturity Price : 25.00
Evaluated at bid price : 25.71
Bid-YTW : 2.86 %

A New Regular Table for PrefLetter: PerpetualPremiums & PerpetualDiscounts

Wednesday, June 18th, 2014

Assiduous Reader RH asked for it and next issue it will be here: a regular table of PerpetualPremiums and PerpetualDiscounts, both Investment Grade and Junk.

Click here for a mock-up, prepared as of the Close of Business today.

I realize the title is a little clumsy, but according to me, the term “Straight Perpetual” includes DeemedRetractibles, which have a table of their own.

TD.PR.I and TD.PR.K Called For Redemption

Wednesday, June 18th, 2014

The Toronto-Dominion Bank has announced:

that it will exercise its right to redeem all of its 11 million outstanding Non-cumulative 5-Year Rate Reset Preferred Shares, Series AI (the “Series AI Shares”) on July 31, 2014 at the price per share of $25.00, for an aggregate total of approximately $275 million.

TD also announced it will exercise its right to redeem all of its 14 million outstanding Non-cumulative 5-Year Rate Reset Preferred Shares, Series AK (the “Series AK Shares”) on July 31, 2014 at the price per share of $25.00, for an aggregate total of approximately $350 million.

On May 22, 2014, the Board of Directors of TD declared quarterly dividends of $0.390625 per Series AI Share and $0.390625 per Series AK Share. These will be the final dividends on the Series AI Shares and Series AK Shares, respectively, and will be paid in the usual manner on July 31, 2014 to shareholders of record on July 8, 2014, as previously announced. After July 31, 2014, the Series AI Shares and Series AK Shares will cease to be entitled to dividends and the holders of such shares will not be entitled to exercise any right in respect thereof except that of receiving the redemption amount.

With the announcement of the redemption of the Series AI Shares and Series AK Shares, the right of any holder of Series AI Shares or Series AK Shares to convert such shares will cease and terminate.

Beneficial holders who are not directly the registered holder of Series AI Shares or Series AK Shares should contact the financial institution, broker or other intermediary through which they hold these shares to confirm how they will receive their redemption proceeds. Instructions with respect to receipt of the redemption amount will be set out in the Letter of Transmittal to be mailed to registered holders of the Series AI Shares and Series AK Shares shortly. Inquiries should be directed to our Registrar and Transfer Agent, CST Trust Company, at 1-800-387-0825 (or in Toronto 416-682-3860).

No surprises here. TD.PR.I is a FixedReset, 6.25%+415, which commenced trading 2009-3-6 after being announced 2009-2-25.

TD.PR.K is a FixedReset,6.25%+433, which commenced trading 2009-4-3 after being announced 2009-3-25.

June 17, 2014

Tuesday, June 17th, 2014

Good news, folks! When you (or your bank) applies for mortgage insurance now, there will be a large bureaucracy in place to determine whether the house is appropriate for you:

The head of Canada Mortgage and Housing Corp. is shifting the priority of the mortgage insurer to helping Canadians buy homes they need, not the bigger, pricier homes they might want.

“We help Canadians meet their housing needs, not exceed them,” Mr. Siddall told The Globe and Mail’s editorial board, as he outlined the mandate that will guide his time at the helm of the mortgage insurer.

Assiduous Readers will remember (probably while grinning) how annoyed I get when the old World Economic Forum survey is trotted out to buttress claims that ‘Canadian banks are the stongest in the world’, thanks to our wise and woefully underpaid regulators.

Bloomberg Markets magazine has compiled its own list of the world’s individually strongest banks; not the same thing as ‘strongest national system’ admittedly; but on the other hand at least banks were ranked against each other on a basis that at least purports to be consistent. And guess what?

iKxi7WRgT1Rs
Click for Big

How much is are market orders worth? Quite a bit!

Senators led by Carl Levin grilled brokerage and stock-market executives at a hearing over the various incentives that underpin U.S. equity trading, including rebates exchanges use to lure volume, and the payments market-making firms such Citadel LLC and Citigroup Inc. (C) give retail brokers.

TD Ameritrade Holding Corp. (AMTD), one of the biggest online brokers, last week gave an inkling of the money involved. The Omaha, Nebraska-based firm revealed that it pocketed $236 million in 2013 from firms that paid to execute its customers’ orders.

Larry Tabb, CEO of Tabb Group LLC, estimates that retail orders that are sent to market-makers and executed away from exchanges account for 15 percent of total U.S. volume. He doesn’t anticipate that the SEC will take any imminent action to limit the practice.

Under the payment for order flow system, online brokers agree to send their customers’ trades to specific securities firms for execution. These wholesalers include Citadel, KCG Holdings Inc. (KCG) and Citigroup.

Tabb said among the benefits of selling customer orders are that online brokers don’t need to set up their own trading desks. The payment system also keeps relationships above-board, he said, though the regulator “could do a better job in terms of forcing greater transparency,” he said.

Tabb was mentioned on June 12, pushing block trades,

There was another TD Ameritrade nugget:

One telling moment occurred during the questioning of Steven Quirk, senior vice-president at TD Ameritrade, the retail brokerage partially owned by Toronto-Dominion Bank. Mr. Quirk said that nearly all of the broker’s limit orders – that is, orders that do not have to be placed immediately – are routed to the trading venue that pays the highest rebate to receive such traffic. Critics allege that such a practice can result in customers receiving less advantageous pricing.

Not so much less advantageous pricing – it’s a limit order – but slower execution (at best) for resting orders on an expensive exchange, as discussed on May 22 and April 21.

It was a mixed day for the Canadian preferred share market, with PerpetualDiscounts off 8bp, FixedResets up 5bp and DeemedRetractibles gaining 2bp. Volatility was low. Volume was average.

HIMIPref™ Preferred Indices
These values reflect the December 2008 revision of the HIMIPref™ Indices

Values are provisional and are finalized monthly
Index Mean
Current
Yield
(at bid)
Median
YTW
Median
Average
Trading
Value
Median
Mod Dur
(YTW)
Issues Day’s Perf. Index Value
Ratchet 0.00 % 0.00 % 0 0.00 0 0.1554 % 2,475.0
FixedFloater 4.45 % 3.70 % 28,485 17.94 1 1.6175 % 3,860.6
Floater 2.96 % 3.09 % 44,733 19.51 4 0.1554 % 2,672.3
OpRet 4.38 % -7.69 % 25,053 0.08 2 1.9265 % 2,708.4
SplitShare 4.81 % 4.24 % 59,858 4.12 5 0.0159 % 3,113.9
Interest-Bearing 0.00 % 0.00 % 0 0.00 0 1.9265 % 2,476.6
Perpetual-Premium 5.51 % -1.27 % 81,204 0.08 17 0.1523 % 2,405.7
Perpetual-Discount 5.27 % 5.28 % 117,297 14.95 20 -0.0814 % 2,549.0
FixedReset 4.50 % 3.71 % 211,943 6.77 79 0.0523 % 2,535.6
Deemed-Retractible 5.00 % 0.78 % 139,635 0.12 43 0.0158 % 2,532.2
FloatingReset 2.66 % 2.39 % 127,987 3.95 6 0.1455 % 2,490.6
Performance Highlights
Issue Index Change Notes
ENB.PR.H FixedReset 1.03 % YTW SCENARIO
Maturity Type : Limit Maturity
Maturity Date : 2044-06-17
Maturity Price : 22.66
Evaluated at bid price : 23.63
Bid-YTW : 3.95 %
BAM.PR.G FixedFloater 1.62 % YTW SCENARIO
Maturity Type : Limit Maturity
Maturity Date : 2044-06-17
Maturity Price : 21.76
Evaluated at bid price : 21.36
Bid-YTW : 3.70 %
FTS.PR.E OpRet 3.90 % Not really all that real. As Assiduous Reader adrian2 pointed out in the comments yesterday, yesterday’s price was just another TMX screw up, although I don’t know whether it was a genuine market-maker’s fiasco or merely an after-hours cancellation fiasco.
YTW SCENARIO
Maturity Type : Call
Maturity Date : 2014-07-17
Maturity Price : 25.50
Evaluated at bid price : 25.82
Bid-YTW : -7.69 %
Volume Highlights
Issue Index Shares
Traded
Notes
SLF.PR.G FixedReset 154,651 RBC crossed 133,100 at 22.20.
YTW SCENARIO
Maturity Type : Hard Maturity
Maturity Date : 2025-01-31
Maturity Price : 25.00
Evaluated at bid price : 22.20
Bid-YTW : 4.47 %
CM.PR.O FixedReset 126,980 Recent new issue.
YTW SCENARIO
Maturity Type : Limit Maturity
Maturity Date : 2044-06-17
Maturity Price : 23.18
Evaluated at bid price : 25.08
Bid-YTW : 3.78 %
BMO.PR.T FixedReset 89,360 Recent new issue.
YTW SCENARIO
Maturity Type : Limit Maturity
Maturity Date : 2044-06-17
Maturity Price : 23.17
Evaluated at bid price : 25.05
Bid-YTW : 3.73 %
FTS.PR.G FixedReset 60,725 TD crossed 60,000 at 24.90.
YTW SCENARIO
Maturity Type : Limit Maturity
Maturity Date : 2044-06-17
Maturity Price : 23.15
Evaluated at bid price : 24.79
Bid-YTW : 3.69 %
TD.PF.A FixedReset 55,180 Recent new issue
YTW SCENARIO
Maturity Type : Limit Maturity
Maturity Date : 2044-06-17
Maturity Price : 23.19
Evaluated at bid price : 25.15
Bid-YTW : 3.71 %
RY.PR.H FixedReset 53,918 Recent new issue.
YTW SCENARIO
Maturity Type : Limit Maturity
Maturity Date : 2044-06-17
Maturity Price : 23.18
Evaluated at bid price : 25.09
Bid-YTW : 3.74 %
There were 32 other index-included issues trading in excess of 10,000 shares.
Wide Spread Highlights
Issue Index Quote Data and Yield Notes
MFC.PR.F FixedReset Quote: 22.85 – 23.35
Spot Rate : 0.5000
Average : 0.3418

YTW SCENARIO
Maturity Type : Hard Maturity
Maturity Date : 2025-01-31
Maturity Price : 25.00
Evaluated at bid price : 22.85
Bid-YTW : 4.28 %

CIU.PR.C FixedReset Quote: 20.55 – 21.15
Spot Rate : 0.6000
Average : 0.4703

YTW SCENARIO
Maturity Type : Limit Maturity
Maturity Date : 2044-06-17
Maturity Price : 20.55
Evaluated at bid price : 20.55
Bid-YTW : 3.71 %

TD.PR.O Deemed-Retractible Quote: 25.50 – 25.74
Spot Rate : 0.2400
Average : 0.1517

YTW SCENARIO
Maturity Type : Call
Maturity Date : 2014-07-17
Maturity Price : 25.25
Evaluated at bid price : 25.50
Bid-YTW : 0.43 %

BMO.PR.L Deemed-Retractible Quote: 26.50 – 26.70
Spot Rate : 0.2000
Average : 0.1245

YTW SCENARIO
Maturity Type : Call
Maturity Date : 2014-07-17
Maturity Price : 25.75
Evaluated at bid price : 26.50
Bid-YTW : -23.54 %

IAG.PR.G FixedReset Quote: 25.76 – 25.98
Spot Rate : 0.2200
Average : 0.1512

YTW SCENARIO
Maturity Type : Call
Maturity Date : 2017-06-30
Maturity Price : 25.00
Evaluated at bid price : 25.76
Bid-YTW : 3.21 %

GWO.PR.Q Deemed-Retractible Quote: 24.60 – 24.85
Spot Rate : 0.2500
Average : 0.1855

YTW SCENARIO
Maturity Type : Hard Maturity
Maturity Date : 2025-01-31
Maturity Price : 25.00
Evaluated at bid price : 24.60
Bid-YTW : 5.36 %

June 16, 2014

Monday, June 16th, 2014

There was some commentary on Friday’s Treasury action:

Treasury five-year notes extended the longest losing streak this year as traders bet improving economic data will push the Federal Reserve to raise rates as early as July 2015.

The gap between five- and 30-year yields narrowed to almost the least in five years before the Federal Open Market Committee meets next week to discuss a stimulus-exit strategy. The chance of a rate increase to 0.5 percent or more by the end of next July is 58 percent, according to data compiled by Bloomberg based on federal fund futures, up from 43 percent at the end of last month. Long bonds rose as investors reached for higher yields amid U.S. data showing low inflation and unrest in Iraq.

A report yesterday showed a 0.2 percent decrease in the producer price index compared with the median estimate in a Bloomberg survey of 71 economists that called for a 0.1 percent gain. Over the past 12 months, costs climbed 2 percent, figures from the Labor Department showed.

The IMF had some more to say about the US economy:

The International Monetary Fund cut its growth forecast for the U.S. economy this year and said the Federal Reserve may have scope to keep interest rates at zero for longer than investors expect.

The Washington-based IMF now sees the world’s largest economy growing 2 percent this year, down from an April estimate of 2.8 percent. The IMF left a 2015 prediction unchanged at 3 percent, and said it doesn’t expect the U.S. to see full employment until the end of 2017, amid low inflation.

And it appears that even government bond markets are losing liquidity:

Dealers globally have slashed their bond inventories 75 percent since 2007. Five of the six biggest Wall Street firms reported declines in fixed-income trading revenue last quarter.

“That has to bite and prevent dealers from supplying the balance sheet they did in the old days,” Gregory Whiteley, who manages government debt at Los Angeles-based DoubleLine Capital LP, which oversees about $50 billion, said by telephone June 10. “It’s the sort of thing that rears its ugly head when it is least welcome — when it’s the greatest problem.”

Some cracks emerged in Europe last month, when investors dumped Italian, Spanish and Greek debt on speculation political parties opposed to the European Union would gain seats in parliamentary elections and derail the euro area’s recovery.

As the selloff intensified and liquidity decreased, the disparity in yields of 10-year Italian bonds between buyers and sellers based on bids and offers doubled to 6 basis points, or 0.06 percentage point, on May 23, the highest this year.

It was a positive day for the Canadian preferred share market, with PerpetualDiscounts winning 18bp, FixedResets up 6bp and DeemedRetractibles gaining 1bp. Volatility was reasonable. Volume was low.

HIMIPref™ Preferred Indices
These values reflect the December 2008 revision of the HIMIPref™ Indices

Values are provisional and are finalized monthly
Index Mean
Current
Yield
(at bid)
Median
YTW
Median
Average
Trading
Value
Median
Mod Dur
(YTW)
Issues Day’s Perf. Index Value
Ratchet 0.00 % 0.00 % 0 0.00 0 -0.6178 % 2,471.2
FixedFloater 4.52 % 3.78 % 28,285 17.82 1 0.4300 % 3,799.2
Floater 2.97 % 3.10 % 44,904 19.49 4 -0.6178 % 2,668.2
OpRet 4.47 % -7.09 % 109,347 0.09 2 -1.8136 % 2,657.2
SplitShare 4.81 % 4.20 % 58,247 4.12 5 0.0000 % 3,113.4
Interest-Bearing 0.00 % 0.00 % 0 0.00 0 -1.8136 % 2,429.8
Perpetual-Premium 5.52 % -1.45 % 81,948 0.08 17 0.0115 % 2,402.0
Perpetual-Discount 5.26 % 5.29 % 112,708 14.94 20 0.1823 % 2,551.1
FixedReset 4.50 % 3.71 % 212,650 6.77 79 0.0590 % 2,534.3
Deemed-Retractible 5.00 % 2.00 % 145,327 0.19 43 0.0130 % 2,531.8
FloatingReset 2.67 % 2.46 % 126,355 3.96 6 -0.1914 % 2,487.0
Performance Highlights
Issue Index Change Notes
FTS.PR.E OpRet -3.94 % YTW SCENARIO
Maturity Type : Soft Maturity
Maturity Date : 2016-08-31
Maturity Price : 25.00
Evaluated at bid price : 24.85
Bid-YTW : 5.32 %
BAM.PR.C Floater -1.11 % YTW SCENARIO
Maturity Type : Limit Maturity
Maturity Date : 2044-06-16
Maturity Price : 16.91
Evaluated at bid price : 16.91
Bid-YTW : 3.10 %
MFC.PR.C Deemed-Retractible 1.11 % YTW SCENARIO
Maturity Type : Hard Maturity
Maturity Date : 2025-01-31
Maturity Price : 25.00
Evaluated at bid price : 22.70
Bid-YTW : 5.69 %
FTS.PR.J Perpetual-Discount 1.15 % YTW SCENARIO
Maturity Type : Limit Maturity
Maturity Date : 2044-06-16
Maturity Price : 23.36
Evaluated at bid price : 23.70
Bid-YTW : 5.03 %
BAM.PF.A FixedReset 1.19 % YTW SCENARIO
Maturity Type : Call
Maturity Date : 2018-09-30
Maturity Price : 25.00
Evaluated at bid price : 25.60
Bid-YTW : 3.87 %
MFC.PR.K FixedReset 1.45 % YTW SCENARIO
Maturity Type : Call
Maturity Date : 2018-09-19
Maturity Price : 25.00
Evaluated at bid price : 25.11
Bid-YTW : 3.70 %
Volume Highlights
Issue Index Shares
Traded
Notes
ENB.PF.C FixedReset 239,289 Recent new issue.
YTW SCENARIO
Maturity Type : Limit Maturity
Maturity Date : 2044-06-16
Maturity Price : 23.12
Evaluated at bid price : 25.00
Bid-YTW : 4.19 %
TD.PR.S FixedReset 127,500 RBC crossed blocks of 49,900 and 71,400, both at 25.17.
YTW SCENARIO
Maturity Type : Hard Maturity
Maturity Date : 2022-01-31
Maturity Price : 25.00
Evaluated at bid price : 25.12
Bid-YTW : 3.30 %
CM.PR.O FixedReset 113,144 Recent new issue.
YTW SCENARIO
Maturity Type : Limit Maturity
Maturity Date : 2044-06-16
Maturity Price : 23.17
Evaluated at bid price : 25.06
Bid-YTW : 3.78 %
BMO.PR.T FixedReset 70,970 Recent new issue.
YTW SCENARIO
Maturity Type : Limit Maturity
Maturity Date : 2044-06-16
Maturity Price : 23.16
Evaluated at bid price : 25.02
Bid-YTW : 3.73 %
TD.PR.K FixedReset 68,515 TD crossed 50,000 at 25.36.
YTW SCENARIO
Maturity Type : Call
Maturity Date : 2014-07-31
Maturity Price : 25.00
Evaluated at bid price : 25.36
Bid-YTW : 1.12 %
TD.PF.A FixedReset 46,860 Recent new issue.
YTW SCENARIO
Maturity Type : Limit Maturity
Maturity Date : 2044-06-16
Maturity Price : 23.17
Evaluated at bid price : 25.11
Bid-YTW : 3.71 %
There were 23 other index-included issues trading in excess of 10,000 shares.
Wide Spread Highlights
Issue Index Quote Data and Yield Notes
FTS.PR.E OpRet Quote: 24.85 – 26.00
Spot Rate : 1.1500
Average : 0.6655

YTW SCENARIO
Maturity Type : Soft Maturity
Maturity Date : 2016-08-31
Maturity Price : 25.00
Evaluated at bid price : 24.85
Bid-YTW : 5.32 %

BAM.PR.K Floater Quote: 16.82 – 17.63
Spot Rate : 0.8100
Average : 0.5157

YTW SCENARIO
Maturity Type : Limit Maturity
Maturity Date : 2044-06-16
Maturity Price : 16.82
Evaluated at bid price : 16.82
Bid-YTW : 3.11 %

BAM.PR.B Floater Quote: 16.90 – 17.20
Spot Rate : 0.3000
Average : 0.1906

YTW SCENARIO
Maturity Type : Limit Maturity
Maturity Date : 2044-06-16
Maturity Price : 16.90
Evaluated at bid price : 16.90
Bid-YTW : 3.10 %

BAM.PR.C Floater Quote: 16.91 – 17.22
Spot Rate : 0.3100
Average : 0.2073

YTW SCENARIO
Maturity Type : Limit Maturity
Maturity Date : 2044-06-16
Maturity Price : 16.91
Evaluated at bid price : 16.91
Bid-YTW : 3.10 %

BNS.PR.C FloatingReset Quote: 25.25 – 25.50
Spot Rate : 0.2500
Average : 0.1711

YTW SCENARIO
Maturity Type : Hard Maturity
Maturity Date : 2022-01-31
Maturity Price : 25.00
Evaluated at bid price : 25.25
Bid-YTW : 2.72 %

CU.PR.C FixedReset Quote: 25.55 – 25.89
Spot Rate : 0.3400
Average : 0.2637

YTW SCENARIO
Maturity Type : Call
Maturity Date : 2017-06-01
Maturity Price : 25.00
Evaluated at bid price : 25.55
Bid-YTW : 3.29 %