The Boston Fed has released a Policy Perspective by Paul S. Willen titled Why Mortgage Rates Exceed Treasury Yields:
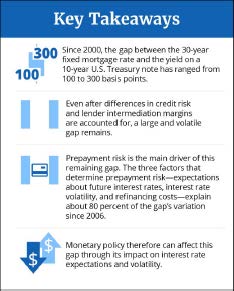
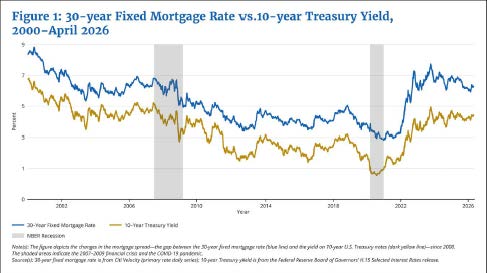
As Figure 1 (next page) shows, the gap between the primary mortgage rate and the 10-year Treasury yield, often called the mortgage spread, has varied dramatically since 2000, ranging from more than 300 basis points during the 2007–2009 financial crisis to less than 100 basis points in 2021 (a basis point is one-hundredth of a percentage point).
The mortgage spread reflects several distinct factors stacked on top of each other. Lenders typically bundle mortgages that they originate into mortgage-backed securities (MBS) and sell them to investors. An MBS and a Treasury security have very different cash flows. First, a Treasury security returns the principal in a lump sum at maturity, while an MBS returns the principal gradually as borrowers amortize (make their monthly fixed payments) until they sell their homes and/or refinance. Second, an MBS carries credit risk because borrowers might default on their mortgages. Third, mortgage lenders incur intermediation costs to originate a loan, package it into an MBS, and sell the MBS to investors, and they charge borrowers a margin to cover these costs.
Even after these three factors are accounted for, a large and volatile gap between mortgage rates and Treasury yields remains. I refer to this gap as the coupon spread, in reference to the difference between interest rates paid by mortgage-backed securities and Treasury yields when I control for the aforementioned factors. I argue that the coupon spread largely reflects the price of the prepayment option—a borrower’s right to pay off their mortgage at any time without incurring a penalty.
The prepayment option creates an asymmetry that benefits borrowers at the expense of MBS investors: When mortgage rates fall, borrowers refinance, and investors get their principal back at a time when reinvestment yields are lower; when rates rise, borrowers hold on to their low-rate mortgages and MBS investors stay locked into below-market coupons. Borrowers win in both scenarios; investors lose in both. Because this asymmetry is costly to investors, they demand compensation in the form of higher mortgage rates.
…
I measure the three factors identified in the preceding section—expectations about future interest rates, interest rate volatility, and the cost of refinancing—and estimate their contributions to coupon spread variation using a rolling regression—a statistical model that is re-estimated each week using only the preceding five years of data, allowing the relationship between each of the three factors and the spread to evolve over time. Together, these factors explain approximately 80 percent of the variation in the coupon spread since 2006.
I’m not sure how much I buy into this analysis. I’m deeply suspicious of anything involving regression and I feel that any such discussion which does not include liquidity is flawed. But who knows? In my next lifetime, perhaps I’ll give preferred shares a pass and concentrate on mortgage bonds. After all, they’re a big part of my grand plan to break up Canadian banks!
Canadian inflation numbers came out today:
Inflation rose to 2.8 per cent in April, Statistics Canada said Tuesday – the highest annual inflation rate since May, 2024.
StatCan’s April report marks a jump from March’s inflation rate of 2.4 per cent, though a Reuters poll of economists had expected inflation would accelerate even more to top three per cent.
StatCan said the cost of gasoline was 28.6 per cent higher year-over-year last month as conflict in the Middle East disrupted global oil shipments, sending costs soaring at the gas pumps. April also marked the switch to more expensive summer gasoline blends at gas stations in Canada.
It’s unfortunate that the story does not report on core inflation, but those who don’t like it always have the option of writing an extremely large cheque to The Canadian Press (who distributed the story) and the G&M (who did not come up with a competing version) to enable the hiring of long-term beat reporters who know their subjects. Nobody will, because the internet should be free!
And StatsCan has the figures. See Table 4 of their release for the alternative inflation measures: CPI-median was up 2.1% yoy, while CPI-trim gained 2.0% yoy. Bang on target!
Bonds continued to get hammered:
The 30-year US Treasury yield just hit 5.2%, its highest level since 2007, rising on worries about persistent price hikes because of the Iran war. Unsustainable government finances and interest rate hike fears have also sent investors pouring out of Treasury bonds. Yields rise when bond prices fall.
…
The benchmark 10-year yield, which influences mortgage rates, surged to 4.67%, its highest level in over a year.
…
The 30-year UK gilt yield hit its highest level since 1998. Japan’s 30-year bond yield hit its highest level on record.
…
It’s been 80 days since the war with Iran began. The stock market tumbled before reclaiming record highs. The bond market never recovered. The 10-year yield traded at just below 4% before the war with Iran started and is now approaching 4.7% as a sell-off has picked up steam in recent trading sessions.
In the Frozen North, five-years hit 3.35%; ten-years 3.70%; and thirty-years 4.04%. What a time to be alive!
| HIMIPref™ Preferred Indices These values reflect the December 2008 revision of the HIMIPref™ Indices Values are provisional and are finalized monthly |
|||||||
| Index | Mean Current Yield (at bid) |
Median YTW |
Median Average Trading Value |
Median Mod Dur (YTW) |
Issues | Day’s Perf. | Index Value |
| Ratchet | 0.00 % | 0.00 % | 0 | 0.00 | 0 | 0.3392 % | 2,544.1 |
| FixedFloater | 0.00 % | 0.00 % | 0 | 0.00 | 0 | 0.3392 % | 4,824.1 |
| Floater | 5.64 % | 5.86 % | 44,599 | 14.06 | 3 | 0.3392 % | 2,780.1 |
| OpRet | 0.00 % | 0.00 % | 0 | 0.00 | 0 | 0.2204 % | 3,665.9 |
| SplitShare | 4.75 % | 4.72 % | 49,352 | 2.80 | 5 | 0.2204 % | 4,377.8 |
| Interest-Bearing | 0.00 % | 0.00 % | 0 | 0.00 | 0 | 0.2204 % | 3,415.7 |
| Perpetual-Premium | 5.77 % | 4.60 % | 54,310 | 0.08 | 3 | 0.0397 % | 3,047.3 |
| Perpetual-Discount | 5.63 % | 5.72 % | 54,273 | 14.28 | 30 | -0.0218 % | 3,344.3 |
| FixedReset Disc | 5.65 % | 6.04 % | 101,406 | 13.63 | 24 | -0.1645 % | 3,300.8 |
| Insurance Straight | 5.49 % | 5.58 % | 52,790 | 14.43 | 22 | -0.1347 % | 3,286.0 |
| FloatingReset | 0.00 % | 0.00 % | 0 | 0.00 | 0 | -0.1645 % | 3,926.6 |
| FixedReset Prem | 5.98 % | 4.58 % | 85,076 | 2.32 | 24 | -0.1333 % | 2,651.9 |
| FixedReset Bank Non | 0.00 % | 0.00 % | 0 | 0.00 | 0 | -0.1645 % | 3,374.1 |
| FixedReset Ins Non | 5.07 % | 5.38 % | 73,765 | 2.15 | 14 | -0.1499 % | 3,260.7 |
| Performance Highlights | |||
| Issue | Index | Change | Notes |
| ENB.PR.F | FixedReset Disc | -2.87 % | YTW SCENARIO Maturity Type : Limit Maturity Maturity Date : 2056-05-19 Maturity Price : 22.68 Evaluated at bid price : 23.00 Bid-YTW : 6.35 % |
| BN.PF.A | FixedReset Prem | -2.04 % | YTW SCENARIO Maturity Type : Limit Maturity Maturity Date : 2056-05-19 Maturity Price : 23.67 Evaluated at bid price : 25.50 Bid-YTW : 6.24 % |
| BN.PR.X | FixedReset Disc | -1.87 % | YTW SCENARIO Maturity Type : Limit Maturity Maturity Date : 2056-05-19 Maturity Price : 21.00 Evaluated at bid price : 21.00 Bid-YTW : 6.19 % |
| MFC.PR.L | FixedReset Ins Non | -1.81 % | YTW SCENARIO Maturity Type : Limit Maturity Maturity Date : 2056-05-19 Maturity Price : 23.37 Evaluated at bid price : 25.00 Bid-YTW : 5.59 % |
| MFC.PR.I | FixedReset Ins Non | -1.54 % | YTW SCENARIO Maturity Type : Call Maturity Date : 2027-09-19 Maturity Price : 25.00 Evaluated at bid price : 25.60 Bid-YTW : 4.90 % |
| SLF.PR.G | FixedReset Ins Non | -1.46 % | YTW SCENARIO Maturity Type : Limit Maturity Maturity Date : 2056-05-19 Maturity Price : 20.97 Evaluated at bid price : 20.97 Bid-YTW : 5.61 % |
| FTS.PR.J | Perpetual-Discount | -1.20 % | YTW SCENARIO Maturity Type : Limit Maturity Maturity Date : 2056-05-19 Maturity Price : 21.91 Evaluated at bid price : 22.15 Bid-YTW : 5.37 % |
| ENB.PR.Y | FixedReset Disc | -1.13 % | YTW SCENARIO Maturity Type : Limit Maturity Maturity Date : 2056-05-19 Maturity Price : 22.23 Evaluated at bid price : 22.72 Bid-YTW : 6.21 % |
| ENB.PR.J | FixedReset Disc | -1.13 % | YTW SCENARIO Maturity Type : Limit Maturity Maturity Date : 2056-05-19 Maturity Price : 22.82 Evaluated at bid price : 23.62 Bid-YTW : 6.28 % |
| GWO.PR.P | Insurance Straight | -1.03 % | YTW SCENARIO Maturity Type : Limit Maturity Maturity Date : 2056-05-19 Maturity Price : 23.69 Evaluated at bid price : 24.00 Bid-YTW : 5.70 % |
| PWF.PR.A | Floater | 1.05 % | YTW SCENARIO Maturity Type : Limit Maturity Maturity Date : 2056-05-19 Maturity Price : 14.41 Evaluated at bid price : 14.41 Bid-YTW : 5.44 % |
| POW.PR.D | Perpetual-Discount | 1.25 % | YTW SCENARIO Maturity Type : Limit Maturity Maturity Date : 2056-05-19 Maturity Price : 22.49 Evaluated at bid price : 22.75 Bid-YTW : 5.55 % |
| ENB.PR.H | FixedReset Disc | 1.40 % | YTW SCENARIO Maturity Type : Limit Maturity Maturity Date : 2056-05-19 Maturity Price : 23.04 Evaluated at bid price : 23.89 Bid-YTW : 5.81 % |
| SLF.PR.H | FixedReset Ins Non | 2.43 % | YTW SCENARIO Maturity Type : Call Maturity Date : 2026-09-30 Maturity Price : 25.00 Evaluated at bid price : 24.90 Bid-YTW : 5.20 % |
| Volume Highlights | |||
| Issue | Index | Shares Traded |
Notes |
| IFC.PR.C | FixedReset Ins Non | 52,500 | YTW SCENARIO Maturity Type : Call Maturity Date : 2026-09-30 Maturity Price : 25.00 Evaluated at bid price : 25.30 Bid-YTW : 1.43 % |
| CU.PR.K | Perpetual-Discount | 37,600 | YTW SCENARIO Maturity Type : Limit Maturity Maturity Date : 2056-05-19 Maturity Price : 24.55 Evaluated at bid price : 24.95 Bid-YTW : 5.62 % |
| MFC.PR.M | FixedReset Ins Non | 31,600 | YTW SCENARIO Maturity Type : Call Maturity Date : 2029-12-20 Maturity Price : 25.00 Evaluated at bid price : 25.35 Bid-YTW : 5.42 % |
| ENB.PR.Y | FixedReset Disc | 29,700 | YTW SCENARIO Maturity Type : Limit Maturity Maturity Date : 2056-05-19 Maturity Price : 22.23 Evaluated at bid price : 22.72 Bid-YTW : 6.21 % |
| PVS.PR.J | SplitShare | 26,000 | YTW SCENARIO Maturity Type : Hard Maturity Maturity Date : 2028-02-29 Maturity Price : 25.00 Evaluated at bid price : 25.18 Bid-YTW : 4.51 % |
| BN.PF.D | Perpetual-Discount | 25,800 | YTW SCENARIO Maturity Type : Limit Maturity Maturity Date : 2056-05-19 Maturity Price : 21.35 Evaluated at bid price : 21.35 Bid-YTW : 5.83 % |
| There were 8 other index-included issues trading in excess of 10,000 shares. | |||
| Wide Spread Highlights | ||
| See TMX DataLinx: ‘Last’ != ‘Close’ and the posts linked therein for an idea of why these quotes are so horrible. | ||
| Issue | Index | Quote Data and Yield Notes |
| BN.PR.X | FixedReset Disc | Quote: 21.00 – 22.73 Spot Rate : 1.7300 Average : 1.1252 YTW SCENARIO |
| NA.PR.C | FixedReset Prem | Quote: 26.10 – 27.10 Spot Rate : 1.0000 Average : 0.5558 YTW SCENARIO |
| PWF.PR.T | FixedReset Disc | Quote: 25.15 – 26.15 Spot Rate : 1.0000 Average : 0.6278 YTW SCENARIO |
| BN.PF.A | FixedReset Prem | Quote: 25.50 – 26.30 Spot Rate : 0.8000 Average : 0.4920 YTW SCENARIO |
| GWO.PR.P | Insurance Straight | Quote: 24.00 – 24.74 Spot Rate : 0.7400 Average : 0.4533 YTW SCENARIO |
| ENB.PR.D | FixedReset Disc | Quote: 22.96 – 23.90 Spot Rate : 0.9400 Average : 0.6649 YTW SCENARIO |