Performance of the HIMIPref™ Indices for January, 2010, was:
| Total Return | ||
| Index | Performance January 2010 |
Three Months to January 29, 2010 |
| Ratchet | +6.60%* | +17.61%* |
| FixFloat | +2.65% | +17.96% |
| Floater | +6.60% | +17.61% |
| OpRet | -0.63% | +1.30% |
| SplitShare | +1.02% | +2.51% |
| Interest | -0.63%**** | +1.30%**** |
| PerpetualPremium | -0.17% | +1.89% |
| PerpetualDiscount | +1.19% | +5.49% |
| FixedReset | 0.00% | +3.32% |
| * The last member of the RatchetRate index was transferred to Scraps at the February, 2009, rebalancing; subsequent performance figures are set equal to the Floater index | ||
| **** The last member of the InterestBearing index was transferred to Scraps at the June, 2009, rebalancing; subsequent performance figures are set equal to the OperatingRetractible index | ||
| Passive Funds (see below for calculations) | ||
| CPD | -0.53% | +3.66% |
| DPS.UN | +1.39% | +6.38% |
| Index | ||
| BMO-CM 50 | +0.61% | +5.05% |
| TXPR Total Return | -0.29% | +4.03% |
The pre-tax interest equivalent spread of PerpetualDiscounts over Long Corporates (which I also refer to as the Seniority Spread) closed the year at 220bp, a slight tightening from the 225bp at November month-end.
The relative returns on Floaters over the past year continues to impress:
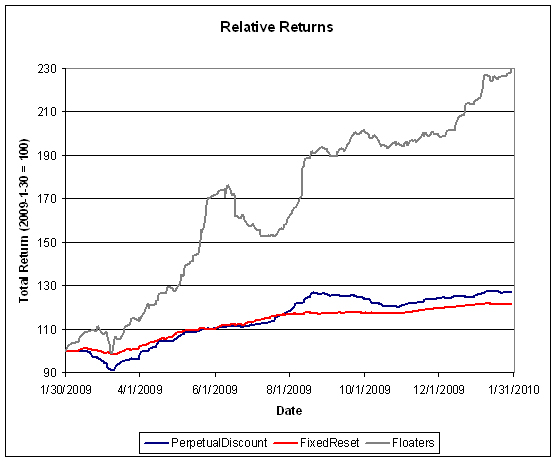
Click for big
But one must remember how they got there:
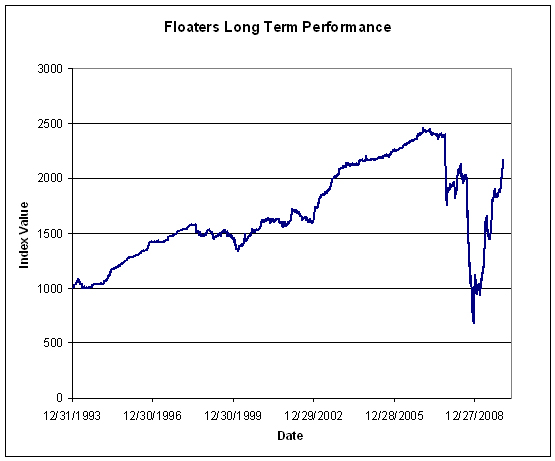
Click for big
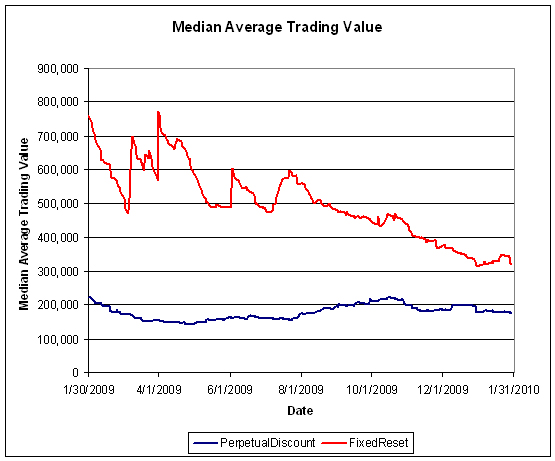
FixedReset volume ticked up mid-month with the burst of issuance, but has resumed its downward trend. Volume may be under-reported due to the influence of Alternative Trading Systems (as discussed in the November PrefLetter), but I am biding my time before incorporating ATS volumes into the calculations, to see if the effect is transient or not. The average volume of FixedResets continues to decline, which may be due to a number of factors:
- The calculation is an exponential moving average with dampening applied to spikes. While this procedure has worked very well in the past (it is used to estimate the maximum size of potential trades when performing simulations) there are no guarantees that it works well this particular time
- Other than the January burst, there hasn’t been much issuance of investment-grade FixedResets recently, which will decrease the liquidity of the whole group, both for technical and real reasons
- The issues are becoming seasoned, as the shares gradually find their way into the accounts of buy-and-hold investors
Click for big
And the yield-to-worst on FixedResets seems to have found a bottom:
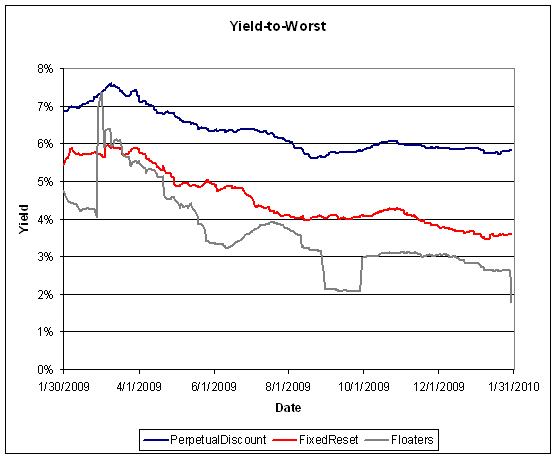
Click for big
As discussed last month, the impressive returns of the past year cannot continue indefinately. The long term return on a fixed income instrument is its yield – 5.8% for a PerpetualDiscount, and about 3.6% to the call date for a FixedReset.
Compositions of the passive funds were discussed in the September edition of PrefLetter.
Claymore has published NAV and distribution data (problems with the page in IE8 can be kludged by using compatibility view) for its exchange traded fund (CPD) and I have derived the following table:
| CPD Return, 1- & 3-month, to January 29, 2010 | ||||
| Date | NAV | Distribution | Return for Sub-Period | Monthly Return |
| October 30 | 16.41 | |||
| November 30, 2009 | 16.77 | +2.19% | ||
| December 24 | 16.76 | 0.21 | +1.19% | +1.98% |
| December 31, 2009 | 16.89 | 0.00 | +0.78% | |
| January 29, 2010 | 16.80 | -0.53% | ||
| Quarterly Return | +3.66% | |||
It is of interest to note that the January total return for CPD’s benchmark, TXPR, was -0.29% and the trailing three-month return was +4.03%; tracking error is therefore -0.24% and -0.37%, of which about 0.04% and 0.11%, respectively, is MER. Their efforts at rebalancing cost unitholders a lot of money! The MER may be only 45bp, but the first 2010 semiannual rebalancing alone cost about 20bp.
Claymore currently holds $397,666,518 (advisor & common combined) in CPD assets, up about $26-million from the $373,729,364 reported last month.
The DPS.UN NAV for December 30 has been published so we may calculate the approximate December returns.
| DPS.UN NAV Return, January-ish 2010 | ||||
| Date | NAV | Distribution | Return for sub-period | Return for period |
| December 30, 2009 | 19.91 | |||
| January 27, 2009 | 20.26 | +1.76% | ||
| Estimated December Ending Stub | -0.36% * | |||
| Estimated January Ending Stub | +0.00% ** | |||
| Estimated January Return | +1.39% *** | |||
| *CPD had a NAVPU of 16.89 on December 31 and 16.83 on December 30, hence the total return for the period for CPD was +0.36%. The return for DPS.UN in this period is presumed to be equal. | ||||
| **CPD had a NAVPU of 16.80 on January 27 and 16.80 on January 29, hence the total return for the period for CPD was 0.00%. The return for DPS.UN in this period is presumed to be equal. | ||||
| *** The estimated December return for DPS.UN’s NAV is therefore the product of three period returns, +1.76%, -0.36% and 0.00% to arrive at an estimate for the calendar month of +1.39% | ||||
Now, to see the DPS.UN quarterly NAV approximate return, we refer to the calculations for November and December:
| DPS.UN NAV Returns, three-month-ish to end-January-ish, 2010 | |
| November-ish | +3.09% |
| December-ish | +1.78% |
| January-ish | +1.39% |
| Three-months-ish | +6.38% |
[…] fund performed well in January, outperforming the indices and the closed end funds by a most satisfactory […]
[…] For example, moronic trading in POW.PR.C triggered by index rebalancing, was a large factor in CPD’s large tracking error in January […]
[…] to see the DPS.UN quarterly NAV approximate return, we refer to the calculations for January and […]