Senate Banking Committee hearings on the Credit Rating Agencies have commenced.
The committee has published remarks by the politicians and statements from witnesses on its website. Of great interest is the testimony from Professor John C. Coffee, Jr., of Columbia Law School. He criticizes Levitt’s proposals:
Although conflicts of interest are critical, it is far from clear that they can simply be eliminated. The fundamental conflict is that the issuer hires the rating agency to rate its debt (just as the issuer also hires the auditor to audit its financial statements). It is not easy to move to a different system. To be sure, until the early 1970s, the rating agencies were paid by their subscribers, not the issuer. But they barely broke even under this system. More generally, the deeper problem with subscription-funded ratings is that there is no way to tax the free rider.
…
Bureaucratic regulation faces other problems. It does not seem within the effective capacity of the SEC, or any more specialized agency, to define what an investment grade rating should mean or the process by which it is determined. Such efforts would only produce a telephone book-length code of regulations, which skilled corporate lawyers could easily outflank.
Sadly, he did not discuss Levitt’s five recommendations in detail. He did, however, make three recommendations of his own:
Proposal One: Disclose Default Rates On Each Rating Grade For Each Product. … the SEC could calculate the five year cumulative default rates on different classes of financial products for each rating agency and disclose this data on one centralized web site. Admittedly, Moody’s already discloses such information on its own web site, but others do not, and it is the comparison that is critical.
…
Proposal Two: Forfeiture of NRSRO Status. … In principle, rating agencies should compete in terms of their relative accuracy. But the market does not appear to penalize inaccuracy very heavily, and corporate issuers may prefer the rater with the most optimistic bias. The best response to this problem is to make the rating agency’s status as an NRSRO depend upon maintaining an acceptable level of accuracy. … This proposal would not bar a rating agency from continuing to issue ratings during any period in which it was disqualified as an NRSRO, but such ratings would be useful only for their informative value, not their legal impact.
…
Proposal Three: A Transparency Rule: Encourage the Growth of Subscription-Based Rating Agencies By Giving Them Access to the Same Data Made Available By the Issuer to Any Other Rating Agency.
The point regarding Proposal Two is introduced earlier in his remarks:
In other markets, a professional whose advice was demonstrably inaccurate would lose business. But this does not necessarily hold true in the market for debt ratings, because the service providers in this market are not simply providing information through their ratings. They are also conferring a governmentally-delegated permission to buy upon institutional investors that are legally restricted to purchasing securities rated investment grade.6 This is the real significance of the SEC’s Nationally Recognized Statistical Rating Organization (or “NRSRO”) designation, because only a rating agency with this designation can render debt securities eligible for purchase by many investors. Put bluntly, an NRSRO can sell its services to issuers, even if the market distrusts the accuracy of its ratings, because it is in effect licensing the issuer to sell its debt to certain regulated investors. This is a power that no other gatekeeper possesses.
I should point out that the statement In other markets, a professional whose advice was demonstrably inaccurate would lose business. is demonstrably false. There are many, many professionals in the business who are chronic underperformers and still do quite well, thank you very much. I suggest that if the regulators wish to intervene to improve capital market efficiency to such an extent, they would be better off imposing performance measurements on stockbrokers and portfolio managers. This will not happen; nor would I support it happening.
Dr. Lawrence J. White, Professor of Economics at NYW was the next to speak:
I would strongly prefer the simple elimination of the NRSRO designation and the concomitant withdrawal of the regulatory delegations of safety judgments that have given so much power to the SEC’s NRSRO decisions. The participants in the financial markets could then freely decide which bond rating organizations (if any) are worthy of their trust and dealings, while financial regulators and their regulated institutions could devise more direct ways of determining the appropriateness of bonds for those institutions’ portfolios. Also, I fear that some of the “good character” provisions of the Act might be used in the future to create new barriers to entry.
He analyzes the Agencies role in the current kerfuffle, stating:
Here, the story as to why the bond raters have been slow to downgrade is clearer. To a large extent — with only one new element — it is a repeat of the reasons for their delay in the Enron and other, earlier downgrades.
First, the bond rating firms have a conscious policy of not trying to adjust their ratings with respect to short-run changes in financial circumstances; instead, they try to “rate through the cycle”. Regardless of the general wisdom of such a philosophy, it does mean that when the short-run changes are not part of a cycle but instead are the beginning of a longer-run trend, the bond raters will be slow to recognize that trend and thus slow to adjust their ratings.
…
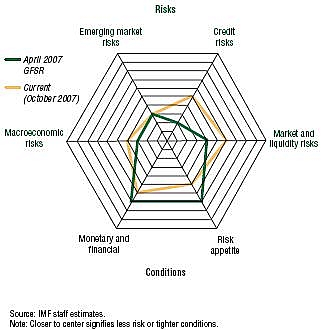
Fourth, and this is a new element in the current situation, the bond raters have had to deal with (for them) a new kind of risk. For their traditional ratings of corporate, municipal, and sovereign bonds, and even for rating simple MBS, they have focused solely on credit (or default) risk: the possibility that the borrower will fail to repay its obligations in full and in a timely manner. In rating collateralized debt obligations (CDOs), however, where the underlying collateral was MBS and other securities, an extra feature could affect the ability of the CDOs to be paid off in full and in a timely manner: liquidity risk, which is the risk that the markets for the underlying collateral will become illiquid (perhaps because of fears and uncertainties among market participants as to underlying repayment possibilities), leading to unusually wide spreads between bid and ask prices for those underlying securities. Those wider spreads, in turn, could trigger forced liquidations of the asset pools underlying the CDOs and lead to unexpected losses to the investors in the CDO securities, even if the underlying collateral were ultimately to perform with respect to credit risk along the lines that had been predicted.
Holders of, for instance, DG.UN, will know all about the fourth risk!
Readers will not be surprised at my rapturous applause for his conclusion:
I strongly urge the Congress not to undertake any legislative action that would attempt to correct any perceived shortcomings of the bond rating firms.
I base this plea on two grounds: First, it is difficult, if not impossible, to legislate remedies that could somehow command the bond raters to do a better job. One could imagine legislation that would mandate certain business models — say, forcing the industry back to its pre-1970s model of selling ratings to investors, because of concerns about potential conflicts of interest — or that would mandate certain standards of required expertise as inputs into the rating process. But such legislation risks doing far more harm than good, by rigidifying the industry and reducing flexibility and diversity.
…
Second, as was discussed above, the Credit Rating Agency Reform Act of 2006 was signed just a year ago, and the final implementing regulations were promulgated only three months ago. Including the two firms that were newly designated in May 2007, just before the final regulations were promulgated, there are now seven NRSROs. The SEC’s more timely and transparent procedures under the Act should yield at least a few more. The financial markets — and equally important, financial regulators — should be given an opportunity to adjust to the new circumstances of a more competitive ratings market, with more choices, more business models, and more ideas.
More later.