It looks like we have a few more weeks of the entertaining Sprott-Spicer battle to look forward to, as Silver Bullion Trust points out (bolding from original):
Silver Bullion Trust (“SBT”) (symbol: TSX – SBT.UN (C$) SBT.U (US$)) today noted that Sprott Asset Management LP and Sprott Physical Silver Trust (collectively, “Sprott”) have failed by a substantial margin to achieve sufficient support from SBT Unitholders to complete their offer. As a result, Sprott has yet again extended their inadequate, hostile offer to acquire all of the outstanding Units of SBT. They have made no improvement to the terms of their offer, which is now set to expire on October 9, 2015.
Since May 27th, Sprott has harassed SBT Unitholders and their intermediaries with misleading information about Sprott’s offer and defamatory comments about SBT, its Trustees and its administrator. The majority of SBT Unitholders have consistently said “NO” to Sprott’s offer and have clearly expressed the view that they wish to continue to remain SBT Unitholders.
SBT is concerned that some brokers may have misled their Unitholder clients into believing that they must choose one of the two tendering options, and could not “do nothing” in response to Sprott’s offer. SBT Unitholders are reminded that they are NOT REQUIRED to tender their Units to Sprott, regardless of what brokers may say. If instructed by a broker that tendering is required or that Unitholders cannot “do nothing,” please call D.F. King & Co at 1-800-398-2816 for assistance.
…
Unitholders who have refused to tender are urged to retain their SBT Units and not tender to Sprott’s offer. Sprott’s offer cannot succeed unless 662/3% of the Units are actually tendered, which has not been achieved.
During the Credit Crunch there was a notable amount of “jingle-mail” in the States – that being the sobriquet for the act of abandoning your house and sending the keys to the (underwater) mortgage servicer. I advocated – and continue to advocate – for a mortgage system in which the standard is ‘with recourse’ to the homeowner, i.e., that the homeowner is on the hook for the entire amount and that if the house doesn’t cover his balance due, that’s his tough luck.
But the Mayor of Barcelona points out that this can lead to social unrest in a broad market decline:
Under Spanish law, when a bank forecloses on a mortgage and seizes a house or apartment, only part of the debt is wiped out. The rest remains on the books, and the owner isn’t able to declare bankruptcy to escape the debt. The bank has claim to all assets, not just the house.
“The president of the government had explicitly told the population, ‘You have to buy a house because it’s the most secure investment, the best thing for your country,’ ” says Colau. “Millions of people who weren’t trying to speculate, or to be rich, but who thought they were doing the most responsible thing, the safest thing, discovered that they had done the worst thing in their lives, and that there was no way to escape.”
In 2009, Colau and a handful of other activists formed a grassroots organization called the Platform for People Affected by Mortgages—known by its Spanish acronym PAH. “She’s a natural leader,” says Lucía Martín, one of the group’s founders. “It’s not that she says, ‘OK, I’m going to be the leader.’ It’s that everybody looks around and says, ‘Yes. Her. She looks like she can do it.’ It became really obvious.”
One of the first people PAH assisted was Matías González Barquero, who had taken out a mortgage on his home to soundproof his bar at the request of the municipality. González was forced to close the bar in 2009 after a partner died and another fell sick. As a small-business owner, he was ineligible for unemployment, and soon he couldn’t pay his mortgage.
When he attended his first PAH meeting in 2010, his apartment had already been put up for auction, but it had failed to sell, and he hadn’t moved out. When González was scheduled to be evicted by police in March 2010, the group obtained a period of leniency from a judge. Over the next year and a half, PAH blocked two other eviction attempts, mobilizing some 300 people to block the entrance to his apartment. Colau was with González in his house, coordinating the protest from behind locked doors. “She said, ‘You keep calm, we’re going to make it,’ ” recalls González. “When she was facing the banks, she was very tough. But with me, she was a very close person.”
In other geopolitical news (since preferred shares are, you know, kinda boring) it looks like the group that takes decisive action against ISIS will be one with interests that are almost as antithetical to ours:
President Vladimir Putin, determined to strengthen Russia’s only military outpost in the Middle East, is preparing to launch unilateral airstrikes against Islamic State from inside Syria if the U.S. rejects his proposal to join forces, two people familiar with the matter said.
Putin’s preferred course of action, though, is for America and its allies to agree to coordinate their campaign against the terrorist group with Russia, Iran and the Syrian army, which the Obama administration has so far resisted, according to a person close to the Kremlin and an adviser to the Defense Ministry in Moscow.
Russian diplomacy has shifted into overdrive as Putin seeks to avoid the collapse of the embattled regime of Bashar al-Assad, a longtime ally who’s fighting both a 4 1/2 year civil war and Sunni extremists under the banner of Islamic State. Israeli Prime Minister Benjamin Netanyahu flew to Moscow for talks with Putin on Monday, followed by Turkish President Recep Tayyip Erdogan on Tuesday.
Stop dilly-dallying! Smash ISIS now!
There was carnage for the Canadian preferred share market today, with PerpetualDiscounts down 61bp, FixedResets losing 70bp and DeemedRetractibles off 16bp. As one might expect, the Performance Highlights table is both enormous and dominated by losing FixedResets. Volume was very low.
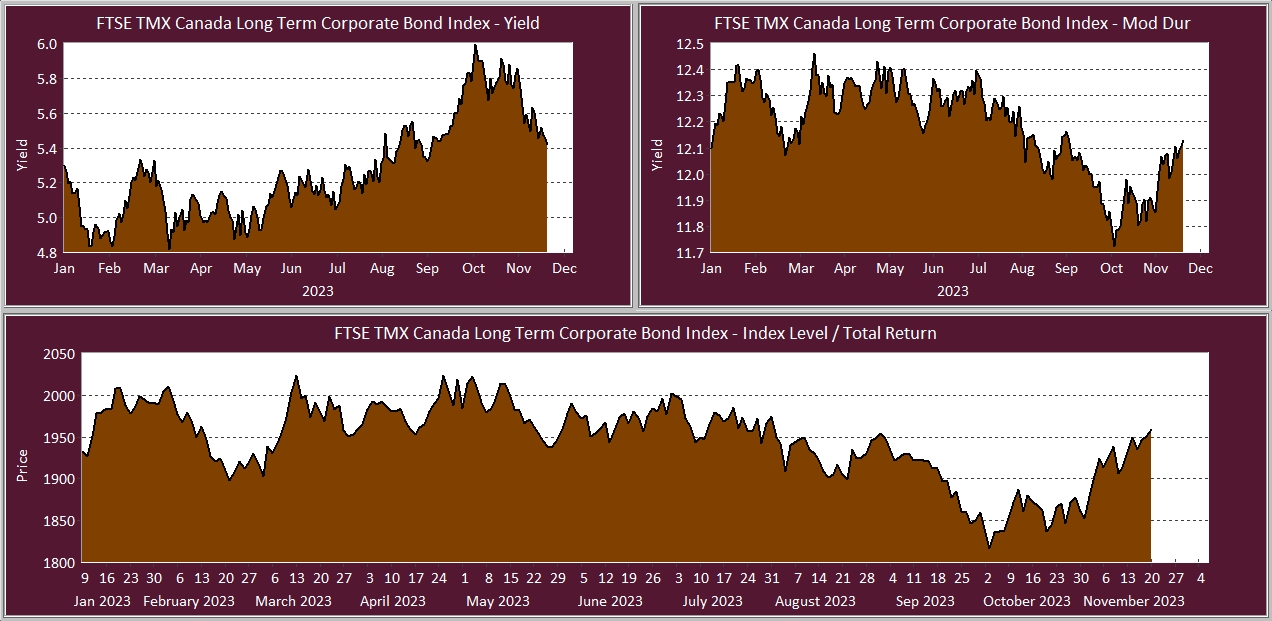
PerpetualDiscounts now yield 5.61%, equivalent to 7.29% interest at the standard equivalency factor of 1.3x. Long corporates now yield a hair under 4.2%, so the pre-tax interest-equivalent spread (in this context, the “Seniority Spread”) is now about 310bp, a significant rise from the 300bp reported September 9.
For as long as the FixedReset market is so violently unsettled, I’ll keep publishing updates of the more interesting and meaningful series of FixedResets’ Implied Volatilities. This doesn’t include Enbridge because although Enbridge has a large number of issues outstanding, all of which are quite liquid, the range of Issue Reset Spreads is too small for decent conclusions. The low is 212bp (ENB.PR.H; second-lowest is ENB.PR.D at 237bp) and the high is a mere 268 for ENB.PF.G.
Remember that all rich /cheap assessments are:
» based on Implied Volatility Theory only
» are relative only to other FixedResets from the same issuer
» assume constant GOC-5 yield
» assume constant Implied Volatility
» assume constant spread
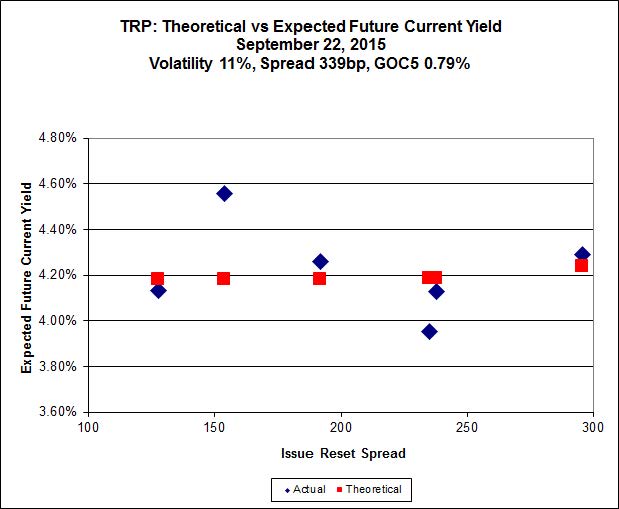
Here’s TRP:

Click for Big
TRP.PR.E, which resets 2019-10-30 at +235, is bid at 19.86 to be $1.21 rich, while TRP.PR.C, resetting 2016-1-30 at +164, is $1.29 cheap at its bid price of 12.60.

Click for Big
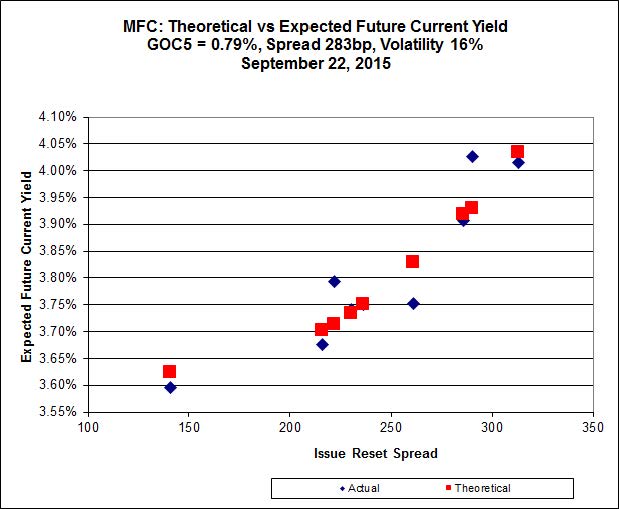
Another good fit today for MFC, with Implied Volatility unchanged today.
Most expensive is MFC.PR.J, resetting at +261bp on 2018-3-19, bid at 22.60 to be 0.52 rich, while MFC.PR.G, resetting at +290bp on 2016-12-19, is bid at 22.80 to be 0.57 cheap.

Click for Big
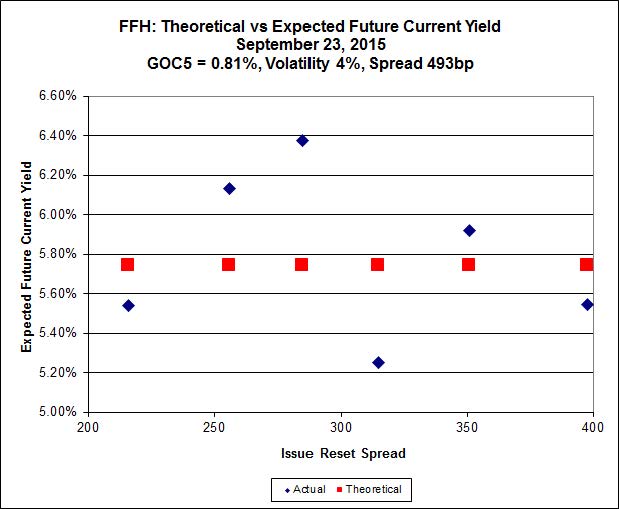
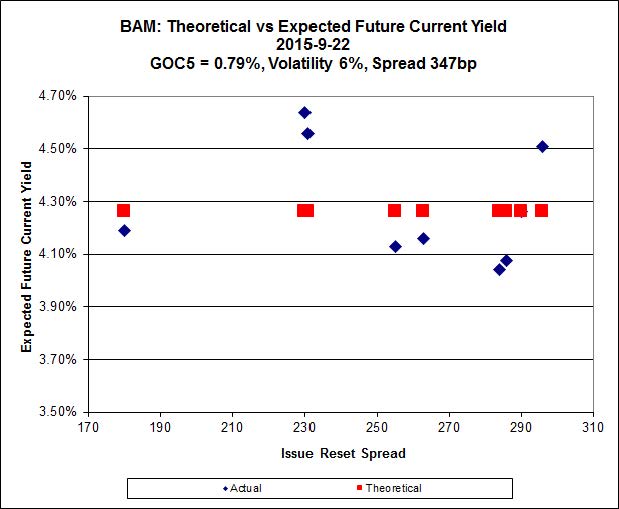
The fit on the BAM issues continues to be horrible.
The cheapest issue relative to its peers is BAM.PR.Z (with a lousy bid, discussed in the Performance Highlights table), resetting at +296bp on 2017-12-31, bid at 19.40 to be $2.26 cheap. BAM.PF.G, resetting at +284bp on 2020-6-30 is bid at 22.40 and appears to be $1.47 rich.

Click for Big
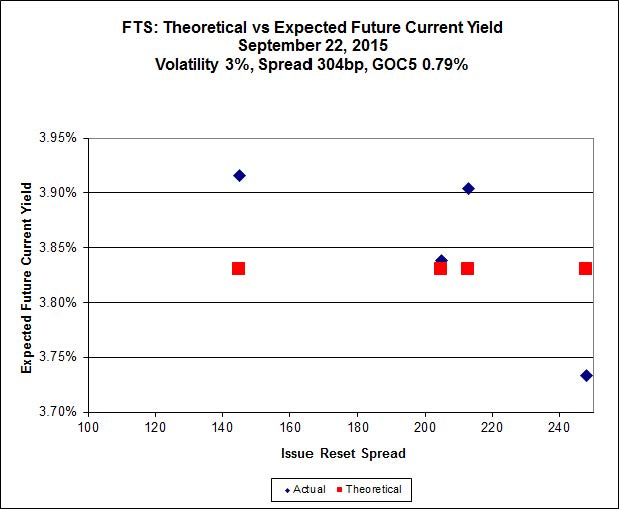
FTS.PR.M, with a spread of +248bp, and bid at 21.70, looks $0.77 expensive and resets 2019-12-1. FTS.PR.G, with a spread of +213bp and resetting 2018-9-1, is bid at 18.30 and is $0.40 cheap.

Click for Big
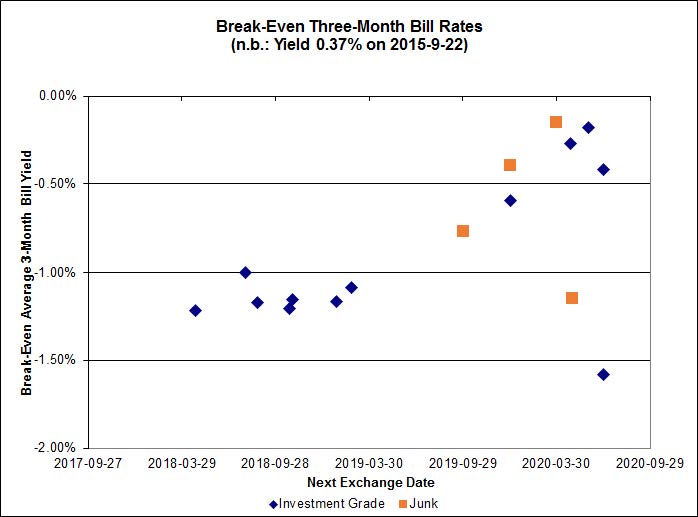
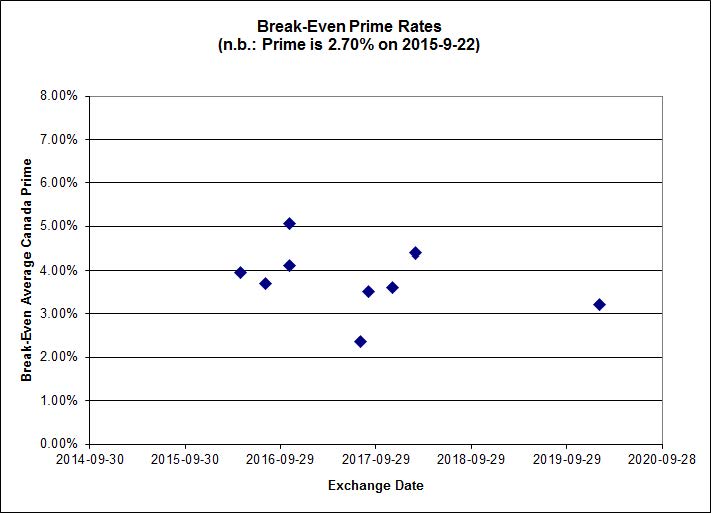
Investment-grade pairs predict an average three-month bill yield over the next five-odd years of -0.87%, with no outliers. The distribution’s bimodality has returned, with bank NVCC non-compliant pairs averaging -1.06% and other issues averaging -0.59%. There are two junk outliers above 0.00%.

Click for Big
Shall we just say that this exhibits a high level of confidence in the continued rapacity of Canadian banks?
| HIMIPref™ Preferred Indices These values reflect the December 2008 revision of the HIMIPref™ Indices Values are provisional and are finalized monthly |
|||||||
| Index | Mean Current Yield (at bid) |
Median YTW |
Median Average Trading Value |
Median Mod Dur (YTW) |
Issues | Day’s Perf. | Index Value |
| Ratchet | 0.00 % | 0.00 % | 0 | 0.00 | 0 | -0.7949 % | 1,635.0 |
| FixedFloater | 0.00 % | 0.00 % | 0 | 0.00 | 0 | -0.7949 % | 2,858.7 |
| Floater | 4.54 % | 4.55 % | 60,472 | 16.34 | 3 | -0.7949 % | 1,738.1 |
| OpRet | 0.00 % | 0.00 % | 0 | 0.00 | 0 | 0.0386 % | 2,770.9 |
| SplitShare | 4.48 % | 4.88 % | 62,106 | 2.08 | 4 | 0.0386 % | 3,247.3 |
| Interest-Bearing | 0.00 % | 0.00 % | 0 | 0.00 | 0 | 0.0386 % | 2,533.7 |
| Perpetual-Premium | 5.73 % | 1.47 % | 57,128 | 0.08 | 8 | -0.1733 % | 2,494.1 |
| Perpetual-Discount | 5.50 % | 5.61 % | 66,431 | 14.46 | 30 | -0.6118 % | 2,577.6 |
| FixedReset | 4.81 % | 4.29 % | 171,798 | 15.69 | 74 | -0.6967 % | 2,115.2 |
| Deemed-Retractible | 5.17 % | 4.75 % | 91,626 | 5.47 | 33 | -0.1643 % | 2,572.0 |
| FloatingReset | 2.52 % | 4.16 % | 55,150 | 5.88 | 9 | -0.0720 % | 2,124.1 |
| Performance Highlights | |||
| Issue | Index | Change | Notes |
| BAM.PR.Z | FixedReset | -6.97 % | Some might call this technically real since the issue traded 7,542 shares in a range of 19.00-20.82, but the trade at 19.00 was for 600 shares and occurred at 3:54pm, the same timestamp as the trade preceding it, 800 shares at 20.25. The VWAP was 20.52, while the closing quote was 19.35-15. I’m willing to listen to stories, but for now I’m going to mark this down as an example of shoddy market-making. YTW SCENARIO Maturity Type : Limit Maturity Maturity Date : 2045-09-23 Maturity Price : 19.35 Evaluated at bid price : 19.35 Bid-YTW : 5.08 % |
| FTS.PR.K | FixedReset | -3.41 % | YTW SCENARIO Maturity Type : Limit Maturity Maturity Date : 2045-09-23 Maturity Price : 17.87 Evaluated at bid price : 17.87 Bid-YTW : 4.33 % |
| FTS.PR.J | Perpetual-Discount | -3.27 % | YTW SCENARIO Maturity Type : Limit Maturity Maturity Date : 2045-09-23 Maturity Price : 21.32 Evaluated at bid price : 21.60 Bid-YTW : 5.54 % |
| TRP.PR.F | FloatingReset | -3.17 % | YTW SCENARIO Maturity Type : Limit Maturity Maturity Date : 2045-09-23 Maturity Price : 13.75 Evaluated at bid price : 13.75 Bid-YTW : 4.16 % |
| BAM.PR.T | FixedReset | -2.88 % | YTW SCENARIO Maturity Type : Limit Maturity Maturity Date : 2045-09-23 Maturity Price : 16.51 Evaluated at bid price : 16.51 Bid-YTW : 4.95 % |
| BAM.PR.R | FixedReset | -2.58 % | YTW SCENARIO Maturity Type : Limit Maturity Maturity Date : 2045-09-23 Maturity Price : 16.23 Evaluated at bid price : 16.23 Bid-YTW : 4.94 % |
| FTS.PR.F | Perpetual-Discount | -2.44 % | YTW SCENARIO Maturity Type : Limit Maturity Maturity Date : 2045-09-23 Maturity Price : 21.70 Evaluated at bid price : 21.95 Bid-YTW : 5.63 % |
| IFC.PR.C | FixedReset | -2.39 % | YTW SCENARIO Maturity Type : Hard Maturity Maturity Date : 2025-01-31 Maturity Price : 25.00 Evaluated at bid price : 19.22 Bid-YTW : 6.98 % |
| PWF.PR.P | FixedReset | -2.37 % | YTW SCENARIO Maturity Type : Limit Maturity Maturity Date : 2045-09-23 Maturity Price : 15.25 Evaluated at bid price : 15.25 Bid-YTW : 4.06 % |
| FTS.PR.G | FixedReset | -2.14 % | YTW SCENARIO Maturity Type : Limit Maturity Maturity Date : 2045-09-23 Maturity Price : 18.30 Evaluated at bid price : 18.30 Bid-YTW : 4.25 % |
| MFC.PR.F | FixedReset | -2.09 % | YTW SCENARIO Maturity Type : Hard Maturity Maturity Date : 2025-01-31 Maturity Price : 25.00 Evaluated at bid price : 14.98 Bid-YTW : 8.79 % |
| CU.PR.F | Perpetual-Discount | -1.94 % | YTW SCENARIO Maturity Type : Limit Maturity Maturity Date : 2045-09-23 Maturity Price : 20.20 Evaluated at bid price : 20.20 Bid-YTW : 5.63 % |
| TD.PF.C | FixedReset | -1.86 % | YTW SCENARIO Maturity Type : Limit Maturity Maturity Date : 2045-09-23 Maturity Price : 20.61 Evaluated at bid price : 20.61 Bid-YTW : 3.95 % |
| BAM.PR.M | Perpetual-Discount | -1.84 % | YTW SCENARIO Maturity Type : Limit Maturity Maturity Date : 2045-09-23 Maturity Price : 20.81 Evaluated at bid price : 20.81 Bid-YTW : 5.74 % |
| NA.PR.W | FixedReset | -1.81 % | YTW SCENARIO Maturity Type : Limit Maturity Maturity Date : 2045-09-23 Maturity Price : 20.62 Evaluated at bid price : 20.62 Bid-YTW : 3.98 % |
| TD.PF.B | FixedReset | -1.70 % | YTW SCENARIO Maturity Type : Limit Maturity Maturity Date : 2045-09-23 Maturity Price : 20.85 Evaluated at bid price : 20.85 Bid-YTW : 3.92 % |
| BAM.PF.C | Perpetual-Discount | -1.63 % | YTW SCENARIO Maturity Type : Limit Maturity Maturity Date : 2045-09-23 Maturity Price : 21.07 Evaluated at bid price : 21.07 Bid-YTW : 5.79 % |
| BNS.PR.Z | FixedReset | -1.52 % | YTW SCENARIO Maturity Type : Hard Maturity Maturity Date : 2022-01-31 Maturity Price : 25.00 Evaluated at bid price : 20.77 Bid-YTW : 5.62 % |
| GWO.PR.I | Deemed-Retractible | -1.51 % | YTW SCENARIO Maturity Type : Hard Maturity Maturity Date : 2025-01-31 Maturity Price : 25.00 Evaluated at bid price : 21.53 Bid-YTW : 6.53 % |
| MFC.PR.C | Deemed-Retractible | -1.46 % | YTW SCENARIO Maturity Type : Hard Maturity Maturity Date : 2025-01-31 Maturity Price : 25.00 Evaluated at bid price : 20.89 Bid-YTW : 6.97 % |
| MFC.PR.I | FixedReset | -1.46 % | YTW SCENARIO Maturity Type : Hard Maturity Maturity Date : 2025-01-31 Maturity Price : 25.00 Evaluated at bid price : 23.01 Bid-YTW : 4.94 % |
| BAM.PR.C | Floater | -1.44 % | YTW SCENARIO Maturity Type : Limit Maturity Maturity Date : 2045-09-23 Maturity Price : 10.30 Evaluated at bid price : 10.30 Bid-YTW : 4.59 % |
| TRP.PR.C | FixedReset | -1.41 % | YTW SCENARIO Maturity Type : Limit Maturity Maturity Date : 2045-09-23 Maturity Price : 12.60 Evaluated at bid price : 12.60 Bid-YTW : 4.81 % |
| PWF.PR.K | Perpetual-Discount | -1.40 % | YTW SCENARIO Maturity Type : Limit Maturity Maturity Date : 2045-09-23 Maturity Price : 22.27 Evaluated at bid price : 22.54 Bid-YTW : 5.57 % |
| POW.PR.D | Perpetual-Discount | -1.31 % | YTW SCENARIO Maturity Type : Limit Maturity Maturity Date : 2045-09-23 Maturity Price : 22.25 Evaluated at bid price : 22.52 Bid-YTW : 5.55 % |
| GWO.PR.R | Deemed-Retractible | -1.31 % | YTW SCENARIO Maturity Type : Hard Maturity Maturity Date : 2025-01-31 Maturity Price : 25.00 Evaluated at bid price : 21.86 Bid-YTW : 6.65 % |
| BMO.PR.S | FixedReset | -1.29 % | YTW SCENARIO Maturity Type : Limit Maturity Maturity Date : 2045-09-23 Maturity Price : 21.35 Evaluated at bid price : 21.35 Bid-YTW : 3.90 % |
| RY.PR.H | FixedReset | -1.27 % | YTW SCENARIO Maturity Type : Limit Maturity Maturity Date : 2045-09-23 Maturity Price : 20.93 Evaluated at bid price : 20.93 Bid-YTW : 3.90 % |
| RY.PR.Z | FixedReset | -1.23 % | YTW SCENARIO Maturity Type : Limit Maturity Maturity Date : 2045-09-23 Maturity Price : 20.84 Evaluated at bid price : 20.84 Bid-YTW : 3.88 % |
| BAM.PF.B | FixedReset | -1.22 % | YTW SCENARIO Maturity Type : Limit Maturity Maturity Date : 2045-09-23 Maturity Price : 20.30 Evaluated at bid price : 20.30 Bid-YTW : 4.44 % |
| BNS.PR.Y | FixedReset | -1.19 % | YTW SCENARIO Maturity Type : Hard Maturity Maturity Date : 2022-01-31 Maturity Price : 25.00 Evaluated at bid price : 20.75 Bid-YTW : 5.04 % |
| SLF.PR.I | FixedReset | -1.19 % | YTW SCENARIO Maturity Type : Hard Maturity Maturity Date : 2025-01-31 Maturity Price : 25.00 Evaluated at bid price : 20.81 Bid-YTW : 6.05 % |
| TD.PF.A | FixedReset | -1.18 % | YTW SCENARIO Maturity Type : Limit Maturity Maturity Date : 2045-09-23 Maturity Price : 20.86 Evaluated at bid price : 20.86 Bid-YTW : 3.92 % |
| CM.PR.P | FixedReset | -1.12 % | YTW SCENARIO Maturity Type : Limit Maturity Maturity Date : 2045-09-23 Maturity Price : 20.37 Evaluated at bid price : 20.37 Bid-YTW : 4.00 % |
| HSE.PR.A | FixedReset | -1.11 % | YTW SCENARIO Maturity Type : Limit Maturity Maturity Date : 2045-09-23 Maturity Price : 13.40 Evaluated at bid price : 13.40 Bid-YTW : 4.89 % |
| BMO.PR.W | FixedReset | -1.11 % | YTW SCENARIO Maturity Type : Limit Maturity Maturity Date : 2045-09-23 Maturity Price : 20.55 Evaluated at bid price : 20.55 Bid-YTW : 3.92 % |
| SLF.PR.H | FixedReset | -1.07 % | YTW SCENARIO Maturity Type : Hard Maturity Maturity Date : 2025-01-31 Maturity Price : 25.00 Evaluated at bid price : 17.51 Bid-YTW : 7.65 % |
| RY.PR.M | FixedReset | -1.06 % | YTW SCENARIO Maturity Type : Limit Maturity Maturity Date : 2045-09-23 Maturity Price : 21.97 Evaluated at bid price : 22.50 Bid-YTW : 3.85 % |
| PWF.PR.T | FixedReset | 1.02 % | YTW SCENARIO Maturity Type : Limit Maturity Maturity Date : 2045-09-23 Maturity Price : 22.31 Evaluated at bid price : 22.85 Bid-YTW : 3.67 % |
| TD.PF.D | FixedReset | 1.29 % | YTW SCENARIO Maturity Type : Limit Maturity Maturity Date : 2045-09-23 Maturity Price : 22.60 Evaluated at bid price : 23.60 Bid-YTW : 3.79 % |
| BAM.PR.X | FixedReset | 1.29 % | YTW SCENARIO Maturity Type : Limit Maturity Maturity Date : 2045-09-23 Maturity Price : 15.65 Evaluated at bid price : 15.65 Bid-YTW : 4.48 % |
| BMO.PR.T | FixedReset | 1.36 % | YTW SCENARIO Maturity Type : Limit Maturity Maturity Date : 2045-09-23 Maturity Price : 20.83 Evaluated at bid price : 20.83 Bid-YTW : 3.90 % |
| SLF.PR.J | FloatingReset | 1.80 % | YTW SCENARIO Maturity Type : Hard Maturity Maturity Date : 2025-01-31 Maturity Price : 25.00 Evaluated at bid price : 12.98 Bid-YTW : 9.73 % |
| Volume Highlights | |||
| Issue | Index | Shares Traded |
Notes |
| TRP.PR.E | FixedReset | 34,835 | Desjardins crossed 11,700 at 19.90. YTW SCENARIO Maturity Type : Limit Maturity Maturity Date : 2045-09-23 Maturity Price : 19.86 Evaluated at bid price : 19.86 Bid-YTW : 4.34 % |
| BAM.PR.B | Floater | 33,881 | YTW SCENARIO Maturity Type : Limit Maturity Maturity Date : 2045-09-23 Maturity Price : 10.50 Evaluated at bid price : 10.50 Bid-YTW : 4.50 % |
| SLF.PR.J | FloatingReset | 29,899 | YTW SCENARIO Maturity Type : Hard Maturity Maturity Date : 2025-01-31 Maturity Price : 25.00 Evaluated at bid price : 12.98 Bid-YTW : 9.73 % |
| TRP.PR.F | FloatingReset | 29,350 | YTW SCENARIO Maturity Type : Limit Maturity Maturity Date : 2045-09-23 Maturity Price : 13.75 Evaluated at bid price : 13.75 Bid-YTW : 4.16 % |
| BAM.PF.A | FixedReset | 21,150 | RBC crossed 17,000 at 21.55. YTW SCENARIO Maturity Type : Limit Maturity Maturity Date : 2045-09-23 Maturity Price : 21.45 Evaluated at bid price : 21.45 Bid-YTW : 4.49 % |
| TRP.PR.A | FixedReset | 20,887 | YTW SCENARIO Maturity Type : Limit Maturity Maturity Date : 2045-09-23 Maturity Price : 15.75 Evaluated at bid price : 15.75 Bid-YTW : 4.56 % |
| There were 16 other index-included issues trading in excess of 10,000 shares. | |||
| Wide Spread Highlights | ||
| Issue | Index | Quote Data and Yield Notes |
| MFC.PR.L | FixedReset | Quote: 20.00 – 22.25 Spot Rate : 2.2500 Average : 1.2387 YTW SCENARIO |
| BAM.PR.Z | FixedReset | Quote: 19.35 – 20.15 Spot Rate : 0.8000 Average : 0.4722 YTW SCENARIO |
| BAM.PR.X | FixedReset | Quote: 15.65 – 16.18 Spot Rate : 0.5300 Average : 0.3553 YTW SCENARIO |
| SLF.PR.H | FixedReset | Quote: 17.51 – 18.00 Spot Rate : 0.4900 Average : 0.3488 YTW SCENARIO |
| BAM.PR.M | Perpetual-Discount | Quote: 20.81 – 21.25 Spot Rate : 0.4400 Average : 0.3199 YTW SCENARIO |
| FTS.PR.G | FixedReset | Quote: 18.30 – 18.70 Spot Rate : 0.4000 Average : 0.2891 YTW SCENARIO |


