I have reiterated to the point of boredom (some might say past it) that exchange trading will give you tight spreads, sure, but thin brittle markets. And yet people keep trying:
The $7.8 trillion U.S. corporate bond market has yet to figure out how to trade large chunks of debt electronically, according to industry executives.
Alerting other investors that you want to buy or sell a certain security is the problem, said Robert Douglass, chief operating officer of U.S. corporate debt trading at Barclays Plc. Once that’s done, your competitors can steal a potentially profitable trade by executing an order ahead of yours.
“There is so much sensitivity about information leakage,” Douglass said Wednesday during a panel discussion at a Sandler O’Neill & Partners LP conference in New York. Being able to show the market a desire to buy or sell a large amount of an illiquid bond without the price immediately moving against you “would be a great market for everyone,” he said.
I mentioned the ding-dong Avon investors on May 14 … profits from their hair-trigger idiocy have been frozen:
The Securities and Exchange Commission today announced an emergency asset freeze of two U.S. brokerage accounts connected to schemes to manipulate Avon and other stocks, thwarting any ability to cash in on ill-gotten proceeds.
According to an SEC complaint filed in federal court in Manhattan, the agency has tracked a filing on its EDGAR system last month about a false Avon tender offer to a foreign entity using an IP address located in Sofia, Bulgaria. A Bulgarian trader named Nedko Nedev controlled at least one of the two now-frozen brokerage accounts, and his account held a substantial position in Avon contracts-for-difference (CFDs) that were losing value in recent months. The SEC alleges that Nedev generated approximately $5,000 in excess profits by selling almost half of the account’s Avon CFDs at inflated prices after the EDGAR filing led to a 20-percent increase in the value of Avon stock on May 14.
The court issued an order at the SEC’s request freezing the two accounts, which contain approximately $2 million in assets.
Can there possibly be a misprint there? “$5,000 in excess profits”? Really?
David Parkinson of the Globe passes on some poor Canadian economic news:
The merchandise trade report released by Statistics Canada on Wednesday was, in a word, grim. The April trade deficit of $2.97-billion was the second-biggest on record – trailing only the March deficit, which was revised to $3.85-billion from the originally reported $3.02-billion. That’s a $6.8-billion trade hole in just two months; for the year to date, the cumulative trade deficit is nearly $11-billion.
…
Yes, exports to the U.S. rose 1.6 per cent in April, but that comes after eight consecutive months of declines. Over the past 12 months, exports to the U.S. are down 4.3 per cent. While April’s upturn in U.S. shipments may provide a glimmer of hope, it appears largely driven by a rebound, from great depths, of the energy sector.Several key non-energy sectors that were supposed to benefit from an accelerating U.S. economy this year have gone AWOL. Exports of metal ores fell 5.8 per cent in April; metal products fell 1.4 per cent. Building and packaging materials dropped 5.8 per cent. Consumer goods slumped 6 per cent. Industrial machinery and equipment flatlined in the month, after slipping 1.2 per cent in March.
…
There’s little question that the elements in trade for an economic recovery remain missing in action. Bank of Canada Governor Stephen Poloz has remained optimistic about a brighter second quarter and a strong second half, but with each new economic release, the doubts creep in. Maybe the cavalry won’t arrive on time; maybe reinforcements, in the form of another interest rate cut, might need to be called in.
And the IMF’s Lagarde has appointed herself a Fed governor, but it remains to be seen whether anybody’s listening:
The Federal Reserve should delay raising interest rates until the first half of 2016, the International Monetary Fund said as it cut its U.S. growth forecast for the second time this year.
The lender also said that the dollar was “moderately overvalued” and a further marked appreciation would be “harmful,” in a statement released in Washington on Thursday on its annual checkup of the U.S. economy.
“We still believe that the underpinnings for continued expansion are in place,” IMF Managing Director Christine Lagarde said at a press briefing in Washington. “The inflation rate is not progressing at a rate that would warrant, without risk, a rate hike in the next few months.”
That means the Fed should wait until early 2016, even if there’s a risk of “slight overinflation” relative to the central bank’s 2 percent target, Lagarde said.
…
The fund’s latest U.S. monetary-policy advice is among its most explicit on record. In 2012, for instance, IMF staff suggested that further easing might be warranted if the outlook worsened, while in the crisis of 2008 they said rates “should stay on hold” until a recovery is established.“The IMF is making a pronouncement on the Fed because the U.S. economy is still so important to the globe,” said Joe LaVorgna, chief U.S. economist at Deutsche Bank Securities Inc. in New York, who expects a September rate increase. “The question is: Will the Fed listen and does it have any bearing on monetary policy decision-making? And my guess is no.”
And there’s more chatter about the global bond rout:
It all started with German government bonds. Yields on 10-year bunds, which move inversely to price, jumped as much as 51 basis points over the week to touch the highest in more than eight months on Thursday as investors reacted to signs of inflation in the eurozone. Mario Draghi, President of the European Central Bank, helped fuel the sell-off by saying investors should “get used” to bond market volatility thanks to very low interest rates that can exacerbate price swings on the debt.
Yields on U.S. 10-year Treasuries followed suit, rising about 30 basis points to the highest since October. With the rout spreading, traders cancelled meetings and rushed back to the office to deal with the swings.
“Traders” in the last sentence was a misnomer. Clearly, from the fact that these guys had meetings as a matter of routine and had to rush back to the office, they are “salesmen”. Salesmen with authority to trade, to be sure, but basically salesmen.
However, Lisa Abramowicz of Bloomberg mocks the idea that this decline can be called a rout:
Yes, German and U.S. bond yields have soared to their highest levels this year. And, yes, more than $626 billion of value has simply evaporated from an index of global sovereign bonds since the end of March.
But all bond owners aren’t racing to the exits just yet. Investors have actually poured almost $1 billion into fixed-income exchange-traded funds over the past week, just one proxy showing sustained demand for debt, according to data compiled by Bloomberg. While trading volumes are somewhat higher than average in Treasuries this year, they’re pretty typical for corporate bonds and not what you’d expect in the case of a wholesale exodus.
“Volume has been significant but not frenetic given the move in yields,” wrote Jim Vogel, an interest-rate strategist at FTN Financial, in a note Thursday. “It is still not clear to most market participants what is driving the intense sale” of European bonds.
…
Without a significant change in the fundamental backdrop of central-bank stimulus and relatively slow growth worldwide, big investors are showing they’re not quite ready to part ways with their bonds. When they are, that’s when the drama will really ensue.
That was a very good article, that was, and introduced me to the paper Investor Flows and Fragility in Corporate Bond Funds.
Brian Milner of the Globe comments:
The Canadian market has so far avoided the worst of the upheaval experienced in Europe and the U.S. But RBC sees longer-term yields climbing another 50 basis points in both Canada and the U.S. by the end of the year.
“We won’t quickly get back to yields of 4 to 5 per cent,” [head of Canadian fixed income and currency strategy at RBC Dominion Securities Inc.] Mr. [Mark] Chandler said. “But to expect us to rewind what we saw in the last six to eight weeks is wrong.”
Central banks have been “complicit” in the selloff, he said, because several took advantage of lower world oil prices and higher headline inflation to cut interest rates.
“For them to have piled on as they did exacerbated the rally that we saw in the first couple of months this year. Now that oil has sort of stabilized and turned the other way, they’re almost living by the sword and dying by the sword.”
Assiduous Readers will remember that Bernanke took some shots at the Wall Street Journal regarding fiscal and monetary policy, as reported April 30. Kevin Carmichael blames fiscal policy for the current woes:
The recovery from the financial crisis has been painfully slow for two reasons. One is private debt, which has weighed on households’ propensity to spend. The other is that governments have contributed almost nothing to gross domestic product since before the crisis.
Remember the 2010 Toronto G20 Summit? Canadian Prime Minister Stephen Harper used his influence as chairman to get the Group of 20 to endorse a pledge to quickly reduce budget deficits and pay debt. In retrospect, it was a bad idea. Mr. Harper and the G20 mistakenly assumed that the passing of the storm meant things would get back to normal. But the sun refused to shine. Private demand remained weak, forcing central banks to get ever more creative. Most governments carried on as if nothing was the matter. They restrained spending, exacerbating the situation.
Back to Canada. The country’s politicians accept no blame for the poor state of the economy. For many, this spring was a moment of triumph, for – in the face of that devastating oil shock – the federal government and some provincial ones were able to keep their budgets in check.
It was a mildly negative day for the Canadian preferred share market, with PerpetualDiscounts down 12bp, FixedResets flat and DeemedRetractibles off 8bp. The Performance Highlights table is quite short, by this year’s standards. Volume was below average.
For as long as the FixedReset market is so violently unsettled, I’ll keep publishing updates of the more interesting and meaningful series of FixedResets’ Implied Volatilities. This doesn’t include Enbridge because although Enbridge has a large number of issues outstanding, all of which are quite liquid, the range of Issue Reset Spreads is too small for decent conclusions. The low is 212bp (ENB.PR.H; second-lowest is ENB.PR.D at 237bp) and the high is a mere 268 for ENB.PF.G.
Remember that all rich /cheap assessments are:
» based on Implied Volatility Theory only
» are relative only to other FixedResets from the same issuer
» assume constant GOC-5 yield
» assume constant Implied Volatility
» assume constant spread
Here’s TRP:

Click for Big
TRP.PR.E, which resets 2019-10-30 at +235, is bid at 23.50 to be $1.23 rich, while TRP.PR.G, which resets 2020-11-30 at +296, is $0.76 cheap at its bid price of 24.56.

Click for Big
Another excellent fit, but the numbers are perplexing. Implied Volatility for MFC continues to be a conundrum. It is still too high if we consider that NVCC rules will never apply to these issues; it is still too low if we consider them to be NVCC non-compliant issues (and therefore with Deemed Maturities in the call schedule). It is clear that the lowest spread issue, MFC.PR.F, is well off the relationship defined by the other issues, but this doesn’t resolve the conundrum – it just makes it more conundrous.
Most expensive is MFC.PR.L, resetting at +216 on 2019-6-19, bid at 23.75 to be $0.88 rich, while MFC.PR.F, resetting at +141bp on 2016-6-19, is bid at 17.90 to be $0.75 cheap.

Click for Big
The cheapest issue relative to its peers is BAM.PR.Z, resetting at +296bp on 2017-12-31, bid at 24.54 to be $0.36 cheap. BAM.PF.G, resetting at +284bp 2020-6-30 is bid at 24.93 and appears to be $0.62 rich.
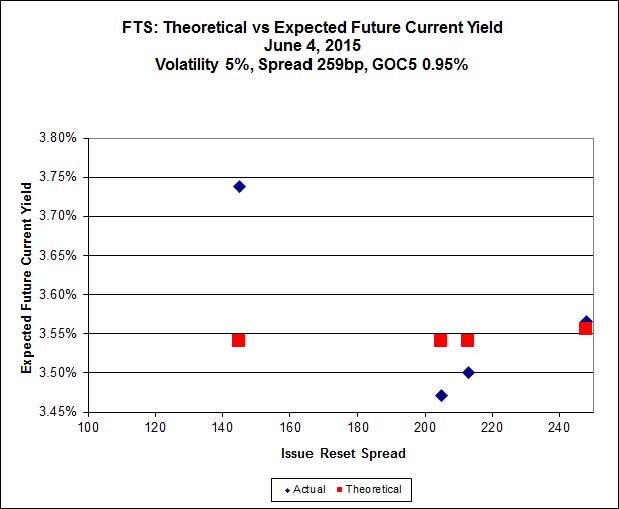
Click for Big
FTS.PR.H, with a spread of +145bp, and bid at 16.05, looks $0.90 cheap and resets 2020-6-1. FTS.PR.K, with a spread of +205bp and resetting 2019-3-1, is bid at 21.61 and is $0.42 rich.

Click for Big
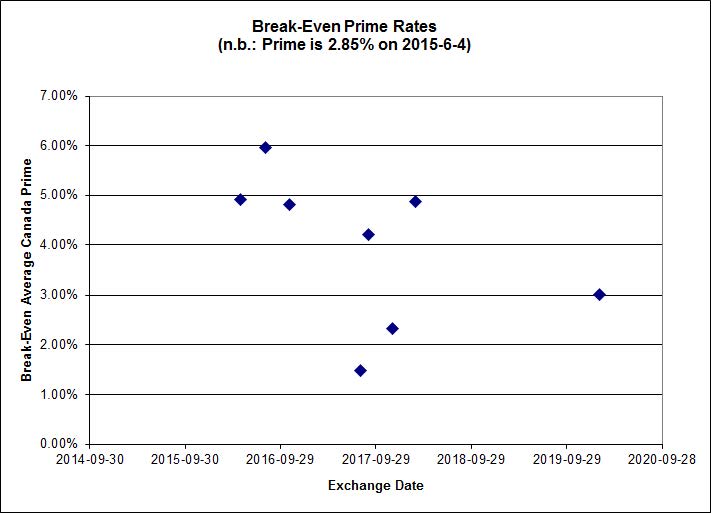
Investment-grade pairs predict an average three-month bill yield over the next five-odd years of about 0.55%, including FTS.PR.H / FTS.PR.I at 1.34%. On the junk side, three pairs are outside the range of the graph: FFH.PR.E / FFH.PR.F at -0.78%; AIM.PR.A / AIM.PR.B at -0.89%; and BRF.PR.A / BRF.PR.B at -1.27%.
Click for Big
Shall we just say that this exhibits a high level of confidence in the continued rapacity of Canadian banks?
| HIMIPref™ Preferred Indices These values reflect the December 2008 revision of the HIMIPref™ Indices Values are provisional and are finalized monthly |
|||||||
| Index | Mean Current Yield (at bid) |
Median YTW |
Median Average Trading Value |
Median Mod Dur (YTW) |
Issues | Day’s Perf. | Index Value |
| Ratchet | 0.00 % | 0.00 % | 0 | 0.00 | 0 | -1.4081 % | 2,154.9 |
| FixedFloater | 0.00 % | 0.00 % | 0 | 0.00 | 0 | -1.4081 % | 3,767.7 |
| Floater | 3.56 % | 3.61 % | 62,517 | 18.20 | 3 | -1.4081 % | 2,290.8 |
| OpRet | 4.44 % | -13.79 % | 26,594 | 0.09 | 2 | 0.0000 % | 2,782.9 |
| SplitShare | 4.59 % | 4.85 % | 72,091 | 3.32 | 3 | -0.5201 % | 3,247.5 |
| Interest-Bearing | 0.00 % | 0.00 % | 0 | 0.00 | 0 | 0.0000 % | 2,544.7 |
| Perpetual-Premium | 5.46 % | 4.72 % | 64,303 | 4.96 | 19 | -0.1159 % | 2,515.6 |
| Perpetual-Discount | 5.07 % | 5.05 % | 115,225 | 15.38 | 14 | -0.1176 % | 2,769.8 |
| FixedReset | 4.46 % | 3.78 % | 256,541 | 16.62 | 86 | 0.0047 % | 2,379.4 |
| Deemed-Retractible | 4.99 % | 3.36 % | 109,308 | 0.71 | 34 | -0.0760 % | 2,632.5 |
| FloatingReset | 2.48 % | 2.86 % | 54,549 | 6.15 | 9 | -0.0686 % | 2,342.3 |
| Performance Highlights | |||
| Issue | Index | Change | Notes |
| TRP.PR.F | FloatingReset | -1.73 % | YTW SCENARIO Maturity Type : Limit Maturity Maturity Date : 2045-06-04 Maturity Price : 18.75 Evaluated at bid price : 18.75 Bid-YTW : 3.32 % |
| BAM.PR.K | Floater | -1.69 % | YTW SCENARIO Maturity Type : Limit Maturity Maturity Date : 2045-06-04 Maturity Price : 13.96 Evaluated at bid price : 13.96 Bid-YTW : 3.61 % |
| BAM.PR.B | Floater | -1.40 % | YTW SCENARIO Maturity Type : Limit Maturity Maturity Date : 2045-06-04 Maturity Price : 14.10 Evaluated at bid price : 14.10 Bid-YTW : 3.58 % |
| PVS.PR.C | SplitShare | -1.23 % | YTW SCENARIO Maturity Type : Hard Maturity Maturity Date : 2017-12-10 Maturity Price : 25.00 Evaluated at bid price : 24.98 Bid-YTW : 4.89 % |
| BMO.PR.T | FixedReset | -1.17 % | YTW SCENARIO Maturity Type : Limit Maturity Maturity Date : 2045-06-04 Maturity Price : 22.63 Evaluated at bid price : 23.57 Bid-YTW : 3.44 % |
| BAM.PR.C | Floater | -1.13 % | YTW SCENARIO Maturity Type : Limit Maturity Maturity Date : 2045-06-04 Maturity Price : 13.95 Evaluated at bid price : 13.95 Bid-YTW : 3.61 % |
| ENB.PR.H | FixedReset | -1.13 % | YTW SCENARIO Maturity Type : Limit Maturity Maturity Date : 2045-06-04 Maturity Price : 17.56 Evaluated at bid price : 17.56 Bid-YTW : 4.58 % |
| BNS.PR.Y | FixedReset | 1.12 % | YTW SCENARIO Maturity Type : Hard Maturity Maturity Date : 2022-01-31 Maturity Price : 25.00 Evaluated at bid price : 23.38 Bid-YTW : 2.95 % |
| ENB.PR.T | FixedReset | 1.20 % | YTW SCENARIO Maturity Type : Limit Maturity Maturity Date : 2045-06-04 Maturity Price : 19.40 Evaluated at bid price : 19.40 Bid-YTW : 4.58 % |
| GWO.PR.N | FixedReset | 2.05 % | YTW SCENARIO Maturity Type : Hard Maturity Maturity Date : 2025-01-31 Maturity Price : 25.00 Evaluated at bid price : 17.45 Bid-YTW : 6.59 % |
| Volume Highlights | |||
| Issue | Index | Shares Traded |
Notes |
| HSE.PR.C | FixedReset | 129,952 | TD crossed blocks of 80,600 and 19,000, both at 25.00. YTW SCENARIO Maturity Type : Limit Maturity Maturity Date : 2045-06-04 Maturity Price : 23.07 Evaluated at bid price : 24.65 Bid-YTW : 4.10 % |
| ENB.PR.F | FixedReset | 67,412 | Scotia bought blocks of 10,000 and 10,400 at 19.00, then another 10,000 at 18.95, all from National. YTW SCENARIO Maturity Type : Limit Maturity Maturity Date : 2045-06-04 Maturity Price : 18.95 Evaluated at bid price : 18.95 Bid-YTW : 4.66 % |
| ENB.PR.Y | FixedReset | 63,177 | TD crossed 40,000 at 18.54. YTW SCENARIO Maturity Type : Limit Maturity Maturity Date : 2045-06-04 Maturity Price : 18.52 Evaluated at bid price : 18.52 Bid-YTW : 4.69 % |
| MFC.PR.B | Deemed-Retractible | 33,665 | RBC crossed 30,000 at 23.23. YTW SCENARIO Maturity Type : Hard Maturity Maturity Date : 2025-01-31 Maturity Price : 25.00 Evaluated at bid price : 23.12 Bid-YTW : 5.68 % |
| BMO.PR.M | FixedReset | 31,600 | Scotia crossed 30,000 at 25.12. YTW SCENARIO Maturity Type : Hard Maturity Maturity Date : 2022-01-31 Maturity Price : 25.00 Evaluated at bid price : 25.12 Bid-YTW : 2.92 % |
| ENB.PF.A | FixedReset | 29,383 | Scotia crossed 20,000 at 20.80. YTW SCENARIO Maturity Type : Limit Maturity Maturity Date : 2045-06-04 Maturity Price : 20.59 Evaluated at bid price : 20.59 Bid-YTW : 4.60 % |
| There were 24 other index-included issues trading in excess of 10,000 shares. | |||
| Wide Spread Highlights | ||
| Issue | Index | Quote Data and Yield Notes |
| RY.PR.K | FloatingReset | Quote: 24.40 – 25.00 Spot Rate : 0.6000 Average : 0.4111 YTW SCENARIO |
| BMO.PR.T | FixedReset | Quote: 23.57 – 23.95 Spot Rate : 0.3800 Average : 0.2530 YTW SCENARIO |
| TRP.PR.G | FixedReset | Quote: 24.56 – 24.90 Spot Rate : 0.3400 Average : 0.2343 YTW SCENARIO |
| CU.PR.F | Perpetual-Discount | Quote: 22.57 – 22.99 Spot Rate : 0.4200 Average : 0.3166 YTW SCENARIO |
| TRP.PR.F | FloatingReset | Quote: 18.75 – 19.12 Spot Rate : 0.3700 Average : 0.2707 YTW SCENARIO |
| RY.PR.H | FixedReset | Quote: 23.85 – 24.19 Spot Rate : 0.3400 Average : 0.2546 YTW SCENARIO |