Category: Interesting External Papers

Interesting External Papers

Bank of Canada Releases Winter '08-'09 Review

The Bank of Canada has announced the release of the Bank of Canada Review of Winter 2008-2009.

Of most interest – to me! – was a paper on the value of information in the FX market, The Role of Dealers in Providing Interday Liquidity in the Canadian-Dollar Market by Chris D’Souza, which concluded:

Overall, results suggest that the relationship between the positions of commercial clients and market-makers, and the role played by dealers in interday liquidity provision, has been understated. There is considerable evidence that not all customer trades are equal. In particular, market-makers are quick to provide liquidity to [Foreign Domiciled] customers, possibly in an attempt to capture any fundamental information contained in these trades. Over time, dealers will off-load their positions to commercial clients as the information becomes stale, or as
the risks associated with holding these undesired balances becomes too costly.

Other papers were:

  • Merchants’ Costs of Accepting Means of Payment: Is Cash the Least Costly?
  • The Market Impact of Forward-Looking Policy Statements: Transparency vs. Predictability
  • Conference Summary: International Experience with the Conduct of Monetary Policy under Inflation Targeting
Interesting External Papers

Dudley Speaks on TIPS

William C Dudley, President and Chief Executive Officer of the Federal Reserve Bank of New York, gave a speech at the Federal Reserve Bank of New York Inflation-Indexed Securities and Inflation Risk Management Conference, New York on 10 February 2009.

He addressed the problems of ex-ante vs. ex-post calculations of the costs of TIPS issuance:

Over the long run – and I mean the very long run – there should be roughly as many downward surprises in inflation performance as upward surprises. But within any relatively short period, such as the last decade, this certainly does not need to be the case. In other words, over such a short period, the outcome of an ex-post analysis can be heavily influenced by which of the two sides – the Treasury or investors – was the lucky recipient of the net inflation surprise that occurred over the period in question. For example, in countries such as the United Kingdom, where inflation declined following the inception of an inflation-linked debt program, ex-post studies generally suggest that these programs have reduced financing costs for these countries.
The fact that the Treasury saved or lost money ex-post is thus not a very reliable guide as to whether the strategic decision to implement a TIPS program has been a good idea. The relevant question is whether the Treasury obtained the financing it needed at a lower ex-ante cost. If the experiment were to be run thousands of times drawing from the underlying distribution of possible inflation outcomes, would Treasury’s costs have been lower, on average, with TIPS or with nominal Treasuries? To conclude on the basis of one coin flip or roll of the dice as ex-post analysis essentially does surely is not the best way to evaluate the respective costs of TIPS issuance versus nominal Treasuries.

… and examined the factors affecting TIPS pricing:

There are two primary factors underlying the relative cost differences:
1) the compensation investors require to hold a security that is less liquid than its nominal counterpart, termed the illiquidity premium, and
2) the insurance value they attach to obtaining protection against inflation risk, known as the inflation risk premium.

[footnote]In addition to these primary factors, TIPS yields also reflect the taxation difference between TIPS and nominal issues, the convexity difference between real and nominal yields and the price of the embedded deflation floor.

… and refers to some Fed analysis:

To determine the impact of the illiquidity premium and inflation risk premium on these results, we decomposed our ex-ante analysis, comparing the breakeven rate of inflation excluding the illiquidity premium in TIPS yields to the SPF forecast. This comparison yields an estimate of the premium investors were willing to pay for inflation protection at previous TIPS auctions. We found an average risk premium estimate of 47 basis points over our sample period. This suggests that the TIPS program does satisfy a real demand that is not met by nominal Treasuries.

It also suggests that if the Treasury were to take steps to shrink the illiquidity premium by, for example, improving secondary market trading in TIPS, this would shift the cost-benefit analysis more firmly in TIPS direction.

[Footnote] We used the illiquidity premium in TIPS yields estimated in D’Amico, Kim and Wei (2008). D’Amico, Kim and Wei calculated the liquidity component for five- and ten-year TIPS yields, which we used to adjust the auction prices for 5- and 10-year TIPS issues. For twenty- and thirty-year TIPS issues, we assumed that the liquidity component is equal to the component for a ten-year security, which in the event that these securities are less liquid than the ten-year note, understates this effect and thus underestimates the risk premium at this horizon. For further information, see Dudley, Roush and Steinberg Ezer (2008).

… and refers to some external studies of extremely hard to quantify benefits:

A few studies have found that an increase in supply in a particular segment of the Treasury yield curve has contributed to a rise in yields. As a result, by issuing securities in a segmented TIPS market, the Treasury may keep realized yields on bill and nominal coupon securities lower than they otherwise would have been.

and, importantly, hints at a process involving larger issues of longer dated TIPS:

I would be willing to make two modest suggestions here. First, it may make sense to emphasize longer-dated TIPS issuance rather than shorter-dated issuance. Analytically, the logic goes as follows. Inflation uncertainty is likely to increase at longer time horizons. Thus, investors are likely to pay a greater premium for inflation protection at longer-time horizons. This implies that the cost savings associated with TIPS are likely to be greater for longer maturities rather than shorter maturities.

This prediction is supported by empirical studies that have examined the premium that investors pay for inflation protection both in the United States and elsewhere. For example, a study by Brian Sack of Macroeconomic Advisors finds that forward breakeven inflation rates increase as maturity lengthens. In contrast, the level of survey-based measures of inflation expectations is quite constant beyond a time horizon of a few years. This means that the difference between forward breakeven inflation and inflation expectations climbs as the time horizon extends. This strongly suggests that the premium investors pay for inflation protection increases as maturities lengthen.

Second, it may make sense to structure the TIPS program in a way that would help reduce the illiquidity premium associated with TIPS relative to on-the-run nominal Treasuries. Some of the current illiquidity premium is likely to shrink as financial markets stabilize. However, further improvements may require a change in either the structure of the TIPS program or the secondary market trading environment.

The notion that issuance of 5-Year TIPS might be halted has been discussed on PrefBlog, as has a BoE Working Paper on the term-structure of inflation indexed bonds.

Banking Crisis 2008

Calomiris on Regulatory Reform

Charles W. Calomiris of Columbia University has been mentioned on PrefBlog before, most recently on September 23. He has just posted a piece on VoxEU, Financial Innovation, Regulation and Reform that is thoughtful enough to deserve a thorough review.

He suggests that the current crisis is due to

  • the Fed’s easy monetary policy in 2002-05
  • official encouragement for sub-prime lending
  • restrictions on bank ownership and
  • ineffective prudential regulation

To fix this, he suggests a six-point plan.

The first point addresses the measurement of risk. He states:

If subprime risk had been correctly identified in 2005, the run-up in subprime lending in 2006 and 2007 could have been avoided.

The essence of the solution to this problem is to bring objective information from the market into the regulatory process, and to bring outside (market) sources of discipline in debt markets to bear in penalising bank risk-taking. These approaches have been tried with success outside the US, and they have often worked.

With respect to bringing market information to bear in measuring risk, one approach to measuring the risk of a loan is to use the interest rate paid on a loan as an index of its risk. Higher-risk loans tend to pay higher interest. Argentine bank capital standards introduced this approach successfully in the 1990s by setting capital requirements on loans using loan interest rates (Calomiris and Powell 2001). If that had been done with high-interest subprime loans, the capital requirements on those loans would have been much higher. Another complementary measure would be to use observed yields on uninsured debts of banks, or their credit default swaps, to inform supervisors about the overall risk of an institution.

Laudable objectives, but these are unworkable in practice.

Firstly, it is a lot easier to look back at sub-prime and say how nutty it was than it is to identify a bubble when you’re in the middle of it. See Making Sense of Subprime

Secondly, it’s extremely procyclical. Say we have a bank that accepts deposits, but puts its money to work by buying corporate bonds. In good times, spreads will be narrow, they will be making money and capital requirements will be small. In bad times, spreads will widen, losing them money and increasing capital requirements at the same time. This is not a good recipe.

The Argentine approach may address the procyclicity angle, but it is not apparrent in the essay. Dr. Calomiris needs to address this point head-on.

The second point is macro-prudential regulation triggers. Dr. Calomiris suggests that some form of countercyclical regulatory environment is desirable:

Borio and Drehmann (2008) develop a practical approach to identifying ex ante signals of bubbles that could be used by policy makers to vary prudential regulations in a timely way in reaction to the beginning of a bubble. They find that moments of high credit growth that coincide with unusually rapid stock market appreciation or unusually rapid house price appreciation are followed by unusually severe recessions. They show that a signalling model that identifies bubbles in this way (i.e., as moments in which both credit growth is rapid and one or both key asset price indicators is rising rapidly) would have allowed policy makers to prevent some of the worst boom-and-bust cycles in the recent experience of developed countries. They find that the signal-to-noise ratio of their model is high – adjustment of prudential rules in response to a signal indicating the presence of a bubble would miss few bubbles and would only rarely signal a bubble in the absence of one.

I think it’s entirely reasonable to adjust risk-weightings based on the age of the facility. Never mind macro-prudential considerations, I suspect that new relationships are inherently more risk than old, even in the absence of a growing balance sheet.

The third point is a desire for disaster planning by each institution to include pre-approved bail-out plans for “too big to fail” (TBTF) banks. I have problems with this. Lehman, for instance, may now be clearly seen as having been too big to fail in September 2008; but if it had blown up, for whatever reason, in September 2006 it would have been no big deal. This proposal brings with it a false sense of security.

I suggest that the TBTF problem be addressed by a progressive capital charge on size. The problem with bureacracies is that you get ahead by telling your boss whatever he wants to hear. Many of the problems we’re having is that the big boss (and the directors) were so many layers removed from the action that it’s no wonder they suffered a little hubris. If your first $20-billion in assets required $1-billion capital and your second $20-billion required $1.5-billion, I suggest that risk/reward analysis would be simpler. For the extremely limited amount of business that genuinely requires size, the banks could simply form one-off consortia.

The fourth point is a plea for housing finance reform. Dr. Calomiris suggests that the agencies be wound up and replaced with, for instance, conditional grants to first time buyers. My own suggestions, frequently droned, are:

Americans should also be taking a hard look at the ultimate consumer friendliness of their financial expectations. They take as a matter of course mortgages that are:

  • 30 years in term
  • refinancable at little or no charge (usually; this may apply only to GSE mortgages; I don’t know all the rules)
  • non-recourse to borrower (there may be exceptions in some states)
  • guaranteed by institutions that simply could not operate as a private enterprise without considerably more financing
  • Added 2008-3-8: How could I forget? Tax Deductible

The fifth point is relaxing restrictions on bank ownership to make accountability a little more of a practical concept, and I couldn’t agree more. I will also suggest that a progressive charge on size will help in this regard.

The sixth point seeks transparency in derivatives transactions. due to perceived opacity in counterparty risk.

The problem with requiring that all OTC transaction clear through a clearing house is that this may not be practical for the most customised OTC contracts. A better approach would be to attach a regulatory cost to OTC contracts that do not clear through the clearing house to encourage, but not require, clearing-house clearing.

I sort-of agree with this. I will suggest that the major problem with counterparty risk in this episode was that the big name players (AIG and the Monolines) were able to leave their committments uncollateralized. I suggest that uncollateralized derivative exposures should attract a significant capital charge … EL = PD * EAD * LD, right (that’s Basel-geek-speak for Expected Loss = Probability of Default * Exposure at Default * Loss on Default). Incorporate that in the capital charges and there will be little further problem with counterparty exposure.

Interesting External Papers

UK FSA Publishes 2009 Financial Risk Outlook

The Financial Services Authority has released its Financial Risk Outlook 2009 report, a very good review of the current situation, its causes and possible effects.

I will note in passing that it’s hard to learn about these releases! The FSA restricts its eMail notifications to journalists, citing “high demand”. I don’t understand! I spend seven hours per day deleting eMail offering me many interesting pills, and the FSA can’t send me an eMail that I’ve specifically requested? This makes no sense.

One highly interesting and topical subject is the decomposition of corporate bond yields, which have been discussed many times on PrefBlog – for instance, in the post announcing BoE Releases October 2008 Financial Stability Report. According to the Financial Times:

Fears are mounting over possible dividend cuts by life assurers, after a demand from the Financial Services Authority that they hold enough capital to survive fresh market shocks.

Life assurers are being told to test whether they would have a capital buffer after what is in effect a 60 per cent reduction in equity markets from current levels, as well as a significant increase in bond defaults, according to people who are aware of the project.

In the latest tests – regarded as more extreme than the December exercise – the FSA has told companies to test whether they would have a capital buffer in the event of a 1980s-style sharp and deep recession, according to people familiar with the plans.

This includes a 20 per cent reduction in equity markets from current levels, followed by another 39 per cent decline, which would take the FTSE 100 index to around the 2,000 level.

It is also asking companies to test whether they would have a capital buffer after a further significant increase in the returns that investors demand for holding bonds that are more risky than gilts and a significant decline in property prices.

The tests represent yet another change in approach by the FSA, which has alternated between pragmatism and strict solvency demands.

“Its like dealing with the police if they kept changing the crime laws,” added the executive.

Tergiversations by regulators are nothing new … but then, neither are flip-flops by the Financial Times, as noted in a very informative article published by The Actuary:

In October 2008, the Financial Times opined that “life assurers should not be using rising yields on corporate bonds to reduce estimates of their future liabilities. The higher yields… represent a higher risk of default and added potential costs”. However, a later article suggested that “the markets are utterly divorced from fundamental value or risks of defaults”.

The Actuary article provides a review of the Liquidity Premium from an investment standpoint:

The spread on corporate bonds over the liquid risk-free rate (for example, government bonds) represents compensation for several different factors:

A Expected default losses
B Unexpected default risk, such as default and recovery rate risk
C Mark-to-market risk, such as the risk of a fall in the market price of the bond
D Liquidity risk, such as the risk of not finding a ready buyer at the theoretical market price.

Investors concerned with the realisable value of their investment in the short-term require compensation for all these risks.

However, investors who can hold bonds to maturity need compensation only for A and B. Such investors can enjoy the premiums for C and D, and we refer to these collectively as a ‘liquidity premium’.

The traditional method for credit deductions only allowed directly for expected default losses, albeit measured on a prudent basis. The Financial Services Authority (FSA), in its September 2008 Insurance Sector Briefing, observed that insurers should allow for both expected losses and the risk of unexpected losses, although they have since deferred any recommendations until 2009.

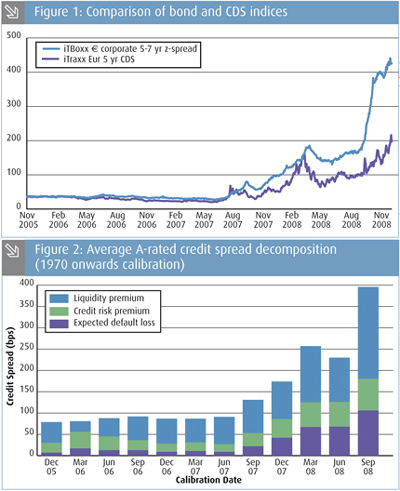
… while pointing out the dangers of blind adherence to classical structural models:

These models are not without their issues. For example, in the Bank of England model, the residual premium on Sterling investment grade bonds fell from 155bps at 30 September 2008 to a negative premium of -9bps on 10 October, before rising to 118bps by the end of October. This is due to the use of equity market volatility to quantify credit default risk — on 10 October equity markets fell 10% with corresponding spikes in volatility, while credit markets were largely unaffected.

Nevertheless, structural models provide a valuable new tool for actuaries to quantify liquidity premiums, and also strong evidence of their existence.

The FSA does not go out of its way to talk tough on this issue, but does note:

As most life insurers hold corporate bonds to back various classes of business, analysis of market developments should be a key consideration for them in determining the discount rate used to value long-term liabilities. In setting this discount rate, most insurers make an assessment of the extent to which bond spreads can be explained by liquidity premiums, rather than the probability of default. Bond spreads have widened significantly, particularly in the third quarter of 2008, and whether insurers attribute this to an increase in the liquidity premium or an increase in credit default risk affects the value of their liabilities. Moreover, asset values will themselves be affected by the increased risk of corporate bond defaults. It is therefore critical that insurers holding corporate bond portfolios properly review underlying credit developments, in order to understand the state of their balance sheets and their capital positions.

Some insurers may have experienced difficulty with the valuation of their assets and, in particular, corporate bonds, because of the considerable reduction in market activity in many asset classes.

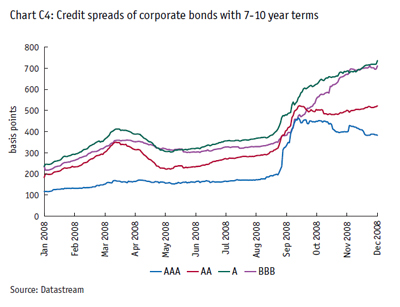
and provides a picture:

The FSA returns to this issue when discussing annuities:

Insurers operating predominantly or exclusively in annuity business are exposed to a concentration of longevity and credit risk. Market conditions have added to the impact of these risks, increasing the risk profile of this part of the sector. The risks arising from widening corporate bond spreads (as outlined above) are a particular issue for annuity business, in which long-term assets such as corporate bonds are used to match long-term liabilities (such as annuities in payment).

and included an exhortation to be prudent when decomposing the spreads in their “key messages to insurers”.

Also of interest was the FSA’s distinction between the much reviled “originate and distribute” model and the more precise “acquire and arbitrage” practice:

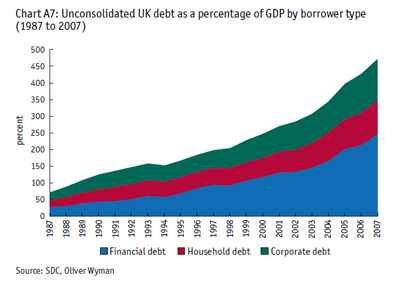
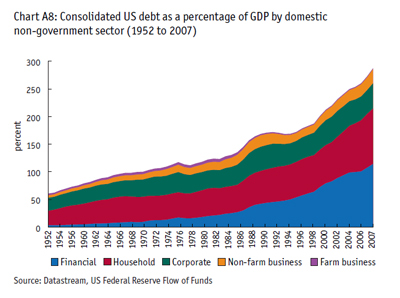
The need to support the growing levels of property and mortgage lending led to the increasing scale and size of securitised markets, and their mounting complexity were accompanied by a significant escalation in the leverage of banks, investment banks and off balance-sheet vehicles, and the growing role of hedge funds. (Chart A5 and A6) Large positions in securitised credit and related derivatives were increasingly held by banks, near banks, and shadow banks, rather than passed through to traditional hold-to-maturity investors.

Hence, the new model of securitised credit intermediation was not solely or indeed primarily one of originate and distribute. Rather, credit intermediation passed through multiple trading books in banks, leading to a proliferation of relationships within the financial sector. This ‘acquire and arbitrage’ model resulted in the majority of incurred losses falling on banks and investment banks involved in risky maturity transformation activities, rather than investors outside the banking system. This explosion of claims within the financial system resulted in financial sector balance sheets becoming of greater consequence to the economy.

Interesting External Papers

IIROC Report on Short Selling Ban

IIROC has released its Study on the Impact of the Prohibition on the Short Sale of Interlisted Financial Sector Issuers. This report, according to the press release:

was undertaken at the request of the Canadian Securities Administrators to examine the impact of the Ontario Securities Commission Order prohibiting short sales of certain financial sector issuers (“Restricted Financials”) on trading activity. The Order, issued on September 19, 2008, prohibited short sales of Restricted Financials listed on the Toronto Stock Exchange that were also inter-listed with exchanges in the United States. The IIROC study shows that, prior to the introduction of the prohibition on short sales, short selling activity in Restricted Financials was generally consistent with historic levels of short selling for inter-listed securities.

A big argument in favour of the short selling ban, as some may remember, was:

prevent regulatory arbitrage with respect to short selling in Ontario of the securities of Restricted Financials as a result of initiatives undertaken in the United States by the Securities and Exchange Commission (“SEC”)

Geez, you know, I’ve always thought that one of the differences between Canada and the US is that in Canada we are not subject to US law; we get to make up our own laws instead. Now, I am more than willing to agree that a little communication, if not cooperation, is always in order; and I will also agree that from time to time we will defer to our gigantic neighbor simply because they control the game; and I will also agree that in the case of interlisted securities a difference in short-selling rules could cause unknown-and-possibly-bad things to happen to market tone … but none of these rationales were addressed. In today’s brave new world it is, apparently, entirely sufficient to mumble something about “regulatory arbitrage” without the need to complicate matters by determining what is good for Canadian markets and good for Canada.

I would have met each US political blather about bonus control and criminalization of CDS trading with a political announcement that such activities in Canada were not just going to be encouraged, but actually subsidized! Let’s steal all their business, that’s what I say! But I digress.

One source of amusement is IIROC’s use of significant figures:

For example, as at August 1, 2008, the market capitalization for the Restricted Financials as a group was $291,409,251,788 ranging from a high of $62,525,252,799 for Royal Bank of Canada to a low of $138,929,587 for Thomas Weisel Partners Group Inc. with three other securities having a market capitalization of less than $400,000,000.

It is rare that I see a report containing twelve significant figures (was that at the ask, the bid, the close, the Volume-Weighted-Average-Price, or what, I wonder) and I thank IIROC for publishing these data.

The summary of findings is consistent with everything else I’ve seen:

In summary, during the Study Period:
• the issuance of the Orders did not appear to have had any appreciable effect on the price of securities of either Restricted Financials or Non-Restricted Financial (both of which have performed better than benchmark index of market performance);
• there were “unusual” levels of activity in “financial sector” securities (both the Restricted and Non-Restricted Financials) in the Pre-Order Week;
• the proportion of short sales of Restricted Financials in the Pre-Order Period was in line with, or less than, historic patterns and the evels of short selling for inter-listed securities generally;
• there was no evidence of undue short selling pressure in the Non-Restricted Financials in the Pre-Order Period (including the Pre-Order Week);
• the issuance of the Orders appeared to have had a significant impact on market quality for the trading of the Restricted Financials by:
o reducing liquidity available in the Restricted Financials, and
o increasing the “spread” for Restricted Financials as measured by the difference between the closing bid and ask prices;

However, the most delicious thing about the report is the selection of the control group – the “Non-Restricted Financials”:

The Original Temporary Order applied to the securities of the Restricted Financials, being thirteen issuers from the financial sector that are listed on the TSX and also listed on an exchange in the United States and subject to the initiatives taken by the SEC. IIROC identified seventy-seven other issuers in the financial sector, of which thirty-three securities (“Non-Restricted Financials”) had more than minimal trading activity during the Pre-Order Period.6 Appendix “A” lists the securities which are considered either a Restricted Financial or a Non-Restricted Financial.

Where possible, the analysis compares the performance of the Restricted Financials and the Non-Restricted Financials with the performance of the S&P/TSX Composite Index. Certain of the measures used in the analysis therefore weight the results for the Restricted Financials and Non-Restricted Financials by their market capitalization. Market capitalization was calculated by multiplying the issued capital of each Restricted Financial as at August 31, 2008 by the relevant price for a particular trading day.

Turning to Appendix A, we find two somewhat startling inclusions in the Non-Restricted Financials: CL.PR.B and HSB.PR.C.

The data is not presented in fine enough detail for the impact of the inclusion of preferred shares in the control group to be estimated; I suspect that the effect was small. But to the extent that there was any effect at all, it should have been regarded as irrelevant.

I sympathize with IIROC with respect to the problems they faced in compiling a control group for the major financial issuers … but they might appreciate some advice from an old quant: If you don’t have the data, don’t do the analysis.

Update, 2013-11-13: Link to report updated.

Interesting External Papers

NYT Piece on Value at Risk

I read this a while ago … was looking for it in my “notes” (as I refer to the Interesting External Papers category of PrefBlog … and couldn’t find it!

Anyway, Joe Nocera of the New York Times wrote an excellent feature article on Value at Risk: Risk Mismanagement.

The major point to be understood is that management of Goldman Sachs used VaR in an intelligent manner:

in December 2006, Goldman’s various indicators, including VaR and other risk models, began suggesting that something was wrong. Not hugely wrong, mind you, but wrong enough to warrant a closer look.

“We look at the P.& L. of our businesses every day,” said Goldman Sachs’ chief financial officer, David Viniar, when I went to see him recently to hear the story for myself. (P.& L. stands for profit and loss.) “We have lots of models here that are important, but none are more important than the P.& L., and we check every day to make sure our P.& L. is consistent with where our risk models say it should be. In December our mortgage business lost money for 10 days in a row. It wasn’t a lot of money, but by the 10th day we thought that we should sit down and talk about it.”

So Goldman called a meeting of about 15 people, including several risk managers and the senior people on the various trading desks. They examined a thick report that included every trading position the firm held. For the next three hours, they pored over everything. They examined their VaR numbers and their other risk models. They talked about how the mortgage-backed securities market “felt.” “Our guys said that it felt like it was going to get worse before it got better,” Viniar recalled. “So we made a decision: let’s get closer to home.”

Various other elements of VaR and its critiques have been referenced in An Early Debate on Value at Risk.

The main problem as I see it is that VaR does not – and cannot – account for trends. If, for instance, you measure your daily VaR based on data from, say, an environment of steadily increasing real-estate prices, that tells you nothing – NOTHING! – about what happens when they decline. Especially if they decline suddenly and interact with factors not in your model, such as “jingle mail”.

And the other problem is – as Taleb appears to have made a career out of saying – fat tails and black swans.

Interesting External Papers

IMF Releases Global Financial Stability Report Update

The International Monetary Fund has released its January 28 Update to the October Global Financial Stability Report:

Financial markets worldwide reflect ongoing deleveraging pressures amidst a deepening economic downturn. In spite of extensive policies, the global financial system remains under intense stress. Moreover, worsening economic conditions are producing new, large writedowns for financial institutions. In response, balance sheets are being cut back through asset sales and the retiring of maturing credits. These actions have increased downward pressure on asset prices and reduced credit availability. Restoring financial sector functionality and confidence are necessary elements of economic recovery. However, more aggressive actions by both policymakers and market participants are needed to ensure that the necessary deleveraging process is less disorderly. A broad three-pronged approach—including liquidity provision, capital injections, and disposal of problem assets—should be implemented fully and quickly so as to encourage balance sheet cleansing. At the same time, international cooperation will be required to ensure the policy coherence and consistency needed to re-establish financial stability.

They suggest:

International cooperation on a common framework for financial policies should receive high priority. The application of substantially different conditions when supporting financial institutions should be avoided in order to prevent unintended consequences that may arise from competitive distortions and regulatory arbitrage. International coordination is also needed to avoid excessive “national bias,” whereby domestic institutions are favored or local credit provision is encouraged, to the detriment of other countries. A more consistent insolvency framework for financial institutions would also help.

Interesting External Papers

An Early Debate on Value at Risk

I found the The Jorion-Taleb Debate from 1997 to be most interesting – particularly Taleb’s comment:

Banks have the ingrained habit of plunging headlong into mistakes together where blame-minimizing managers appear to feel comfortable making blunders so long as their competitors are making the same ones. The state of the Japanese and French banking systems, the stories of lending to Latin America, the chronic real estate booms and busts, and the S&L debacle provide us with an interesting cycle of communal irrationality. I believe that the VAR is the alibi bankers will give shareholders (and the bailing-out taxpayer) to show documented due diligence, and will express that their blow-up came from truly unforeseeable circumstances and events with low probability-not from taking large risks they did not understand. But my sense of social responsibility will force me to point my finger menacingly. I maintain that the due-diligence VAR tool encourages untrained people to take misdirected risk with shareholders’, and ultimately the taxpayers’, money.

There’s also a debate between David Einhorn & Aaron Brown from the summer of 2008 that is of great interest.

And straight line from CAPM through VaR to Basel II is drawn by Kaplanski, Guy and Levy, Haim,Value-at-Risk Capital Requirement Regulation and Asset Allocation: A Mean-Variance Analysis(August 2007). Available at SSRN: http://ssrn.com/abstract=1081288

Interesting External Papers

Correlation of Stock and Bond Returns

I have had occasion to review asset class correlation – among the things I have read was: Li, Lingfeng, Macroeconomic Factors and the Correlation of Stock and Bond Returns(November 2002). Yale ICF Working Paper No. 02-46; AFA 2004 San Diego Meetings. Available at SSRN: http://ssrn.com/abstract=363641:

This paper examines the correlation between stock and bond returns. It first documents that the major trends in stock-bond correlation for G7 countries follow a similar reverting pattern in the past forty years. Next, an asset pricing model is employed to show that the correlation of stock and bond returns can be explained by their common exposure to macroeconomic factors. The link between the stock-bond correlation and macroeconomic factors is examined using three successively more realistic formulations of asset return dynamics. Empirical results indicate that the major trends in stock-bond correlation are determined primarily by uncertainty about expected inflation. Unexpected inflation and the real interest rate are significant to a lesser degree. Forecasting this stock-bond correlation using macroeconomic factors also helps improve investors’ asset allocation decisions. One implication of this link between trends in stock-bond correlation and inflation risk is the Murphy’s Law of Diversification: diversification opportunities are least available when they are most needed.

In light of the widely held view that Benjamin Graham is so famous his pronouncements should not be questioned, it is amusing to read the first footnote:

In the first version of The Intelligent Investor, published in the 1950s, the author, then investment guru Benjamin Graham, claims that the correlation between stock and bond returns is negative. His argument provides the basis for the asset allocation advice of 50-50 split in stocks and bonds. However, in the second version of this book published in the 1970s, the correlation structure has changed and the argument is dropped. Today, one can randomly search the term “stock and bond correlation” on the internet, and easily find sharply contradictory opinions among market participants. When it comes to story-telling, one man’s story is just as good as others. Most of these opinions are based on causal observations and lack the support of concrete evidence.

Figure 1: U.S. Rolling Stock-Bond Correlations, 1961-2001 This figure shows U.S. rolling stock-bond correlations using 60-month rolling window. The thick line is the rolling correlation excluding October 1987. The two dashed lines are the 90% upper and lower error bands. The thin line includes October 1987. Stock returns are calculated using the broad market total return indices. Bond returns are calculated using the long-term government bond total return indices. All returns are monthly, from January 1958 to December 2001.

Our analysis sheds light on the reverting trend observed in G7 stock-bond correlations. The 1970s saw an oil crisis and a subsequent economic stagflation in major industrial countries, which caused high and persistent inflation expectations for over a decade. Investors’ concern for inflation strongly affected the valuation of financial assets during this period and resulted in high comovement between stock and bond returns. The sharp decline in stock-bond correlations in the 1990s can be partially attributed to the lower inflation risk during this period.

Stocks and bonds are two major asset classes for ordinary investors. A lower stock-bond correlation indicates better diversification opportunities. The fact that stock-bond correlation is positively related to inflation risk is a disturbing message for investors. During the periods when inflation risk is high, asset returns tend to be more volatile. This gives investors a stronger incentive to diversify the investment risk. Unfortunately, these are also the periods when stock-bond correlations are high and diversification opportunities are meager. This observation leads to the Murphy’s Law of Diversification: diversification opportunities are least available when they are most needed.

Interesting External Papers

BoC Releases Monetary Policy Report Update

The Bank of Canada has announced that it has released the January 2009 Update to the Monetary Policy Report:

The anticipated normalization of financial conditions, together with the stimulus coming from monetary and fiscal policies, should boost the growth of consumer spending in 2010. Exports are also expected to recover next year as the U.S. economy strengthens and the past depreciation of the Canadian dollar stimulates foreign demand. Excess supply will be gradually reduced, with the economy projected to return to balance by mid-2011. The projected return to balance of the Canadian economy is faster than either of the recoveries following the 1981–82 and 1990–92 recessions (Chart 7). In contrast to these earlier episodes, with an explicit 2 per cent inflation target since 1991 and expectations of inflation well anchored to this target, monetary policy has been able to react in a timely and significant way to help offset the economic downturn and promote conditions to support recovery. In addition, Canada enters this recession with greater fiscal flexibility and stronger corporate balance sheets than in the recession of the 1990s.

It would appear – so far! – that our current recession is unremarkable in terms of either severity or interval since the last one of note. Which, I trust, will explain my anger at the length of time it will take for Spend-Every-Penny’s good-times budgets to cover the projected cost of this rough period.

If we’re lucky, next week’s budget will include a credible projection of how much this recession will cost – including stimulus measures – together with a credible plan of tax increases – effective now – that will pay for it in the ten to fifteen years following recovery. My bet? We won’t be lucky.