Category: Interesting External Papers

Interesting External Papers

IIAC Releases 3Q08 Equity Financing Report

The IIAC has announced:

Total equity issuance in Canada fell to $6.5 billion in the third quarter, the lowest in over 6 years— down 44 per cent from the previous quarter and 24 per cent year-over-year. However, equity trade volumes reached an all-time high surpassing the record reached earlier this year with $25.7 billion shares being traded for the quarter. The Investment Industry Association of Canada (IIAC) issued today its quarterly publication Review of Equity New Issues & Trading, highlighting Canadian equity financing and trading activity.

The report itself notes:

Preferred shares followed suit falling to $1.5 billion on 5 offerings— a decrease of 36% from the previous quarter but still on pace for a record year in issuance for 2008 (Chart 4)

Year-to-Date figures are:

PFD Issuance
YTD
per IIAC
Year Deals Value
2008 25 $5.3-billion
2007 40 $5.2-billion
2006 31 $4.4-billion
Banking Crisis 2008

IMF: World Economic Outlook, October 2008

This would have been a better post yesterday, but I’ve never claimed to be much good at market timing!

The IMF has published its World Economic Outlook, October 2008, Financial Stress, Downturns, and Recoveries. There’s some very interesting data in Chapter Four, discussing “The Current Financial Crisis in Historical Context”.

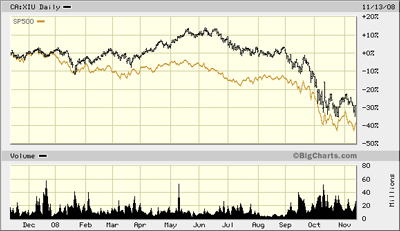
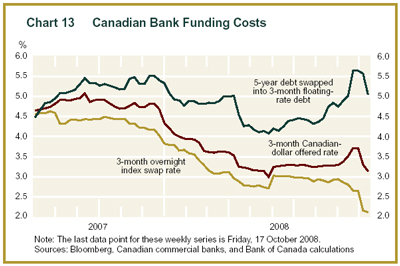
The global nature of the crisis as illustrated by this report has been discussed on FT-Alphaville on November 3, so I won’t repeat that stuff. Instead, I’ll show a chart of XIU vs. the S&P 500 for the past year:

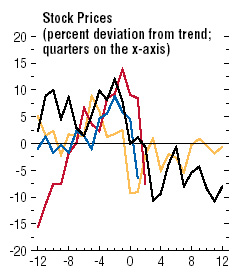
… and the IMF chart of equity returns …

… and a table from Stock Market Bubbles: Some Historical Perspective, by Achla Marathe and Edward Renshaw:

Declines of Three Percent or More in the S&P 500 Stock Price Index After it
Has Achieved a New All Time High Since September 7, 1929


                                          % Change S&P
      Date of         Value S&P Index   -----------------------------------------       Trading
-------------------   ---------------    Peak to   Peak to                            Day
   Peak      Trough    Peak    Trough    Peak      Trough      Duration
                        (1)      (2)      (3)        (4)       (5)n

 9/ 7/29    6/ 1/32   31.92     4.40**    ---      -86.2

10/ 6/54   10/29/54   32.76    31.68      2.6      - 3.3        10
 1/ 3/55    1/17/55   36.75    34.58     12.2$     - 5.9#       40H
 3/ 4/55    3/14/55   37.52    34.96      2.1$     - 6.8        19
 4/21/55    5/17/55   38.32*   36.97      2.1      - 3.5         7
 7/27/55    8/10/55   43.76    41.74     14.2      - 4.6#       37
 9/23/55   10/11/55   45.63    40.80      4.3      -10.6        13
11/14/55    1/23/56   46.41    43.11      1.7$     - 7.1         0
 3/20/56    5/28/56   48.87    44.10      5.3$     - 9.8         7
 8/ 2/56   10/22/57   49.74    38.98**    1.8      -21.6        13

11/17/58   11/25/58   53.24    51.02      7.0      - 4.2#       37
 1/21/59    2/ 9/59   56.04    53.58      5.3$     - 4.4#       27
 5/29/59    6/10/59   58.68    56.36      4.7      - 4.0#       61H
 8/ 3/59   10/25/60   60.71*   52.30**    3.5      -13.9        22

 4/17/61    4/24/61   66.68    64.40      9.8      - 3.4#       54H
 5/17/61    7/18/61   67.39E   64.41D     1.1      - 4.4         2
 9/ 6/61    9/25/61   68.46E   65.77D     1.6      - 3.9        22
12/12/61    6/26/62   72.64E*  52.32D**   6.1      -28.0        35

10/28/63   11/22/63   74.48    69.61      2.5      - 6.5        39
 5/12/64    6/ 8/64   81.16    78.64      9.0      - 3.1#      101H
 7/17/64    8/26/64   84.01    81.32      3.5      - 3.2#       15
11/20/64   12/15/64   86.28*   83.22      2.7      - 3.5        17
 5/13/65    6/28/65   90.27    81.60      4.6      - 9.6        81
 2/ 9/66   10/ 7/66   94.06    73.20**    4.2      -22.2        94

 5/ 8/67    6/ 5/67   94.58    88.43       .6      - 6.5         2
 8/ 4/67    8/28/67   95.83    92.64      1.3      - 3.3         4
 9/25/67    3/ 5/68   97.59    87.72      1.8$     -10.1         8
 7/11/68    8/ 2/68  102.39*   96.63      4.9      - 5.6        44H
11/29/68    5/26/70  108.37    69.29**    5.8      -36.1        38

 4/12/72    5/ 9/72  110.18   104.74D     1.7      - 4.9        24
 5/26/72    7/20/72  110.66   105.81D      .4      - 4.4         2
 8/14/72   10/16/72  112.55   106.77D     1.7      - 5.1         4
12/11/72   12/21/72  119.12*  115.11D     5.8      - 3.4#       26H
 1/11/73P  10/ 3/74  120.24    62.28D**    .9      -48.2         6
 8/22/80P   8/28/80  126.02   122.08      4.8$     - 3.1#       26H
 9/22/80P   9/29/80  130.40   123.54      3.5$     - 5.3        13
10/15/80P  10/30/80  133.70   126.29      2.5$     - 5.5         7
11/28/80P   8/12/82  140.52*  102.42**    5.1$     -27.1        11

11/ 9/82   11/23/82  143.02   132.93      1.8$     - 7.1         4
 1/10/83    1/24/83  146.78   139.97      2.6$     - 4.6         2
 6/22/83    8/ 8/83  170.99   159.18     16.5      - 6.9#       94H
10/10/83    7/24/84  172.65*  147.82**    1.0$     -14.4         0

 2/13/85    3/15/85  183.35   176.53      6.2$     - 3.7#       17
 6/ 6/85    6/13/85  191.06   185.33      4.2      - 3.0#       29
 7/17/85    9/25/85  195.65   180.66      2.4      - 7.7        13
 1/ 7/86    1/22/86  213.80*  203.49      9.3$     - 4.8#       37
 3/27/86    4/ 7/86  238.97   228.63     11.8      - 4.3#       37
 4/21/86    5/16/86  244.74   232.76      2.4$     - 4.9         3
 5/29/86    6/10/86  247.98   239.58      1.3$     - 3.4         2
 7/ 2/86    7/15/86  252.70   233.66      1.9      - 7.5         5
 9/ 4/86    9/29/86  253.83   229.91       .4$     - 9.4         6
12/ 2/86   12/31/86  254.00   242.17       .1$     - 4.7         0
 3/24/87    3/30/87  301.64   289.20     18.8      - 4.1#       53H
 4/ 6/87    5/20/87  301.95   278.21D      .1      - 7.9         0
 8/25/87   12/ 4/87  336.77   223.92**   11.5      -33.5        50

 9/ 1/89    9/14/89  353.73   343.16      5.0$     - 3.0#       27H
10/ 9/89    1/30/90  359.80   322.98      1.7$     -10.2         4
 6/ 4/90P   6/26/90  367.40   352.06      2.1$     - 4.2         4
 7/16/90P  10/11/90  368.95*  295.46**     .4      -19.9         0

 4/17/91    5/15/91  390.45   368.57      5.8      - 5.6#       43
 8/ 6/91    8/19/91  390.62   376.47       .0$     - 3.6         0
 8/28/91   10/ 9/91  396.64   376.80      1.5      - 5.0         4
11/13/91   11/29/91  397.41E* 375.22       .2      - 5.6         1
 1/15/92    4/ 8/92  420.77E  394.50      5.9      - 6.2        14
 8/ 3/92    8/24/92  425.09E  410.72      1.0$     - 3.4         3
 9/14/92   10/ 9/92  425.27E  402.66D      .0$     - 5.3         0
 2/ 4/93    2/18/93  449.56E  431.90      5.7      - 3.9#       51
 3/10/93    4/26/93  456.33E  433.54D     1.5$     - 5.0         2
 2/ 2/94    4/ 4/94  482.00E  438.92D     5.6      - 8.9       116
12/13/95    1/10/96  621.69   598.48D    29.0      - 3.7#      210H
 2/12/96    4/11/96  661.45   631.18D     6.4      - 4.6#       10
 5/24/96    7/24/96  678.51   626.65D     2.6$     - 7.6         9
11/18/96   12/16/96  757.03   720.98D    15.1G$    - 4.8#       51
 2/18/97             816.29         D     7.8G         ?        26

Footnotes for Table 20.1

(5)n. Number of additional trading days after the recovery to a first new
high to the last new high or peak date.

* Fourth new high to be followed by a three percent decline for the bull
market in question.

**A major bear market low.

$ identifies cases where the first new high was associated with a daily gain
of 1.1 percent or more.

#Cases where the peak to trough decline in column (4) is less than the
preceding peak to peak increase in column (3).

D identifies cases where the first new high occurred after a month when the
dividend yield for the S&P index was equal to 3.0 percent or less.

E identifies cases where the first new high occurred after a quarter when
the P/E ratio for the S&P index was equal to 20.50 or more.

G identifies peak to peak gains that may have encouraged Fed Chairman Alan
Greenspan to warn investors about the possibility of irrational exuberance.

H identifies the trading day duration record, without a cumulative decline
of three percent or more, for each bull market separated by cumulative
declines of 13 percent or more.

P identifies declines of three percent or more that occurred during years
containing a recessionary peak designated by the National Bureau of Economic
Research.

Source of basic data: The Practical Forecasters’ Almanac(Burr Ridge,
Illinois: Irwin, 1992), Table 3.05 and Standard and Poor’s Security
Price Index Record
.

Update: See also this source:

S&P 500 Index:

March 24, 2000 closes at 1527.46 (Peak)
July 23, 2002 closes at 797.70 (Trough)
Percentage decline from Peak to Trough: 47.78%

and

from FAC Wealth Management.

Interesting External Papers

BIS Releases OTC Derivative Statistics

The BIS Semi-Annual OTC Derivatives Package has been released … and CAD interest rate options got a mention!

Concentration in options on Canadian dollar interest rates rose to the highest level recorded so far.

The Herfindahl index represents a measure of market concentration and is defined as the sum of the squares of the market shares of each individual institution. It ranges from 0 to 10,000. The more concentrated the market, the higher the measure becomes. If the market is fully concentrated (only one institution), the measure will have the (maximum) value of 10,000.

The Herfindahl Index for CAD Interest Rate options was 3,314.

The press release summarizes:

The notional amounts outstanding of over-the-counter (OTC) derivatives continued to expand in the first half of 2008. Notional amounts of all types of OTC contracts stood at $683.7 trillion at the end of June, 15% higher than six months before. Multilateral terminations of outstanding contracts resulted in the first ever decline of 1% in the volume of outstanding credit default swaps (CDS) since the first publication of CDS statistics in December 2004. The average growth rate for outstanding CDS contracts over the last three years has been 45%. In contrast to CDS markets, markets for interest rate derivatives and FX derivatives both recorded significant growth. Open positions in interest rate derivatives contracts rose by 17%, while those in FX contracts expanded by 12%. Gross market values, which measure the cost of replacing all existing contracts and are thus a better gauge of market risk than notional amounts, increased by 29% to $20.4 trillion at the end of June 2008.

Interesting External Papers

BoE Releases October 2008 Financial Stability Report

The October 2008 edition of the BoE’s Financial Stability Report has been released.

There’s an interesting graph of Sterling credit spreads:

Despite the slowing economy, corporate insolvency rates remain near historical lows. Many companies extended debt maturities during the recent boom, with Dealogic data suggesting that only about 10% of the stock of sterling-denominated bonds and loans outstanding are due to mature in 2009. But within that aggregate picture, there are pockets of vulnerability. Company accounts suggest that the proportion of debt held by businesses whose profits were not large enough to cover their debt interest payments picked up sharply in 2007 to around a quarter of the outstanding stock of debt

Also of interest is the continuing disconnect between fundamental value and market price of AAA subprime paper:

They update their estimation of ultimate credit losses (as opposed to mark-to-market losses) initiated in the April Financial Stability Report and conclude:

As Chart C shows, it is difficult to reconcile the outlook for expected credit losses on UK prime RMBS (Chart B), and hence the likely economic value of those securities, with current implied market values (Chart A). Based on this comparison, it is estimated that a little under half of the loss of market value of UK prime RMBS is likely to reflect discounts for uncertainty about future collateral performance and market illiquidity.(12) And around one third of mark-to-market losses on US sub-prime RMBS can be attributed to the premia demanded by investors for uncertainty and market illiquidity.

They emphasize that uncertainty and excess leverage are working together to greatly increase the calculated probability of default:

The uncertainty about the underlying values of banks’ assets was amplified by the high leverage with which UK and global financial institutions entered the downturn. To give an illustrative example,(1) in the middle of 2008 major UK banks had assets of just over £6 trillion and equity capital of around £200 billion. So if the standard deviation of asset returns pre-crisis was, say 1.5% per year, then levels of UK banks’ capital would have delivered a probability of default of a little over 1% a year (Chart 4.4). But if uncertainty doubled to 3% in the crisis — for example, as a result of higher macroeconomic and counterparty risk — then the implied default probability would rise to a little under 15%. In essence, that was what happened to UK and global banks during the summer, as the combination of asset valuation uncertainty and leverage markedly increased default fears and thus raised questions about the adequacy of banks’ capitalisation. That was the case despite capital ratios being above regulatory minima throughout the period (Chart 4.5).

… which in turn places a greater importance on the mark-to-market value of assets …

When the probability of default is low, the value of assets on banks’ balance sheets is determined by their economic value — the value built up from underlying expected cash flows on those assets on the assumption that they are held to maturity. But as default probabilities rise, so do the chances of the assets needing to be liquidated prior to maturity at market prices. So as the expected probability of bank default rose during September (Chart 3.1 in Section 3), it became rational for market participants to alter the way by which they assessed
the underlying value of banks’ assets, effectively placing more weight on the mark-to-market value of these assets. Given the high illiquidity and uncertainty premia in market prices (discussed in Section 2), this implied lower asset values and higher potential capital needs for banks. This valuation effect served as an additional amplifier of institutional distress.

It appears that the BoE will be pushing for better bank capitalization:

By historical standards, banks have operated with relatively low levels of capital in recent years. For example, long-run evidence shows that capital ratios for US banks have fallen significantly from levels of around 50% in the mid-19th century (Chart 6.1). The structure of banking systems, and the safety nets in place to support them, have changed dramatically over the period. While it is difficult to determine the optimum level of capital, recent events suggest that capital levels across the financial system as a whole have fallen too far.

Existing regulatory tools need to be adapted and new ones developed, to ensure that the financial system is better capitalised in advance of the next downturn and to address the build-up of risk through the cycle. A range of specific proposals have already been put forward. A leverage ratio — a minimum ratio of capital to total assets — would impose a constraint on the growth of banks’ balance sheets relative to their stock of capital. A system of dynamic provisioning would force banks to build up reserves against future losses in good times, providing a resource which could be drawn on in bad times. These and other proposals are outlined in detail in Box 6.

All in all, a very good review of the situation.

Interesting External Papers

BoC Monetary Policy Report, 2008-10-23

The Bank of Canada released its October 2008 Monetary Policy Report on Thursday …

Core inflation is projected to remain below 2 per cent until the end of 2010. Assuming oil prices in a range of US$81 to US$88 per barrel, consistent with recent futures prices, total CPI inflation should peak in the third quarter of 2008, and is projected to fall below 1 per cent in mid-2009 before returning to the 2 per cent target by the end of 2010.

In line with the new outlook, some further monetary stimulus will likely be required to achieve the 2 per cent inflation target over the medium term.

Over the 1978–2004 period, which is long enough for cyclical and irregular effects to wash out, the growth in labour productivity for the total economy averaged 1.2 per cent per year. Recently, this trend appears to have fallen to slightly below 1.0 per cent, owing partly to the considerable amount of structural adjustment under way in the economy and perhaps partly to firms hiring additional labour, given concerns about tightening labour markets (Chart A). As these factors dissipate, aggregate productivity growth should pick up.

As a simple illustration, major Canadian banks have an average asset-to-capital multiple of 18. The comparable figure for U.S. investment banks is over 25, for European banks, in the 30s, and for some major global banks, over 40.

Credit spreads for financial institutions, as measured by the difference between a weighted average of borrowing rates across the term structure and the expected overnight rate, spiked to around 200 basis points in early October. While strong actions taken by governments and central banks to support financial institutions have led to some retracement in these spreads, it is expected that spreads will be reduced only slowly as confidence is gradually rebuilt. Since the onset of the financial market turbulence in August 2007, effective borrowing costs for Canadian financial institutions have eased somewhat, with the rise in credit spreads more than offset by the 225-basis-point cumulative reduction in the target overnight rate (Chart 13). These indicative borrowing costs likely do not, however, adequately take account of the decreased availability coming from illiquid and risk-averse interbank markets.

The huge spread on 5-year money may go a long way to explain why Royal Bank was willing to issue Fixed-Resets at 5.60%+267. Who knows … with a new fiscal year on the way, we may see more issues like that …

Interesting External Papers

ABCP: Always Buy Concentrated Portfolios

IIROC has released a 113 page report on ABCP. For those who have no time to read the entire thing, here’s the official PrefBlog summary: Don’t sell stuff that goes down, OK guys? Only sell stuff that goes up.

The focus of the report is on “suitability”; the words “concentration” and “diversification” each appear exactly once, in the sections describing the paper itself, not the client’s portfolio. Given that the Capital Asset Pricing Model, with its emphasis on risk reduction via diversification, is only about 40 years old, it is hardly surprising that the concept is foreign to the regulators.

Interesting External Papers

What the WEF Report Really Says about Canadian Banks

The World Economic Forum Global Competitiveness Report has been getting a lot of media ink lately.

For instance, Gwyn Morgan writes in the Globe:

Are Canadian banks in trouble? The World Economic Forum just ranked Canada’s banking system as the soundest in the world.

and in the same edition in a column that does not appear to be available online, Murray Leith of Odlum Brown wrote:

Our Canadian banks were even rated the “safest” in the world, according to a survey conducted by the World Economic Forum

It is important to understand exactly what this means. First, the good news:

Canada moves up three places to join the top 10 (ranked 10th). Canada benefits from top-notch transport and telephony infrastructure; highly efficient markets, particularly labour and financial markets (ranked 7th and 10th respectively); and well-functioning and transparent institutions (ranked 15th). In addition, the educational system gets excellent marks for quality, which has prepared the country’s workforce to adopt the latest technologies for productivity enhancements (ranked 9th). Canada’s main weakness remains its macroeconomic stability, where it is ranked 43rd, mainly linked to the significant government debt of nearly 70% of GDP, which places the country 107th out of 134 countries on this indicator. On a more positive note, however, the government has been running small surpluses over recent years, which is allowing the country to put the debt level on a downward trend.

I don’t know how much longer the surpluses will last if old ‘What Debt?’ Harper gets his majority tomorrow, but that’s another issue.

But what does it all mean? The key word was used by Mr. Leith – “survey”. According to Chapter 2.1 of the report:

The World Economic Forum has conducted the annual Survey for nearly 30 years.This year, the Survey was completed by 12,297 top management business leaders—an all-time high—in 134 countries between January and May.This represents an average of 91 respondents per country.Table 1 shows key attributes of the Survey respondents for the 2008 dataset.

The Survey asks the executives to provide their expert opinions on various aspects of the business environment in which they operate.The data gathered thus provide a unique source of insight and a qualitative portrait of each nation’s economic and business environment, and how it compares with the situation in other countries.

The collected respondent-level data are subjected to a careful editing process.The first editing rule consists of excluding those surveys with a completion rate inferior to 50 percent.

OK, so what is this based on? A survey of executives, who are providing opinions described as “expert” on virtually every aspect of their own nation’s competitive position; these are then ranked against other executives expert opinion of virtually every aspect of the other executives’ nations’ competitive position.

Sorry, this doesn’t make sense; the answers are not particularly reliable for any given nation and are not reliable at all when making comparisons. I personally believe that Canadian banks are quite sound, but my opinions – and those of the respondents – are valueless when attempting to draw an objective comparison against Tuvalu’s banks. I stand ready to be corrected, but I cannot find any indication on the WEF Website of any testing that has been done regarding the predictive capability of past surveys.

Sorry, guys. While it makes for pleasant hearing, and may for policy purposes assist governments in setting priorities, the survey is meaningless.

Interesting External Papers

ECBC Releases 2008 Covered Bond Fact Book

The European Covered Bond Council has released its 2008 Fact book:

The Fact Book presents five articles on key issues in Chapter I with a focus on developments in primary and secondary markets during the recent financial turmoil:

  • Assessing the state of play in secondary markets;
  • Analysing the role of Covered Bonds as a funding tool;
  • The investor’s perspective;
  • Investigating general law framework (structured) Covered Bonds; and
  • Looking at pooling models.

The second Chapter explains more about covered bonds and their main features and includes articles comparing Covered Bonds with RMBS as well as how the Capital Requirements Directive relates to Covered Bonds.

In the third Chapter, detailed explanations are presented on the legislation and markets for covered bonds for 29 countries, including seven countries added since the last edition of the Fact Book.

Chapter IV gives the rating agencies the opportunity to present their Covered Bond methodologies as well as providing a brief comparison of their different approaches.

In Chapter V, a description of trends in the covered market as well as a complete set of covered bond statistics are presented.

Can’t say I’ve read it thoroughly – there have been other things to observe today – but the last handbook, mentioned in the PrefBlog Covered Bond Primer was most informative.

Interesting External Papers

CEBS Reports on Banks' Transparency

The Committee of European Banking Supervisors (CEBS) has released a report on Bank Reporting:

In line with a commitment given in the ‘Report on banks’ transparency on activities and products affected by the recent market turmoil’ published on 18 June 2008, CEBS has carried out a follow-up review of banks’ half year disclosures as of 30 June 2008.

The good practices identified in the 18 June report cover disclosures of the impact of the market turmoil on results and on exposures – these areas are in line with the recommendations of the Financial Stability Forum (FSF) – and also information on business models, risk management practices, accounting and valuation practices.

CEBS is of the view that for the 22 large banks – 19 of which originate from the EU – covered by the analysis, the disclosures on the impact of the market turmoil and on exposure levels have improved since the last assessment. In particular improvements have been observed with regard to the levels of details of the information. For these areas, the disclosures are considered to be in line with the good practices identified in the June report .

Differences in disclosures between the banks included in the analysis are considered to be commensurate with the varying levels of their involvement in the activities under consideration.

By contrast, disclosures on business models – and to a lesser extent disclosures on risks and risk management practices – are less detailed and have not improved to the same extent. Some of the institutions analysed have incorporated the CEBS’s good practices for these areas but the majority of institutions included in the sample still have to make efforts to bring their disclosures up to that standard.

Interesting External Papers

IIAC Releases 2Q08 Debt Report

The Investment Industry Association of Canada has released An Issue of Debt 2Q08 – statistics on issuance and trading in Canadian debt markets.

Of interest is the issuance of Maple bonds (issued by foreign companies in Canadian currency):

Corporate issuance remained lofty in Q2, despite widening credit spreads experienced early in the quarter. Financings totaled $24 billion with over 60% of issuance deriving from the financial sector— an increase of 33% from Q1 but still off the pace with last year’s figures (Chart 1). The pull back has largely been attributed to the lack of Maple bond offerings thus far in 2008. For the first half of 2008, Maple bond issuance has totaled just $500 million as compared to over $23 billion during the same period in 2007 (Chart 2).