The fund experienced disappointing returns in June, as the market didn’t just collapse, it collapsed without retaining a normal degree of internal consistency.
| Returns to June 30, 2008 |
| Period |
MAPF |
Index |
| One Month |
-6.37% |
-3.43% |
| Three Months |
-4.38% |
-2.09% |
| One Year |
-4.38% |
-4.35% |
| Two Years (annualized) |
+0.32% |
-2.34% |
| Three Years (annualized) |
+1.71% |
-0.67% |
| Four Years (annualized) |
+3.68% |
+1.08% |
| Five Years (annualized) |
+6.82% |
+1.70% |
| Six Years (annualized) |
+6.87% |
+2.72% |
| Seven Years (annualized) |
+8.05% |
+2.79% |
| The Index is the BMO-CM “50” |
Returns assume reinvestment of dividends, and are shown after expenses but before fees. Past performance is not a guarantee of future performance. You can lose money investing in Malachite Aggressive Preferred Fund or any other fund. For more information, see the fund’s main page.
The yields available on high quality preferred shares remain elevated, which is reflected in the current estimate of sustainable income.
| Calculation of MAPF Sustainable Income Per Unit |
| Month |
NAVPU |
Portfolio
Average
YTW |
Leverage
Divisor |
Securities
Average
YTW |
Sustainable
Income |
| June, 2007 |
9.3114 |
5.16% |
1.03 |
5.01% |
0.4665 |
| September |
9.1489 |
5.35% |
0.98 |
5.46% |
0.4995 |
| December, 2007 |
9.0070 |
5.53% |
0.942 |
5.87% |
0.5288 |
| March, 2008 |
8.8512 |
6.17% |
1.047 |
5.89% |
0.5216 |
| June, 2008 |
8.3419 |
6.034% |
0.952 |
6.338% |
$0.5287 |
NAVPU is shown after quarterly distributions.
“Portfolio YTW” includes cash (or margin borrowing), with an assumed interest rate of 0.00%
“Securities YTW” divides “Portfolio YTW” by the “Leverage Divisor” to show the average YTW on the securities held; this assumes that the cash is invested in (or raised from) all securities held, in proportion to their holdings. |
So, despite the poor price performance in June, we must remember that we are fixed-income investors. The expected annual income per unit (these are shown gross of fees and expenses) continues to show an upward path … and it is the income that makes the asset class worthwhile.
I should emphasize, however, that the fund does not explicitly seek to maximize this number. Yield on the portfolio will be given up when it is possible to exchange it for something else that is attractive: credit quality, say, or retractibility. Over the very long term, however, it is the prime objective of fixed income management to maximize the income received from a given amount of capital.
When we look at the MAPF Portfolio Composition for May, 2008, we see that the fund was invested almost entirely in PerpetualDiscounts; this overall analysis is unchanged in the portfolio composition for June. Given the sharp decline in the market in June, it should therefore come as no surprise that the the fund underperformed, but even so … PerpetualDiscounts declined 5.31% in June, so there is a further source.
I have made some data available with this post:
When we look at the June performance of the PerpetualDiscount Index as of May 30, the first thing we notice is that the non-financials did relatively well:
PerpetualDiscount
June Performance
by Industry |
| Industry |
Mean Return
(Equal Weight)
[BAM=Financial] |
Mean Return
(Equal Weight)
[BAM=Non-Financial] |
| Financial |
-6.20% |
-6.16% |
| Non-Financial |
-0.35% |
-1.88% |
BAM is perceived as a financial, but is classified as an “Industrial” by the TSX. Whichever way you slice it, financials did extremely poorly relative to non-financials, and this factor alone is enough to explain the underperformance of MAPF relative to the PerpetualDiscount index – the fund has a position in BAM.PR.N, but the other elements of its PerpetualDiscount exposure is unequivocally financial.
The remainder of the analysis will examine only the financials.
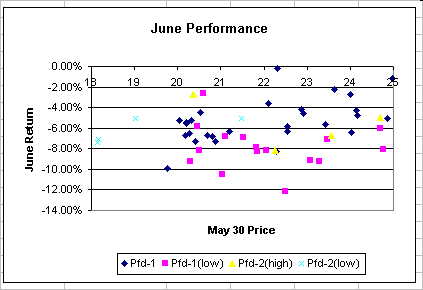
I have previously noted that the more deeply discounted perpetuals underperformed in the period 5/30 to 6/13. The following chart shows that this effect persisted through monthend:
A regression of the May 30 Price against June return for the issues rated Pfd-1 shows that the effect is significant: 28% of the variation is explained by the equation:
Return = -19.77% + 0.65*Price %
Thus, the expected return for a Pfd-1 financial issue in June with a May 30 price of $20 would be -6.77%, while an initial price of $25 would predict a June return of -3.52%. Surprisingly, this effect only hits the Pfd-1 issues … a similar regression for the Pfd-1(low) issues produced no result, while there are not enough data to examine in the Pfd-2(high) and Pfd-2(low) grades.
The price/return relationship for Pfd-1 issues is not just unexpected, it is ludicrous – as I have been harping on since mid-month. I will stress again that my expectations are not based on mere observations of historical relationships – these expectations are at the heart of fixed-income theory.
When selecting a fixed income portfolio, one always bears three scenarios (at least!) in mind – rates generally rise, rates generally fall, rates are essentially flat. More sophisticated analysis is, in many ways, simply an elaboration of these basic assumptions about the future. So, when we compare a low-coupon, low-price PerpetualDiscount to a high-coupon high-price PerpetualDiscount, we come up with the following implications of each scenario (for more information, see my article Perpetual Hockey Sticks):
- If rates go up, the price of each instrument will decline by approximately the same percentage.
- If rates go down, we expect the low-coupon, low-price issue to increase in price more, since it has more room to increase before the holder has to worry about his capital gains being called away.
- If rates remain the same, the higher yielding issue will have a better return. Since the two issues are equal in first scenario, and the low-coupon issue wins in the second, we expect the high-coupon, high-price issue to have the better return in this scenario
Or, to put it another way, investors should demand a higher yield on the high-coupon issues, in order to compensate for the possibility that they might lose out on capital gains if rates decline and the issuer calls the issue for redemption.
As is always the case in preferred share analysis, there is never enough data to show many perfect illustrations of various points – there are just too many cross currents, in terms of credit quality, issuer, coupon, redemption terms … the list is endless. However, there are two issuers of Pfd-1 quality with PerpetualDiscount issues outstanding that cover a broad enough range of coupons to be interesting: CM and RY. The following charts show the May 30 and June 30 yields, plotted against their coupon. It should be noted that if there was no convexity effect (which I would consider the limiting case) the plots should always be flat; a normal convexity effect should show that yield increases as the coupon gets larger, as compensation for the decreased room for capital gains before the holder has to worry about a call.
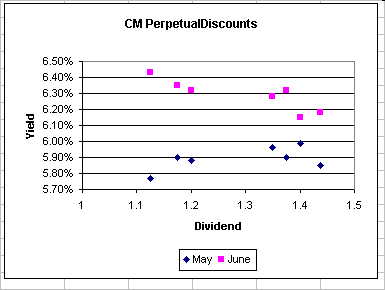
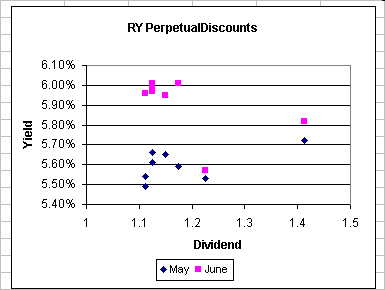
Clearly, the curve change from “normal” at the end of May to “abnormal” at the end of June. Please note that I have deliberately not referred to the June relationship as “inverted” … while normal yield curves can invert (when short rates are higher than long rates), this is an economically reasonable relationship under the correct economic conditions. There are no conditions in which high-coupon perpetual discounts should yield less than low-coupon perpetual discounts, in the absence of special, issue-specific factors, as I noted on June 27:
- A big difference in term to call
- A big difference in liquidity
- A big difference in other terms of the issue (e.g., voting rights, restrictive covenants, etc.)
None of these features is applicable to the CM and RY issues.
Well … despite the fact that the changes in relationships are impossible, they happened anyway. Markets have a way of doing that, just to remind us that we don’t know everything! So why did all this happen?
I suspect that:
- The overall decline in PerpetualDiscounts is due – at least in part – to the Bank of Canada June 10 decision to keep the overnight rate constant. There are many who imagine that there is only one interest rate … if the Government of Canada overnight rate is flat-to-increasing, they think, the same must apply to long term corporate rates. Therefore, they sell, in expectation of future price declines, which become (for a while, anyway, in a small enough market) a self-fulfilling prophecy
- The huge difference in returns between financial and non-financial perpetualDiscounts implies that Fear of Banks is a major factor. It is my feeling that such fears are misplaced. While Canadian banks are certainly not unscathed by the credit crunch, they’re not exposed to the full force of leveraged positions in sub-prime paper either! I do not feel that the actual chance of default by any of Canada’s banks has increased in any kind of material way.
- The abnormal coupon-yield relationship points to retail. Selling something because the price is down, rather than on an objective evaluation of risk/return, is never a winning strategy, but one can always count on retail to do the wrong thing.
- The fact that this effect is most pronounced in the Pfd-1 issues (and barely visible in Pfd-1(low)) points to not just retail, but small-time retail at that. If one can only hold one or two preferreds (due to constraints of portfolio size), it only makes sense to hold tip-top quality – I’ve made that recommendation myself. If these small holders are eager to dump (a portion of) their preferreds, they don’t have a lot of choice as to which ones
What does it all mean? June was a bad month. The fund is overweighted in high quality, low-coupon, financial PerpetualDiscounts and this was precisely the wrong spot to be. HIMIPref™ is a statistically based system and will not work well every time. However, trading continues, based on expected incremental returns and I have every expectation that good results from this trading will become visible in terms of fund return as the market normalizes.