GMP Capital Inc., proud issuer of GMP.PR.B, was confirmed at Pfd-3(low) [Trend Negative] by DBRS:
DBRS Limited (DBRS) has today confirmed the Pfd-3 (low) rating on the Cumulative Preferred Shares of GMP Capital Inc. (GMP or the Company). The trend remains Negative. The rating reflects the strength of the Company’s business franchise as a provider of investment banking and capital markets products and services to its targeted market of mid-sized, primarily Canadian, companies. However, DBRS remains very cautious about the continuing adverse market environment. While GMP’s results in the early part of 2014 demonstrated the Company’s ability to weather weak market conditions, the continuation of the Negative trend reflects the challenges posed by the dramatic decline in oil and gas prices as indicated by GMP’s losses in Q4 2014. To the extent that GMP can adjust to this changed environment, the trend could return to Stable, but sustained weakness in results that indicated a significant deterioration in GMP’s franchise strength or earnings power would likely increase the negative pressure on the rating.
Canaccord Genuity Group Inc., proud issuer of CF.PR.A and CF.PR.C, was confirmed at Pfd-3(low) by DBRS:
DBRS Limited (DBRS) has today confirmed its rating of the Cumulative Preferred Shares of Canaccord Genuity Group Inc. (Canaccord Genuity or the Company) at Pfd-3 (low) with a Stable trend. The Company has successfully integrated recent acquisitions, improved geographic diversity, enhanced its wealth management business segment and demonstrated resilience through the extended weak market environment. Nevertheless, the Company continues to face significant challenges.
Weakness in the energy sector, which has had an impact on many of Canaccord Genuity’s traditional Capital Markets clients, resulted in a loss in the last quarter of 2014 that also reflected impairment of goodwill/intangibles. As a result, the Company implemented expense control initiatives and other actions. The Company announced a planned 4% reduction in its overall workforce, primarily affecting the U.K./Europe and U.S. operations. In addition, there were a number of changes to the executive structure, including the appointment of a CEO for the combined North American capital markets and changes to the investment banking executive team.
It was a mixed day for the Canadian preferred share market, with PerpetualDiscounts gaining 8bp, FixedResets off 10bp and DeemedRetractibles up 15bp. The Performance Highlights table is dominated by losing FixedResets, with a notable presence of Enbridge issues. Volume was above average.
For as long as the FixedReset market is so violently unsettled, I’ll keep publishing updates of the more interesting and meaningful series of FixedResets’ Implied Volatilities. This doesn’t include Enbridge because although Enbridge has a large number of issues outstanding, all of which are quite liquid, the range of Issue Reset Spreads is too small for decent conclusions. The low is 212bp (ENB.PR.H; second-lowest is ENB.PR.D at 237bp) and the high is a mere 268 for ENB.PF.G.
Remember that all rich /cheap assessments are:
» based on Implied Volatility Theory only
» are relative only to other FixedResets from the same issuer
» assume constant GOC-5 yield
» assume constant Implied Volatility
» assume constant spread
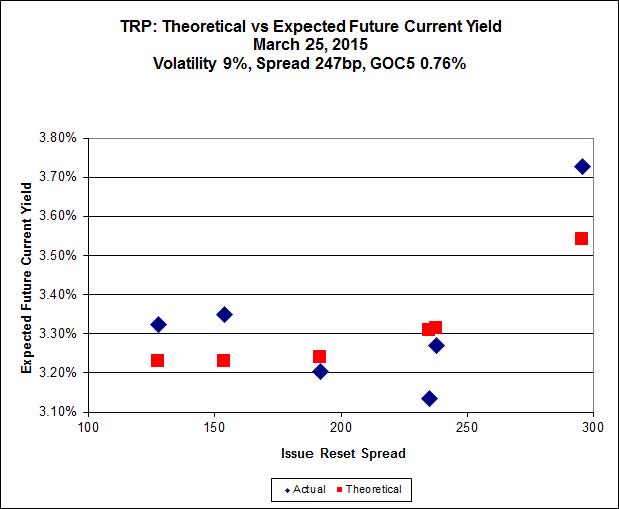
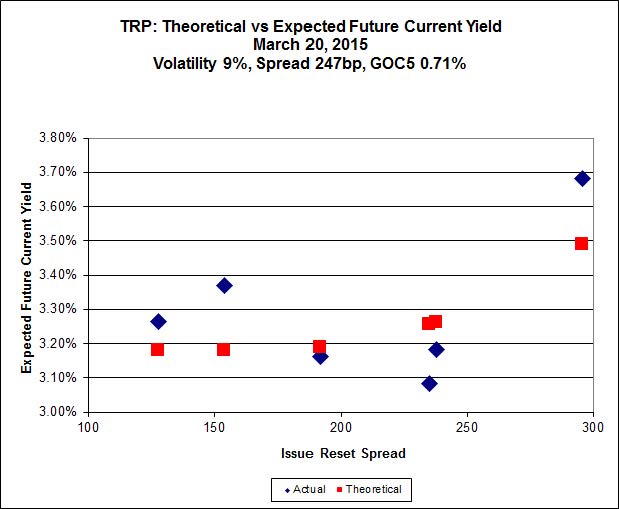
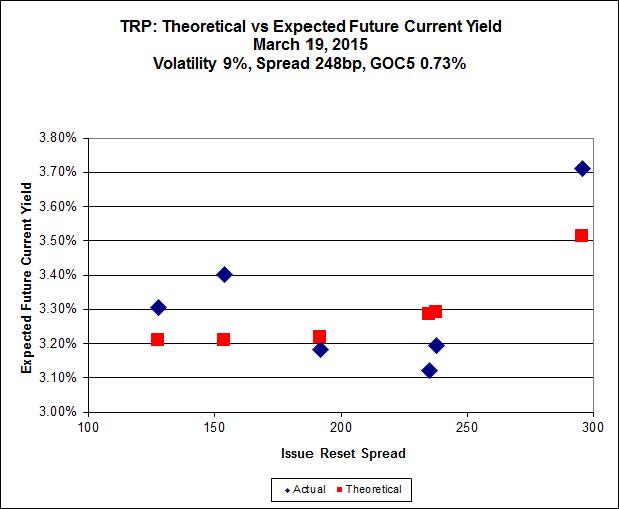
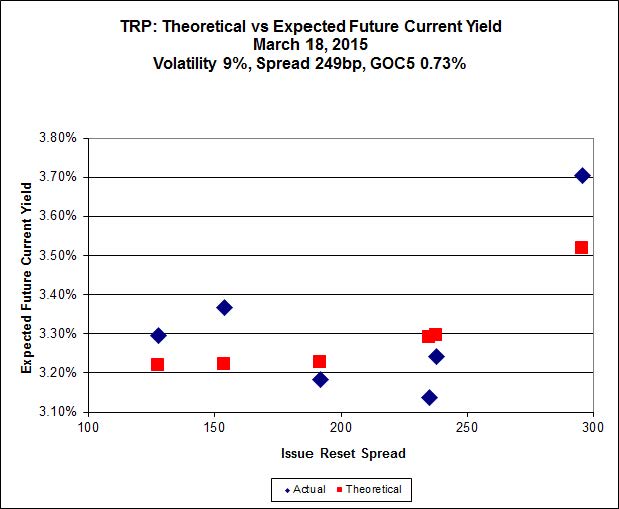
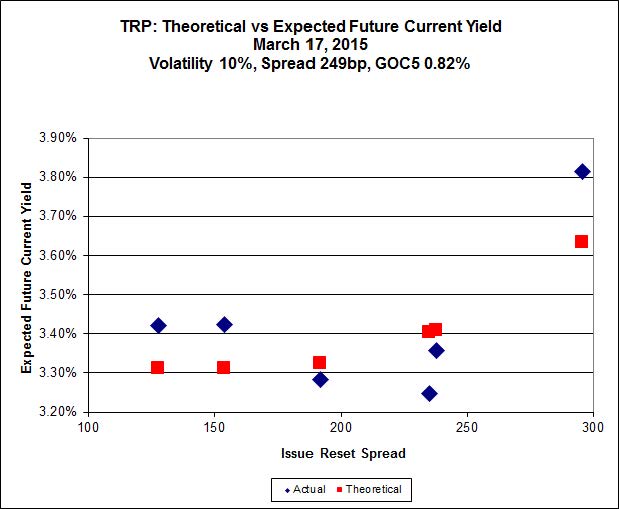
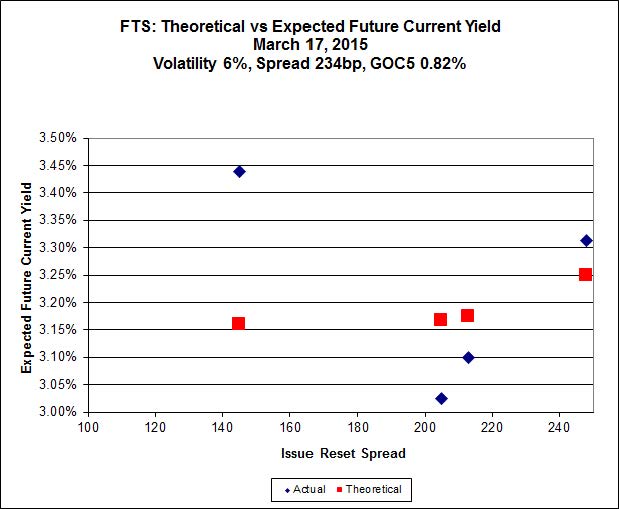
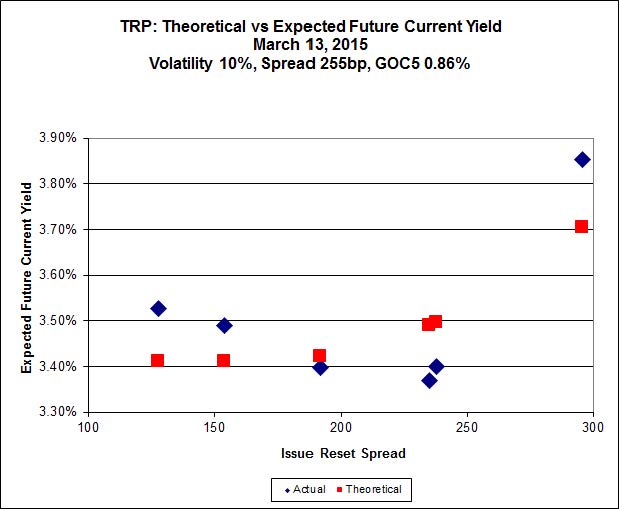
Here’s TRP:
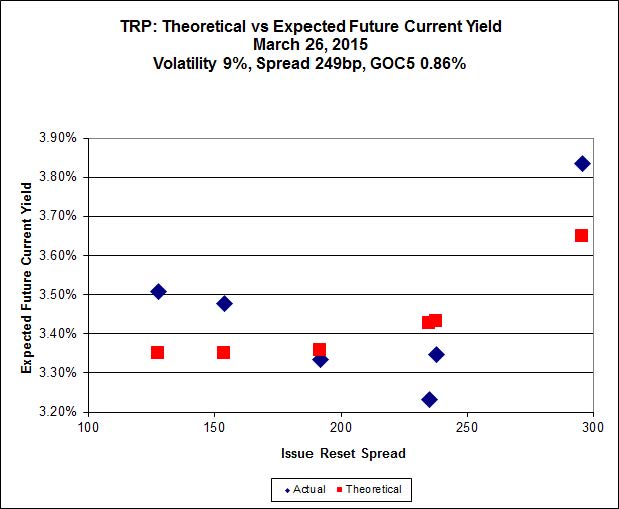
Click for Big
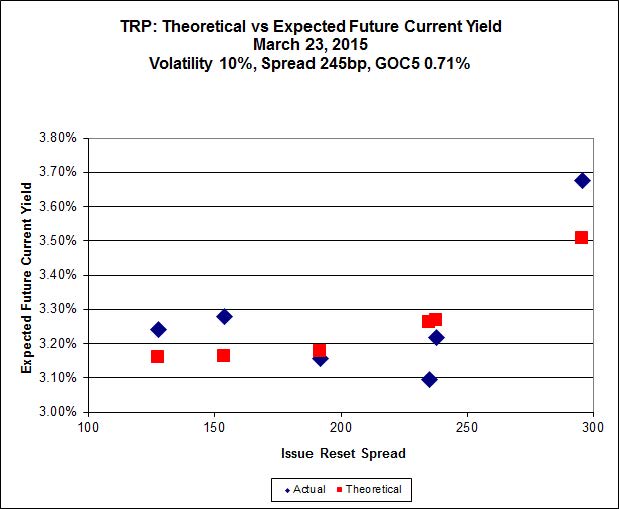
TRP.PR.E, which resets 2019-10-30 at +235, is bid at 24.83 to be $1.40 rich, while TRP.PR.G, resetting 2020-11-30 at +296, is $1.27 cheap at its bid price of 24.91.
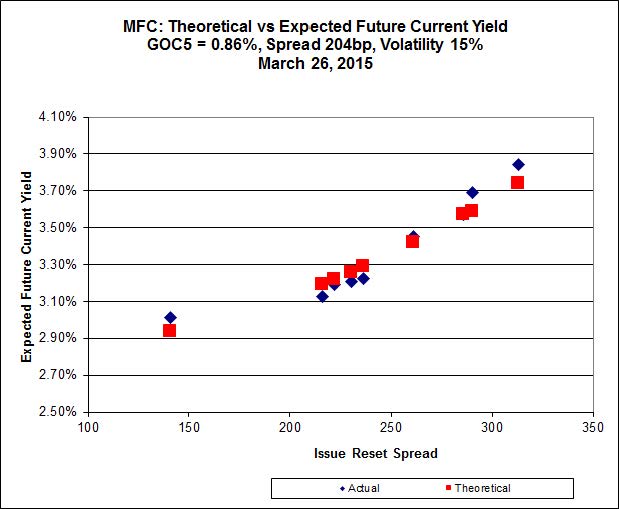
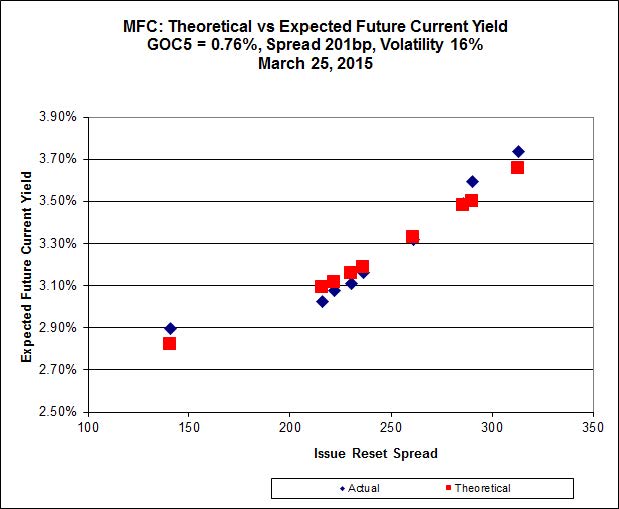
Click for Big
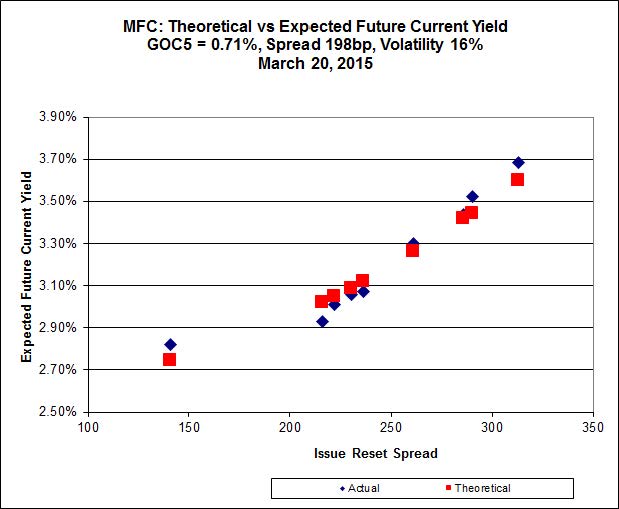
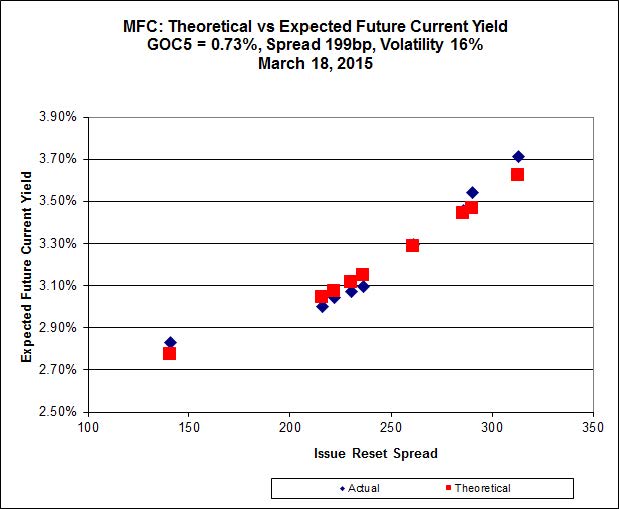
Another excellent fit, but the numbers are perplexing. Implied Volatility for MFC continues to be a conundrum, although it declined substantially today. It is still too high if we consider that NVCC rules will never apply to these issues; it is still too low if we consider them to be NVCC non-compliant issues (and therefore with Deemed Maturities in the call schedule).
Most expensive is MFC.PR.L, resetting at +216 on 2019-6-19, bid at 24.15 to be $0.49 rich, while MFC.PR.G, resetting at +290bp on 2016-12-19, is bid at 25.47 to be $0.72 cheap.
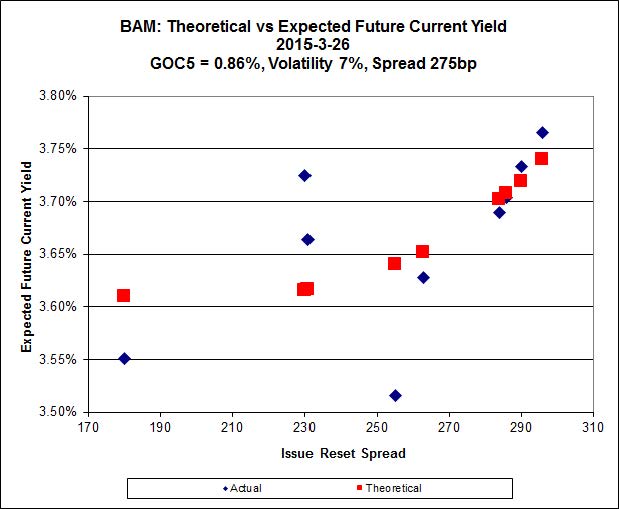
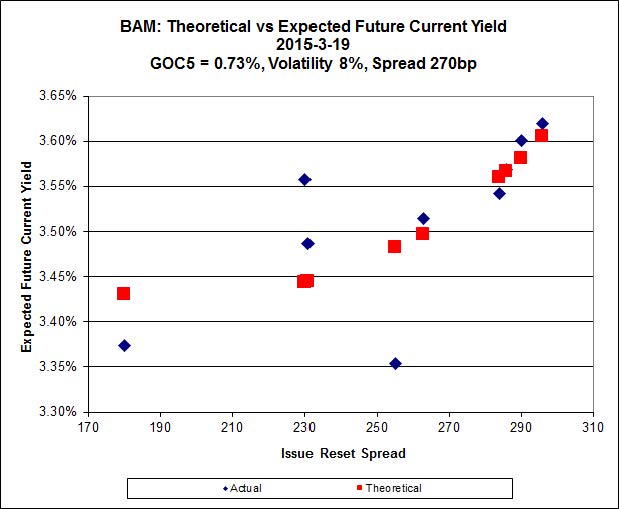
Click for Big
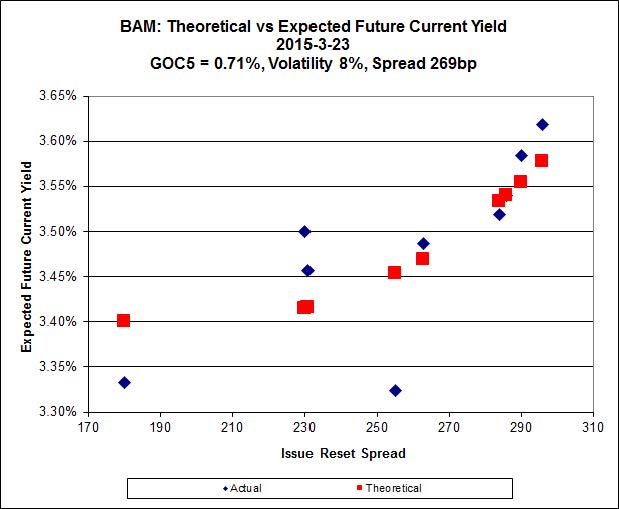
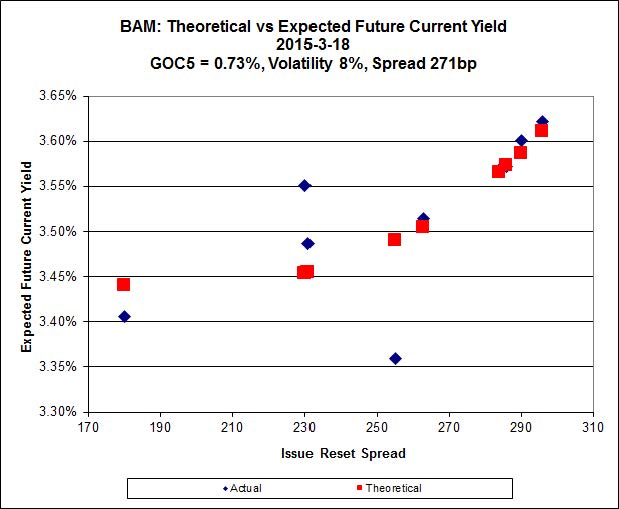
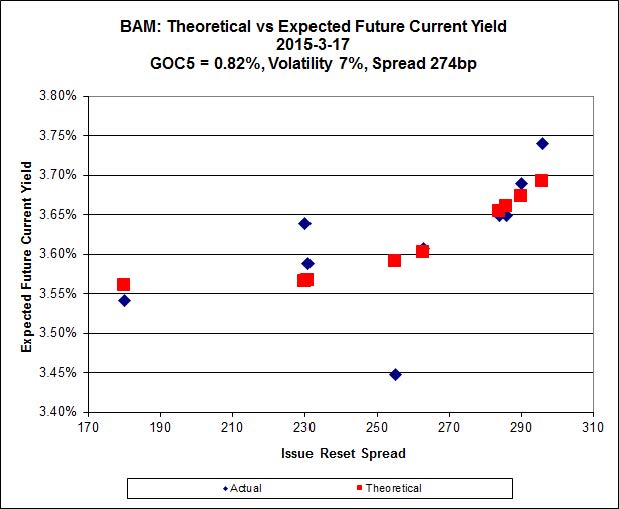
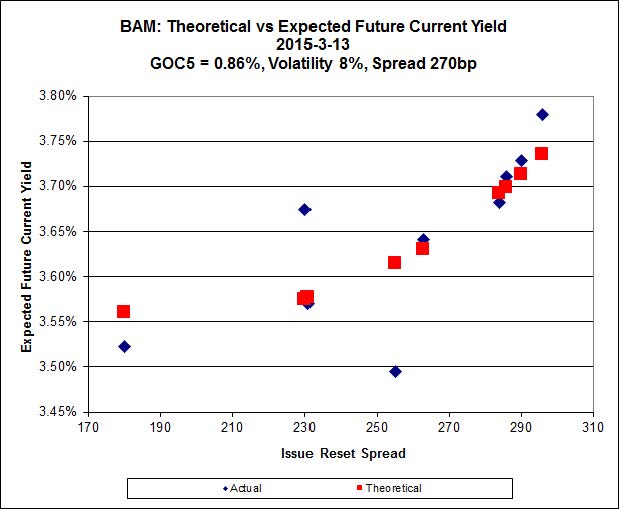
The fit on this series is actually quite reasonable – it’s the scale that makes it look so weird.
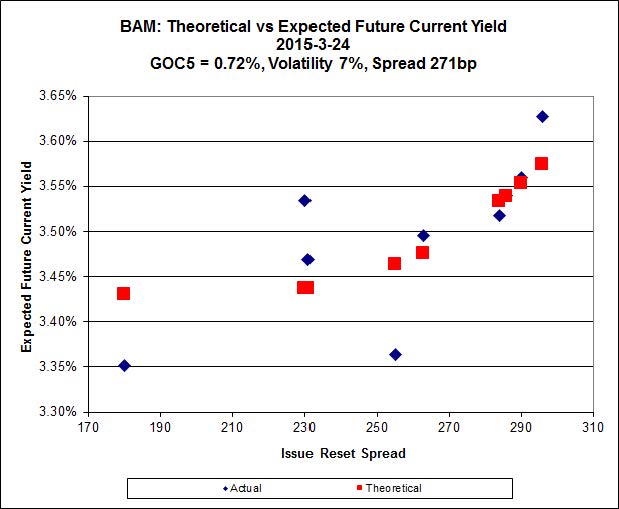
The cheapest issue relative to its peers is BAM.PR.R, resetting at +230bp on 2016-6-30, bid at 21.21 to be $0.64 cheap. BAM.PF.E, resetting at +255bp 2020-3-31 is bid at 24.25 and appears to be $0.83 rich.
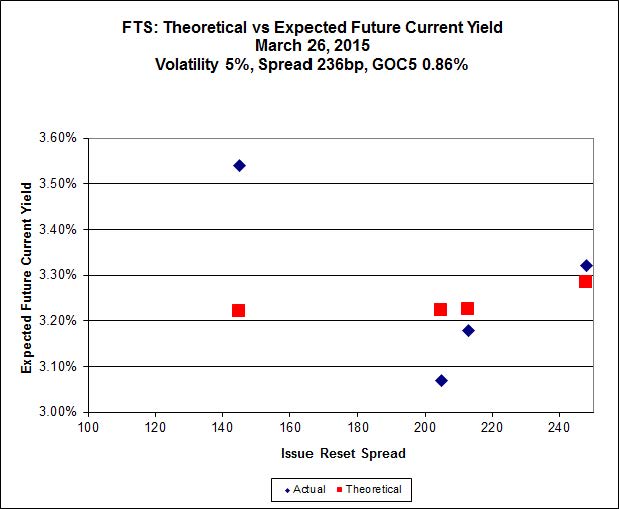
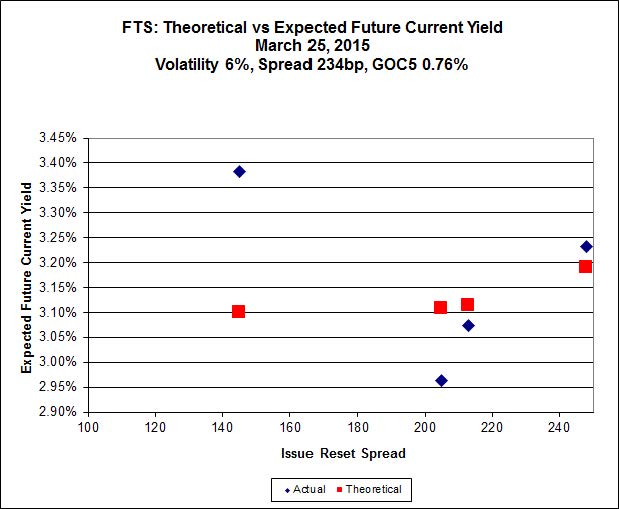
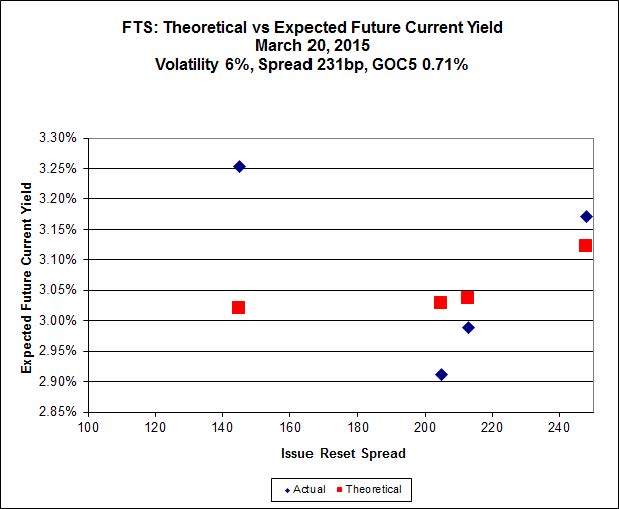
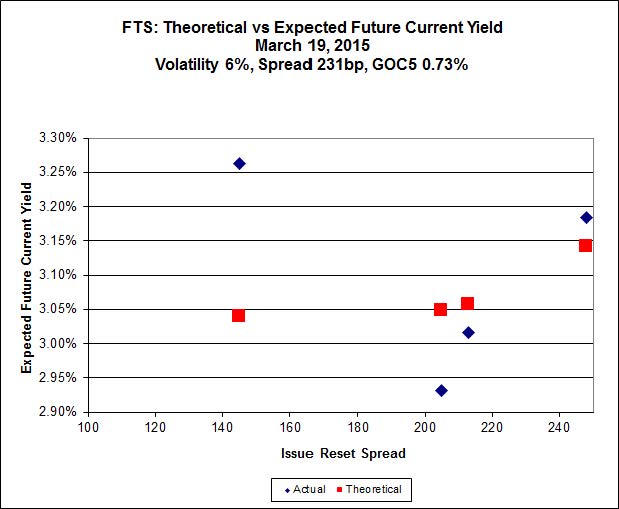
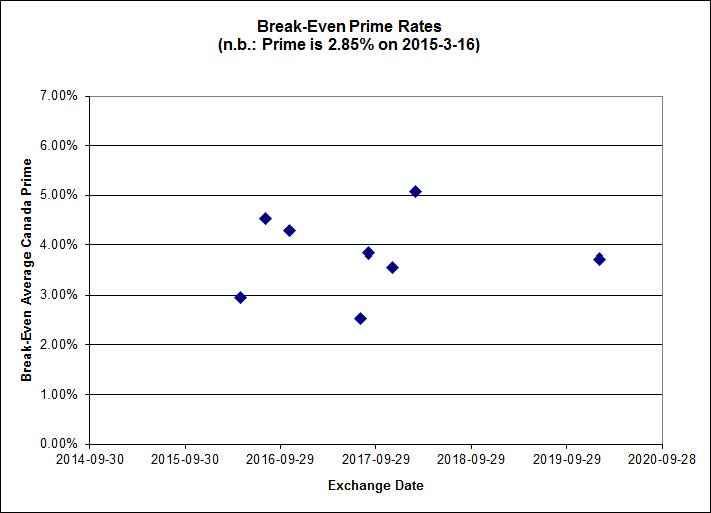
Click for Big
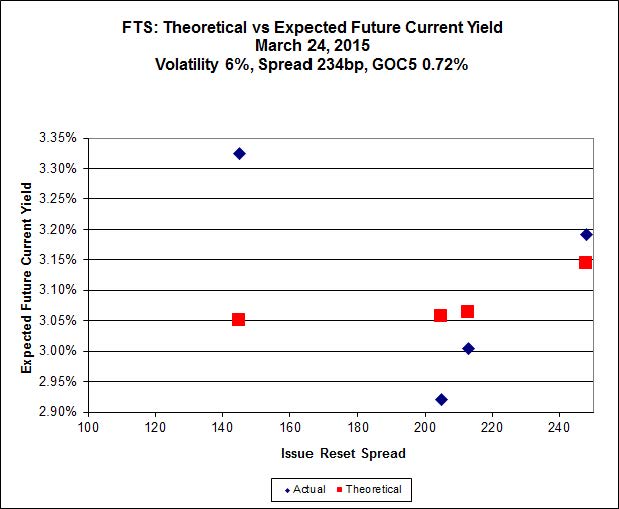
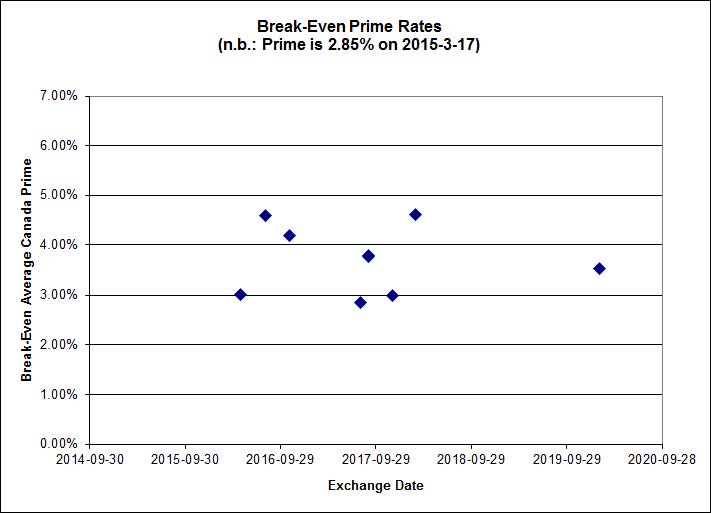
This is just weird because the middle is expensive and the ends are cheap but anyway … FTS.PR.H, with a spread of +145bp, and bid at 16.31, looks $1.62 cheap and resets 2015-6-1. FTS.PR.K, with a spread of +205bp and resetting 2019-3-1, is bid at 23.71 and is $1.13 rich.
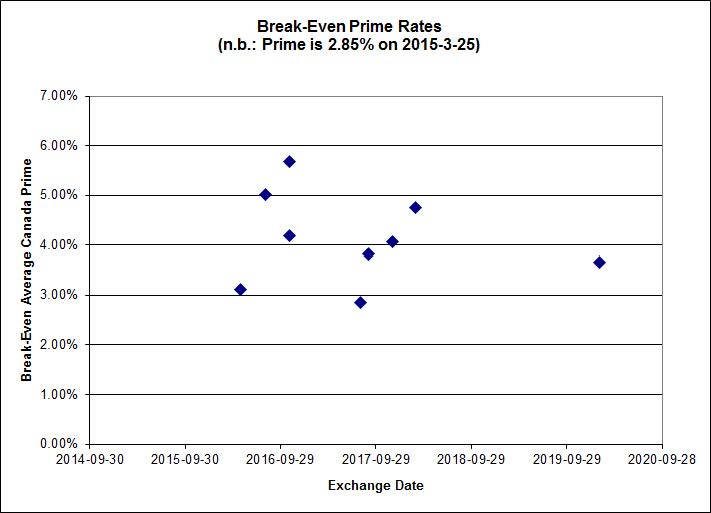
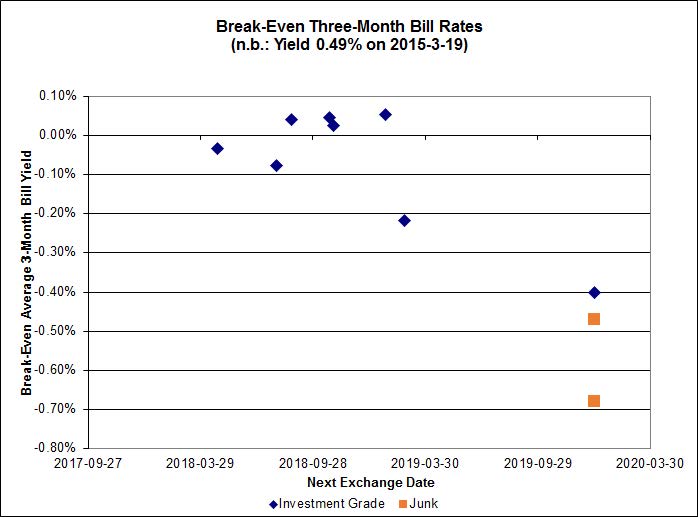
Click for Big
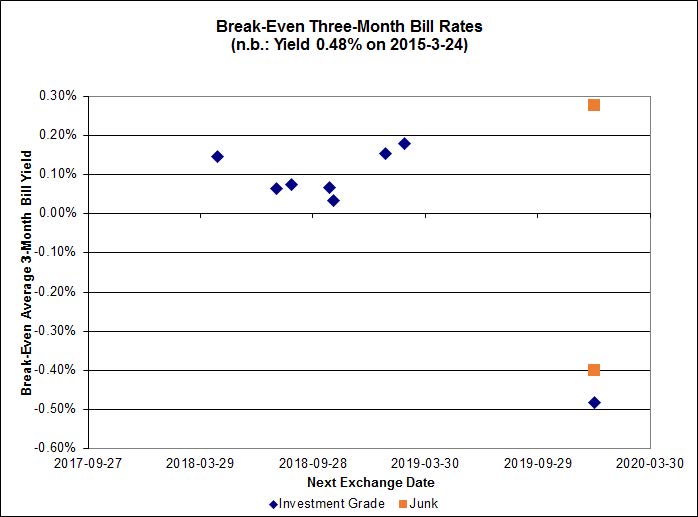
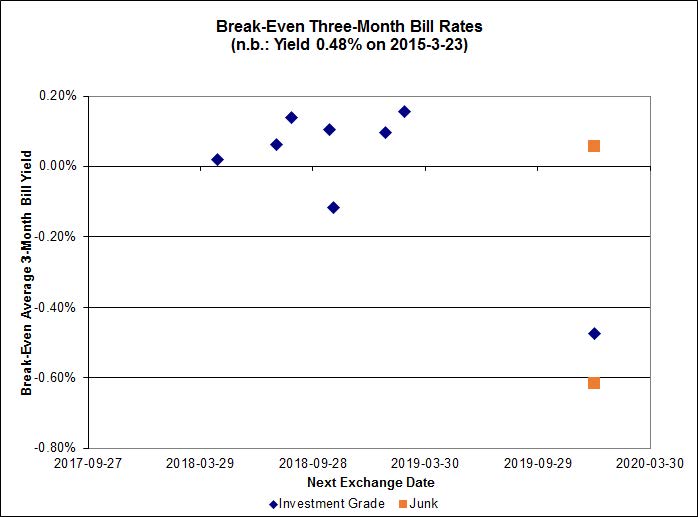
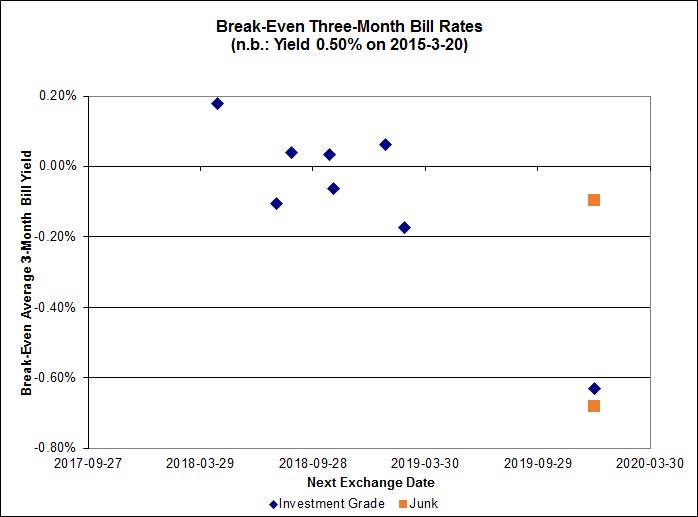
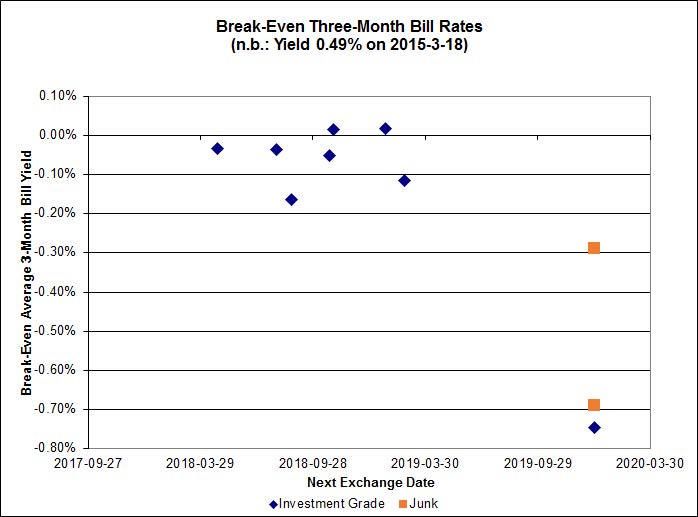
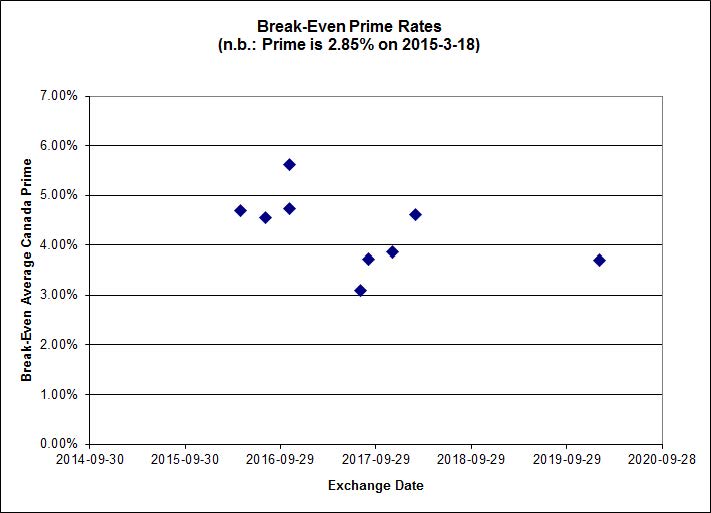
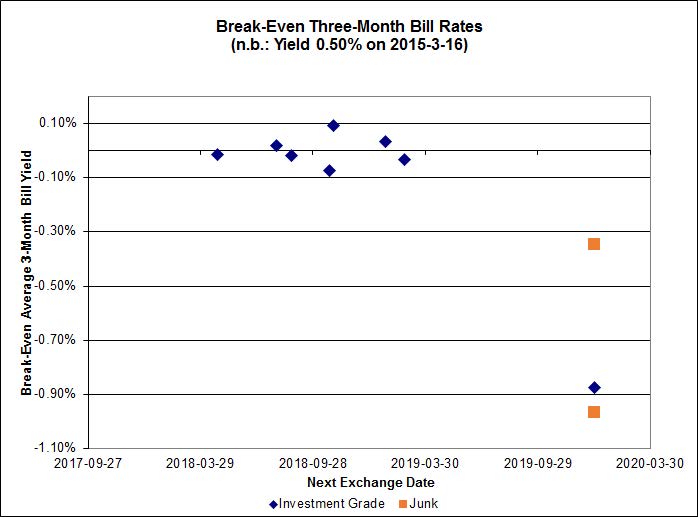
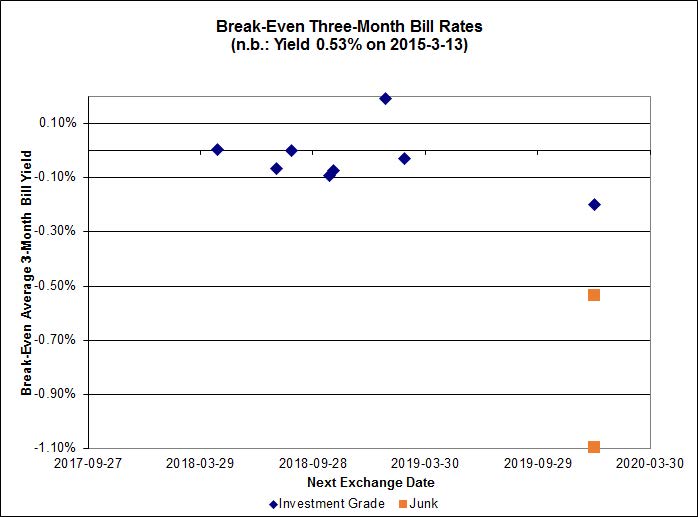
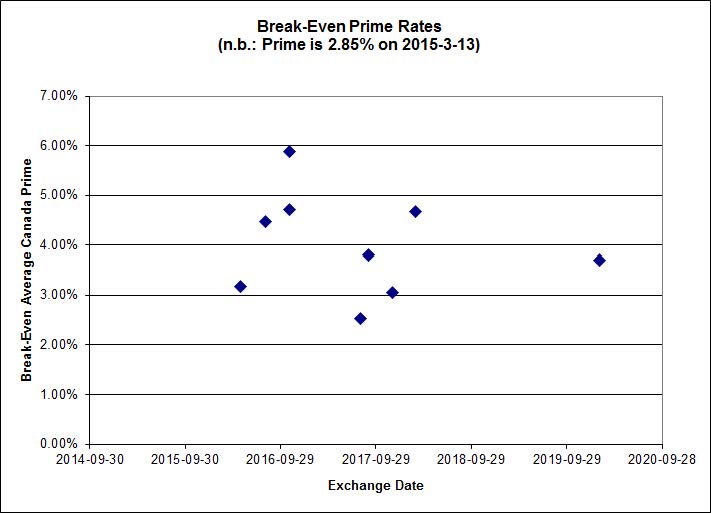
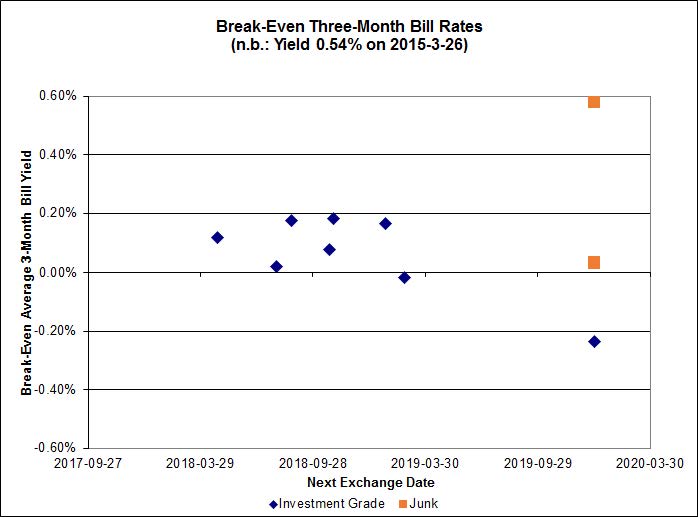
Investment-grade pairs predict an average over the next five years of about 0.10% – except for one outlier, TRP.PR.A / TRP.PR.F, which has a break-even of -0.24%. The DC.PR.B / DC.PR.D pair is still off the charts and now predicts an average bill rate over the next 4 3/4 years of -2.31%.
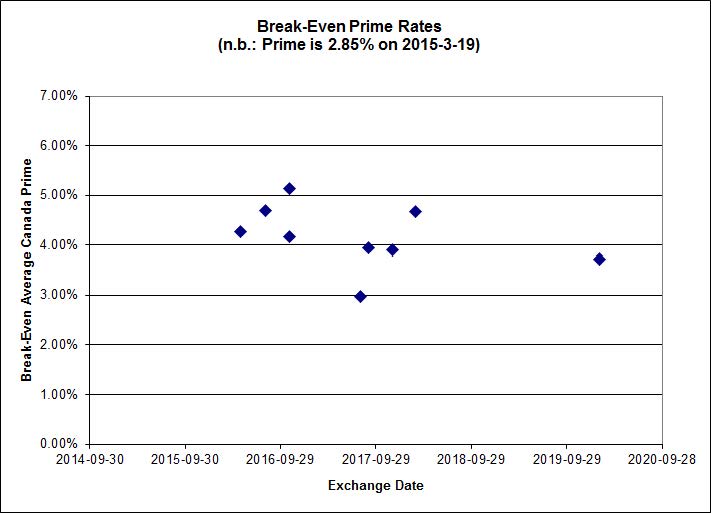
Click for Big
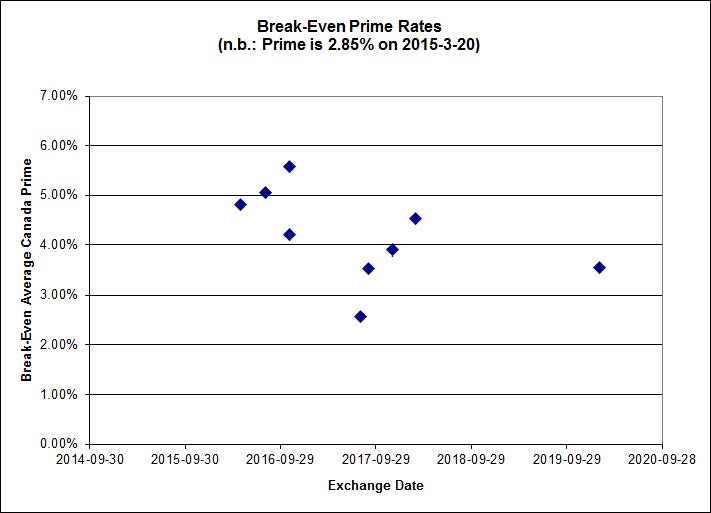
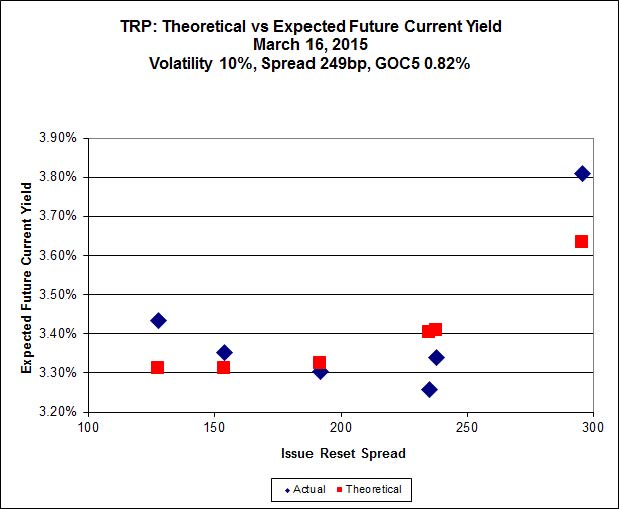
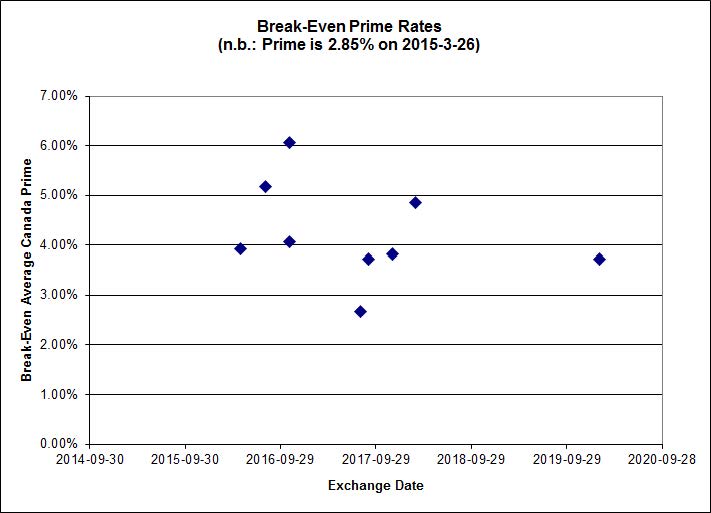
Shall we just say that this exhibits a high level of confidence in the continued rapacity of Canadian banks?
| HIMIPref™ Preferred Indices These values reflect the December 2008 revision of the HIMIPref™ Indices Values are provisional and are finalized monthly |
|||||||
| Index | Mean Current Yield (at bid) |
Median YTW |
Median Average Trading Value |
Median Mod Dur (YTW) |
Issues | Day’s Perf. | Index Value |
| Ratchet | 0.00 % | 0.00 % | 0 | 0.00 | 0 | 0.3014 % | 2,361.4 |
| FixedFloater | 0.00 % | 0.00 % | 0 | 0.00 | 0 | 0.3014 % | 4,128.9 |
| Floater | 3.21 % | 3.21 % | 65,192 | 19.21 | 3 | 0.3014 % | 2,510.4 |
| OpRet | 4.07 % | 1.51 % | 109,900 | 0.23 | 1 | -0.2378 % | 2,762.6 |
| SplitShare | 4.37 % | 4.32 % | 34,163 | 3.47 | 4 | -0.2695 % | 3,206.6 |
| Interest-Bearing | 0.00 % | 0.00 % | 0 | 0.00 | 0 | -0.2378 % | 2,526.1 |
| Perpetual-Premium | 5.30 % | 1.67 % | 56,991 | 0.08 | 25 | -0.0031 % | 2,523.4 |
| Perpetual-Discount | 4.97 % | 4.99 % | 160,970 | 15.23 | 9 | 0.0792 % | 2,816.7 |
| FixedReset | 4.39 % | 3.38 % | 245,903 | 16.77 | 85 | -0.1031 % | 2,428.5 |
| Deemed-Retractible | 4.90 % | -1.18 % | 111,362 | 0.14 | 37 | 0.1547 % | 2,661.2 |
| FloatingReset | 2.42 % | 2.76 % | 80,504 | 6.31 | 8 | 0.4479 % | 2,351.5 |
| Performance Highlights | |||
| Issue | Index | Change | Notes |
| ENB.PR.Y | FixedReset | -1.88 % | YTW SCENARIO Maturity Type : Limit Maturity Maturity Date : 2045-03-26 Maturity Price : 19.87 Evaluated at bid price : 19.87 Bid-YTW : 4.20 % |
| PWF.PR.P | FixedReset | -1.57 % | YTW SCENARIO Maturity Type : Limit Maturity Maturity Date : 2045-03-26 Maturity Price : 18.75 Evaluated at bid price : 18.75 Bid-YTW : 3.25 % |
| ENB.PR.P | FixedReset | -1.46 % | YTW SCENARIO Maturity Type : Limit Maturity Maturity Date : 2045-03-26 Maturity Price : 20.20 Evaluated at bid price : 20.20 Bid-YTW : 4.22 % |
| ENB.PR.N | FixedReset | -1.43 % | YTW SCENARIO Maturity Type : Limit Maturity Maturity Date : 2045-03-26 Maturity Price : 20.65 Evaluated at bid price : 20.65 Bid-YTW : 4.27 % |
| MFC.PR.J | FixedReset | -1.06 % | YTW SCENARIO Maturity Type : Hard Maturity Maturity Date : 2025-01-31 Maturity Price : 25.00 Evaluated at bid price : 25.12 Bid-YTW : 3.51 % |
| BAM.PF.G | FixedReset | -1.03 % | YTW SCENARIO Maturity Type : Limit Maturity Maturity Date : 2045-03-26 Maturity Price : 23.17 Evaluated at bid price : 25.07 Bid-YTW : 3.66 % |
| BAM.PR.T | FixedReset | -1.01 % | YTW SCENARIO Maturity Type : Limit Maturity Maturity Date : 2045-03-26 Maturity Price : 21.33 Evaluated at bid price : 21.63 Bid-YTW : 3.65 % |
| TRP.PR.F | FloatingReset | 1.16 % | YTW SCENARIO Maturity Type : Limit Maturity Maturity Date : 2045-03-26 Maturity Price : 19.26 Evaluated at bid price : 19.26 Bid-YTW : 3.11 % |
| MFC.PR.M | FixedReset | 1.18 % | YTW SCENARIO Maturity Type : Hard Maturity Maturity Date : 2025-01-31 Maturity Price : 25.00 Evaluated at bid price : 24.96 Bid-YTW : 3.54 % |
| GWO.PR.H | Deemed-Retractible | 1.33 % | YTW SCENARIO Maturity Type : Call Maturity Date : 2015-04-25 Maturity Price : 25.00 Evaluated at bid price : 25.20 Bid-YTW : -5.74 % |
| MFC.PR.C | Deemed-Retractible | 1.42 % | YTW SCENARIO Maturity Type : Hard Maturity Maturity Date : 2025-01-31 Maturity Price : 25.00 Evaluated at bid price : 24.21 Bid-YTW : 4.95 % |
| CIU.PR.C | FixedReset | 1.45 % | YTW SCENARIO Maturity Type : Limit Maturity Maturity Date : 2045-03-26 Maturity Price : 17.50 Evaluated at bid price : 17.50 Bid-YTW : 3.12 % |
| Volume Highlights | |||
| Issue | Index | Shares Traded |
Notes |
| TRP.PR.E | FixedReset | 230,005 | Scotia crossed blocks of 25,000 shares, 50,000 and 25,000, all at 24.90. RBC crossed blocks of 50,000 and 25,000 at the same price. Desjardins crossed blocks of 35,000 and 15,000 at the same price again. YTW SCENARIO Maturity Type : Limit Maturity Maturity Date : 2045-03-26 Maturity Price : 23.13 Evaluated at bid price : 24.83 Bid-YTW : 3.26 % |
| ENB.PR.B | FixedReset | 147,515 | RBC crossed 125,000 at 19.28. YTW SCENARIO Maturity Type : Limit Maturity Maturity Date : 2045-03-26 Maturity Price : 19.30 Evaluated at bid price : 19.30 Bid-YTW : 4.21 % |
| SLF.PR.H | FixedReset | 104,013 | Nesbitt crossed 101,400 at 22.58. YTW SCENARIO Maturity Type : Hard Maturity Maturity Date : 2025-01-31 Maturity Price : 25.00 Evaluated at bid price : 22.58 Bid-YTW : 4.27 % |
| TD.PF.D | FixedReset | 72,900 | Recent new issue. YTW SCENARIO Maturity Type : Limit Maturity Maturity Date : 2045-03-26 Maturity Price : 23.14 Evaluated at bid price : 25.01 Bid-YTW : 3.41 % |
| FTS.PR.M | FixedReset | 58,569 | Desjardins crossed 20,300 at 25.09. RBC crossed 15,900 at the same price. YTW SCENARIO Maturity Type : Limit Maturity Maturity Date : 2045-03-26 Maturity Price : 23.23 Evaluated at bid price : 25.15 Bid-YTW : 3.25 % |
| CM.PR.Q | FixedReset | 49,450 | Recent new issue. YTW SCENARIO Maturity Type : Limit Maturity Maturity Date : 2045-03-26 Maturity Price : 23.09 Evaluated at bid price : 24.85 Bid-YTW : 3.44 % |
| There were 37 other index-included issues trading in excess of 10,000 shares. | |||
| Wide Spread Highlights | ||
| Issue | Index | Quote Data and Yield Notes |
| CIU.PR.C | FixedReset | Quote: 17.50 – 18.39 Spot Rate : 0.8900 Average : 0.5730 YTW SCENARIO |
| CGI.PR.D | SplitShare | Quote: 25.35 – 25.96 Spot Rate : 0.6100 Average : 0.4652 YTW SCENARIO |
| PWF.PR.P | FixedReset | Quote: 18.75 – 19.12 Spot Rate : 0.3700 Average : 0.2650 YTW SCENARIO |
| ENB.PR.N | FixedReset | Quote: 20.65 – 21.00 Spot Rate : 0.3500 Average : 0.2467 YTW SCENARIO |
| ENB.PF.A | FixedReset | Quote: 21.46 – 21.78 Spot Rate : 0.3200 Average : 0.2205 YTW SCENARIO |
| CU.PR.C | FixedReset | Quote: 24.30 – 24.59 Spot Rate : 0.2900 Average : 0.2088 YTW SCENARIO |