Category: Market Action

Market Action

June 4, 2014

It’s nice to see a statistic about how many CLOs lost money in the Credit Crunch:

Issuance of CLOs, which helped finance some of the biggest leveraged buyouts in history during the last credit boom, has picked up following an early 2014 slump brought on by the publication of the Volcker Rule designed to limit risk-taking by banks — major buyers of the funds. CLOs are investors in speculative-grade loans, an asset class in which U.S. banking regulators have said underwriting standards have become too lax.
…
CLOs pool high-yield corporate loans and slice them into securities of varying risk and return, typically from AAA ratings down to BB. The lowest portion, known as the equity tranche, offers the highest potential returns and the greatest risk because investors are the first to see their interest payouts reduced when loans backing the CLO default.

CLO managers may also be trying to issue deals ahead of risk-retention rules proposed by the Dodd-Frank Act in order to increase assets under management and income, said Kroszner. The regulation may require CLO managers to hold 5 percent of the debt they package or sell.
…
Out of 719 U.S. CLOs that purchased widely syndicated loans and were rated by Moody’s Investors Service between January 1996 and May 2012, only 14 funds lost any of their principal at maturity, according to a July 2012 report from the ratings firm.
…
The growth in riskier corporate lending led the Federal Reserve and the Office of the Comptroller of the Currency to warn lenders last year to improve lax underwriting practices. Todd Vermilyea, a Fed official, said May 13 that standards “have continued to deteriorate in 2014” and that “stronger supervisory action” may be needed.

While the Volcker Rule hasn’t led to fewer CLOs it has kept the cost to raise the funds elevated.

The average rate paid on CLO portions ranked AAA was about 150 basis points more than the London interbank offered rate in May, according to Wells Fargo. That’s up from a spread as low as 110 basis points on AAA slices last year.

As I have often complained, regulators and politicians are always careful to talk about downgrades of engineered products, rather than actual defaults.

Watch out for falling house prices!

In May, new home prices in 62 Chinese cities edged downward from the month before, dragging down the Chinese average for the first time in nearly two years. The biggest decline came in Shantou, where prices fell 3.64 per cent from April, according to China Index Academy, a research arm of SouFun, which operates the country’s largest real estate portal.

China’s real estate market is the bedrock of its economy. Residential housing is worth some 12.5 per cent of GDP, and homes contain some two-thirds of Chinese household wealth. A fracture in Chinese housing, in other words, is a fracture in China’s financial well-being.

And the slowdown has come with remarkable speed. Last December, Chinese housing prices rose 12 per cent year-on-year, the biggest gain of 2013. By May, sales were down more than 50 per cent from April at Shantou’s Jiacheng Real Estate Agency.

Assiduous Readers will know of my fondness for mocking CalPERS – the politicized fund that doesn’t do credit analysis. I’ve acquired another target – The Norwegian Government Pension Fund, an $853.9 billion pension fund with no trading expertise:

Norway’s $880 billion sovereign wealth fund, the world’s largest, is throwing its support behind Brad Katsuyama’s new exchange.

Katsuyama’s IEX Group Inc., made famous in Michael Lewis’s best-selling book “Flash Boys,” could shield investors from the predatory habits of high-frequency traders, said the fund, which holds $521.2 billion in stocks globally and is Europe’s biggest equity investor.

“IEX is a trading venue where all players participate on the same terms,” oil fund spokesman Thomas Sevang said in an e-mailed response to questions. “We support this.”

The BoC kept overnight rates steady:

Total CPI inflation has moved up to around the 2 per cent target, sooner than anticipated in the Bank’s April Monetary Policy Report (MPR), largely due to the temporary effects of higher energy prices and exchange rate pass-through. Core inflation remains significantly below 2 per cent although it has drifted up slightly, partly owing to past exchange rate movements.
…
The Canadian economy grew at a modest rate in the first quarter, held back by severe weather and supply constraints. The ingredients for a pickup in exports remain in place, including the lower Canadian dollar and an anticipated strengthening of foreign demand. Improved corporate profits, especially in exchange rate-sensitive sectors, should also support higher business investment in the coming quarters. There are continued signs of a soft landing in the housing market and a constructive evolution of household imbalances. We still expect excess supply to be absorbed gradually as the fundamental drivers of growth and inflation in Canada strengthen.

Weighing recent higher inflation readings against slightly increased risks to economic growth leaves the downside risks to the inflation outlook as important as before. At the same time, the risks associated with household imbalances remain elevated. The Bank judges that the balance of risks remains within the zone for which the current stance of monetary policy is appropriate and therefore has decided to maintain the target for the overnight rate at 1 per cent. The timing and direction of the next change to the policy rate will depend on how new information influences the balance of risks.

There was some chatter about the effect on the dollar:

The loonie had been as high as about 91.7 cents, but began to slip in anticipation of the announcement, to 91.5 cents. In the wake of the statement, it dipped further to 91.3 cents, and by midday stood at 91.4 cents.

Before today, the currency had been hovering around the 92-cent level, having moved up recently.
…
“It could have been expected that downside interest rates moves were taken off the table but this is not the case,” said Rahim Madhavji of Knightsbridge Foreign Exchange.

“The Canadian dollar fell lower on the Bank of Canada continuing to harp a tone of we’re still nowhere close to raising interest rates,” he added in a research note titled “Bank of Canada slaps loonie lower.”

“It seems that the Bank of Canada is quite content with the lower Canadian dollar boosting exports and assisting with inflation. Today’s BoC statement removes any catalyst for loonie bulls in the near term.”

… and some criticism of the dovish language:

“Comes a point the central bank will have to drop the dovish language, although it’s clear that it will try to delay as long as possible,” said Krishen Rangasamy, senior economist the National Bank of Canada.

The bank’s insistence that disinflation remains a threat could prove tough to defend as as the summer and fall wear on, Bank of Nova Scotia economists Derek Holt and Dov Zigler said in a research note. “The Bank of Canada faces a greater sales job to explain why the ‘downside risks to the inflation outlook [are] as important as before,’” they said.

… though mind you, the dollar isn’t helping exports much:

For months, Mr. Poloz and other bank officials have stressed the importance of exports and business investment to putting the economy back on track.

But so far, exports continue to underperform – a reality underscored by Statistics Canada’s report Wednesday that exports dropped 1.8 per cent in April, tilting the trade balance back into deficit.

I think it’s unclear as to where all this hyperinflation and wheelbarrowfulls of cash are going to come from. Not Europe!

Euro zone price inflation fell unexpectedly in May, increasing the risks of deflation in the currency area and sealing the case for the European Central Bank to act this week.

Annual consumer inflation in the 18 countries sharing the euro fell to 0.5 per cent in May from 0.7 per cent in April, the EU’s statistics office Eurostat said on Tuesday.

… not with negative interest rates in Europe, it won’t:

Mario Draghi’s experiment with negative interest rates is unlikely to stop investors from seeking something stronger.

The European Central Bank president will herald a new era today by taking the deposit rate below zero, according to economists in a Bloomberg News survey. That probably won’t quell calls for more radical measures such as quantitative easing to stop the euro area from sliding into deflation.
…
In the Bloomberg survey, 44 of 50 economists said the ECB will cut its deposit rate to negative from zero, with the median estimate for a level of minus 0.1 percent. The survey also predicts that the benchmark main refinancing rate will be reduced by 15 basis points to a record-low 0.1 percent.

The decision will be announced at 1:45 p.m. in Frankfurt. Draghi will hold a press conference 45 minutes later, where he’ll also release revised ECB forecasts on inflation and economic growth.

… which may help a mouthpiece for the UK government carry out his instructions:

Mark Carney has a new ally in his battle to keep Bank of England policy loose: Mario Draghi.

As the BOE’s nine-person Monetary Policy Committee divides between Carney’s view that low rates are still needed and a faction leaning toward higher borrowing costs, events in Frankfurt may favor the governor by weakening the euro against the pound, helping to curb U.K. inflation pressure. The MPC meets in London today and will announce its decision at noon.

It was a mixed day of adjustment for the Canadian preferred share market today, following yesterday’s fireworks, with PerpetualDiscounts down 26bp, FixedResets up 23bp and DeemedRetractibles gaining 4bp. The Performance Highlights table is longer than usual and dominated by winning FixedResets. Volume was on the high side of average.

PerpetualDiscounts now yield 5.30%, equivalent to 6.89% interest at the standard equivalency factor of 1.3x. Long corporates now yield about 4.35%, so the pre-tax interest-equivalent spread (in this context the “Seniority Spread”) is now about 255bp, a slight (and perhaps spurious) widening from the 250bp reported May 28.

HIMIPref™ Preferred Indices
These values reflect the December 2008 revision of the HIMIPref™ Indices

Values are provisional and are finalized monthly
Index Mean
Current
Yield
(at bid)
Median
YTW
Median
Average
Trading
Value
Median
Mod Dur
(YTW)
Issues Day’s Perf. Index Value
Ratchet 0.00 % 0.00 % 0 0.00 0 -0.4840 % 2,499.1
FixedFloater 4.57 % 3.82 % 31,867 17.77 1 0.3377 % 3,759.4
Floater 2.92 % 3.04 % 46,985 19.57 4 -0.4840 % 2,698.3
OpRet 4.38 % -13.66 % 30,546 0.09 2 0.0389 % 2,711.6
SplitShare 4.81 % 4.31 % 63,765 4.15 5 0.0796 % 3,113.9
Interest-Bearing 0.00 % 0.00 % 0 0.00 0 0.0389 % 2,479.5
Perpetual-Premium 5.51 % 1.02 % 85,658 0.08 17 0.0069 % 2,402.5
Perpetual-Discount 5.27 % 5.30 % 103,148 14.94 20 -0.2568 % 2,539.0
FixedReset 4.54 % 3.72 % 220,557 8.79 76 0.2269 % 2,514.5
Deemed-Retractible 5.02 % 1.17 % 151,916 0.22 43 0.0410 % 2,520.9
FloatingReset 2.68 % 2.53 % 143,048 3.99 6 -0.2452 % 2,476.0
Performance Highlights
Issue Index Change Notes
TD.PR.Z FloatingReset -1.08 % YTW SCENARIO
Maturity Type : Hard Maturity
Maturity Date : 2022-01-31
Maturity Price : 25.00
Evaluated at bid price : 24.82
Bid-YTW : 2.76 %
MFC.PR.J FixedReset 1.07 % YTW SCENARIO
Maturity Type : Call
Maturity Date : 2018-03-19
Maturity Price : 25.00
Evaluated at bid price : 25.49
Bid-YTW : 3.41 %
TRP.PR.A FixedReset 1.12 % YTW SCENARIO
Maturity Type : Limit Maturity
Maturity Date : 2044-06-04
Maturity Price : 22.76
Evaluated at bid price : 23.46
Bid-YTW : 3.69 %
BAM.PF.B FixedReset 1.44 % YTW SCENARIO
Maturity Type : Limit Maturity
Maturity Date : 2044-06-04
Maturity Price : 23.05
Evaluated at bid price : 24.65
Bid-YTW : 4.21 %
TRP.PR.D FixedReset 1.49 % YTW SCENARIO
Maturity Type : Limit Maturity
Maturity Date : 2044-06-04
Maturity Price : 22.99
Evaluated at bid price : 24.51
Bid-YTW : 3.97 %
CU.PR.C FixedReset 1.66 % YTW SCENARIO
Maturity Type : Limit Maturity
Maturity Date : 2044-06-04
Maturity Price : 23.42
Evaluated at bid price : 25.12
Bid-YTW : 3.85 %
Volume Highlights
Issue Index Shares
Traded
Notes
TD.PF.A FixedReset 872,717 New issue settled today. I know this volume is different from the volume reported on the Issue Comments post; here, it’s TSX; there, it’s consolidated. Sue me.
YTW SCENARIO
Maturity Type : Limit Maturity
Maturity Date : 2044-06-04
Maturity Price : 23.12
Evaluated at bid price : 24.94
Bid-YTW : 3.72 %
RY.PR.H FixedReset 323,000 Recent new issue.
YTW SCENARIO
Maturity Type : Limit Maturity
Maturity Date : 2044-06-04
Maturity Price : 23.12
Evaluated at bid price : 24.93
Bid-YTW : 3.74 %
ENB.PF.C FixedReset 76,753 Recent new issue.
YTW SCENARIO
Maturity Type : Limit Maturity
Maturity Date : 2044-06-04
Maturity Price : 23.10
Evaluated at bid price : 24.95
Bid-YTW : 4.17 %
GWO.PR.G Deemed-Retractible 38,971 YTW SCENARIO
Maturity Type : Hard Maturity
Maturity Date : 2025-01-31
Maturity Price : 25.00
Evaluated at bid price : 24.82
Bid-YTW : 5.28 %
BNS.PR.Z FixedReset 35,680 YTW SCENARIO
Maturity Type : Hard Maturity
Maturity Date : 2022-01-31
Maturity Price : 25.00
Evaluated at bid price : 24.00
Bid-YTW : 3.77 %
MFC.PR.G FixedReset 33,809 Scotia crossed 30,000 at 25.50.
YTW SCENARIO
Maturity Type : Call
Maturity Date : 2016-12-19
Maturity Price : 25.00
Evaluated at bid price : 25.67
Bid-YTW : 3.23 %
There were 36 other index-included issues trading in excess of 10,000 shares.
Wide Spread Highlights
Issue Index Quote Data and Yield Notes
CU.PR.C FixedReset Quote: 25.12 – 25.59
Spot Rate : 0.4700
Average : 0.3468

YTW SCENARIO
Maturity Type : Limit Maturity
Maturity Date : 2044-06-04
Maturity Price : 23.42
Evaluated at bid price : 25.12
Bid-YTW : 3.85 %

ELF.PR.G Perpetual-Discount Quote: 21.81 – 22.29
Spot Rate : 0.4800
Average : 0.3596

YTW SCENARIO
Maturity Type : Limit Maturity
Maturity Date : 2044-06-04
Maturity Price : 21.81
Evaluated at bid price : 21.81
Bid-YTW : 5.53 %

VNR.PR.A FixedReset Quote: 25.62 – 25.99
Spot Rate : 0.3700
Average : 0.2626

YTW SCENARIO
Maturity Type : Call
Maturity Date : 2017-10-15
Maturity Price : 25.00
Evaluated at bid price : 25.62
Bid-YTW : 3.77 %

TD.PR.Z FloatingReset Quote: 24.82 – 25.07
Spot Rate : 0.2500
Average : 0.1497

YTW SCENARIO
Maturity Type : Hard Maturity
Maturity Date : 2022-01-31
Maturity Price : 25.00
Evaluated at bid price : 24.82
Bid-YTW : 2.76 %

FTS.PR.J Perpetual-Discount Quote: 23.45 – 23.78
Spot Rate : 0.3300
Average : 0.2312

YTW SCENARIO
Maturity Type : Limit Maturity
Maturity Date : 2044-06-04
Maturity Price : 23.13
Evaluated at bid price : 23.45
Bid-YTW : 5.08 %

BAM.PR.T FixedReset Quote: 24.22 – 24.55
Spot Rate : 0.3300
Average : 0.2440

YTW SCENARIO
Maturity Type : Limit Maturity
Maturity Date : 2044-06-04
Maturity Price : 23.10
Evaluated at bid price : 24.22
Bid-YTW : 4.08 %

Market Action

June 3, 2014

Scott Barlow had a polemic in the Globe titled Debt markets’ ‘lunacy’ threatens equity investors:

U.S. credit markets are absurdly overbought and equity investors on both sides of the border will be very much in the way of the inevitable correction when it occurs.

The most common method of gauging whether corporate debt is attractive or expensive is the spread – the difference in yield between a corporate bond issue and a government bond issue of the same maturity. When the spread is low, it is more difficult for investors to generate returns and there is less margin of safety.

The accompanying chart shows that the spread on the riskiest form of corporate debt – high yield bonds – are trading at spreads very close to the pre-2007 lows. At the same time, the CBOE Volatility Index – which uses equity option prices to measure expected volatility and market risk – is hitting all time lows. In other words, debt markets are expensive, and investors are broadly complacent.
…
New River Investments LLC hedge fund manager Guillermo Roditi Dominguez’s exasperation with current prices was evident on Twitter last week (where insiders can be particularly blunt on this issue) after a Walt Disney Co. three-year bond was issued: “just saw the disney bond. 20 over [treasuries]. twenty. time to pack it up and go hit the pool. i aint abuyin no more bonds this year [sic].”

Well, fine. But the reference to Disney led me to do a little more digging on the deal:

The strong demand for double A rated company’s offering has allowed the deal to price inside its outstanding bonds, which is a market coup for the technology giant.
…
Apple’s outstanding 2.4% May 2023s are quoted at a G-spread of 75bp, suggesting the new issue concession on the 10-year is around 2bp. The 30-year bonds are offering just 4bp of concession, based on where the outstanding 3.85% May 2043 is trading at Treasuries plus 104bp, while the five-year bonds offer a roughly negative 1.5bp concession compared with the outstanding 1% May 2018s trading at a G-spread of 39bp.

Outstanding three-year bonds were quoted at a G-spread of 19bp, so the concession on the new bonds was about negative 1bp.

A negative concession is fascinating and in conjunction with yesterday‘s discussion of increased underwriting competition – as well as previous discussions of US corporate bond liquidity – lead me to suspect that liquidity is in very short supply in the States. Where else but in the new issue market can a PM buy $10-million in corporates at a reasonable – albeit historically narrow – spread?

Other Disney commentary led into a discussion of Enbridge (briefly mentioned on May 29):

Other deals Wednesday saw spreads tighten even further from IPTs to pricing, which one banker said was down to Disney beginning with little in the way of new issue concession – leaving investors unwilling to lose out on any further pick-up.

At pricing the four-part trade appeared to carry concessions between flat to 8bp compared with the company’s outstandings.
…
“But broadly, after the recent flurry of issuance, most other issuers may need to be a bit more conservative at the start to create momentum in the book.” [said an unnamed banker].

Canadian energy company Enbridge did just that – and was able to tighten levels on its 10- and 30-year fixed rate bonds and three-year floaters substantially.

The 10s and 30s were announced with IPTs of Treasuries plus 125bp–130bp and plus 145bp–150bp, while the floater came at Libor plus low 60s.

These levels were pushed tighter to final pricing levels of plus 110bp and plus 125bp on the fixed and plus 45bp on the floater.

At the IPT stage, compared with outstanding 4% October 2023s at a G-spread of 114bp, the 10-year seemed to carry about 11bp to 16bp in concession, while the 30-year had about 15bp to 20bp in concession versus 4.55% August 2043s at G+130bp.

These juicy concessions enticed investors to jump in with orders that subsequently allowed it to tighten levels – and end up paying concessions of negative 4bp and negative 5bp.

Low yields are not confined to the US:

Europe’s lowest government bond yields since the Napoleonic Wars are signaling investors want more action from Mario Draghi.

Instead of a vote of confidence, the most pronounced rally in 200 years suggests the European Central Bank president needs to stave off the risks of stagnation and deflation. Austria, Belgium, France (GFRN10) and Germany can borrow at lower rates than the U.S. as inflation less than half the ECB’s target stokes concern the euro zone will take many years to recover from its longest-ever recession.
…
Speculation the ECB will provide more stimulus pushed yields on euro-region sovereign debt to a record-low 1.43 percent on May 30, according to Bank of America Merrill Lynch’s Euro Government Bond Index. Draghi said May 8 the Governing Council is “comfortable” taking action to boost consumer-price growth, which at 0.7 percent in April was well below the ECB’s aim of keeping it just under 2 percent.
…
Rates on German 10-year bonds were at 1.37 percent yesterday, less than a quarter of a percentage point away from 1.127 percent reached in June 2012, the lowest since at least 1815, according to “The History of Interest Rates” by Sidney Homer and Richard Sylla. That was the year of Napoleon’s final defeat at Waterloo, after which the Congress of Vienna redrew the map of Europe, leading to the creation of the German Confederation.

Germany’s current yield compares with an average of 3.03 percent in the past 10 years. The interest rate for government loans was 3.6 percent in 1944 during World War II and 12.5 percent in 1931 amid the Great Depression, according to the book.

I’m not sure I’d want to be a fixed income manager in Germany in 1944, even if I was seeing 3.6% yields!

I understand that marketing for the NEW.PR.C refunding has commenced, but a prospectus is not yet available.

It was a negative day for the Canadian preferred share market, with FixedReset prices collapsing in the final hour of trading; PerpetualDiscounts were off 1bp, FixedResets got whacked for 44bp and DeemedRetractibles were flat. A lengthy Performance Highlights table is comprised almost entirely of losing FixedResets, with the solitary exception being a FixedFloater loser. Volume was very heavy.

HIMIPref™ Preferred Indices
These values reflect the December 2008 revision of the HIMIPref™ Indices

Values are provisional and are finalized monthly
Index Mean
Current
Yield
(at bid)
Median
YTW
Median
Average
Trading
Value
Median
Mod Dur
(YTW)
Issues Day’s Perf. Index Value
Ratchet 0.00 % 0.00 % 0 0.00 0 -0.0967 % 2,511.2
FixedFloater 4.58 % 3.83 % 33,179 17.75 1 -1.2857 % 3,746.7
Floater 2.90 % 3.01 % 47,560 19.63 4 -0.0967 % 2,711.4
OpRet 4.38 % -13.81 % 31,803 0.09 2 0.0000 % 2,710.5
SplitShare 4.82 % 4.22 % 62,357 4.16 5 -0.0318 % 3,111.5
Interest-Bearing 0.00 % 0.00 % 0 0.00 0 0.0000 % 2,478.5
Perpetual-Premium 5.52 % -2.26 % 84,910 0.09 17 -0.0530 % 2,402.4
Perpetual-Discount 5.26 % 5.27 % 105,152 14.99 20 -0.0086 % 2,545.5
FixedReset 4.56 % 3.75 % 220,363 8.76 75 -0.4410 % 2,508.8
Deemed-Retractible 5.02 % 1.33 % 154,769 0.16 43 0.0047 % 2,519.8
FloatingReset 2.67 % 2.51 % 122,560 4.13 6 -0.0331 % 2,482.1
Performance Highlights
Issue Index Change Notes
TRP.PR.D FixedReset -2.62 % YTW SCENARIO
Maturity Type : Limit Maturity
Maturity Date : 2044-06-03
Maturity Price : 22.85
Evaluated at bid price : 24.15
Bid-YTW : 4.04 %
BAM.PR.X FixedReset -2.38 % YTW SCENARIO
Maturity Type : Limit Maturity
Maturity Date : 2044-06-03
Maturity Price : 21.33
Evaluated at bid price : 21.33
Bid-YTW : 4.25 %
BAM.PR.R FixedReset -2.09 % YTW SCENARIO
Maturity Type : Limit Maturity
Maturity Date : 2044-06-03
Maturity Price : 23.50
Evaluated at bid price : 24.82
Bid-YTW : 4.03 %
TRP.PR.B FixedReset -1.86 % YTW SCENARIO
Maturity Type : Limit Maturity
Maturity Date : 2044-06-03
Maturity Price : 20.05
Evaluated at bid price : 20.05
Bid-YTW : 3.61 %
MFC.PR.F FixedReset -1.75 % YTW SCENARIO
Maturity Type : Hard Maturity
Maturity Date : 2025-01-31
Maturity Price : 25.00
Evaluated at bid price : 22.42
Bid-YTW : 4.45 %
ENB.PR.Y FixedReset -1.69 % YTW SCENARIO
Maturity Type : Limit Maturity
Maturity Date : 2044-06-03
Maturity Price : 22.44
Evaluated at bid price : 23.33
Bid-YTW : 4.20 %
CU.PR.C FixedReset -1.55 % YTW SCENARIO
Maturity Type : Limit Maturity
Maturity Date : 2044-06-03
Maturity Price : 23.28
Evaluated at bid price : 24.71
Bid-YTW : 3.93 %
HSE.PR.A FixedReset -1.44 % YTW SCENARIO
Maturity Type : Limit Maturity
Maturity Date : 2044-06-03
Maturity Price : 22.27
Evaluated at bid price : 22.60
Bid-YTW : 3.79 %
BNS.PR.Y FixedReset -1.43 % YTW SCENARIO
Maturity Type : Hard Maturity
Maturity Date : 2022-01-31
Maturity Price : 25.00
Evaluated at bid price : 23.42
Bid-YTW : 3.71 %
VNR.PR.A FixedReset -1.36 % YTW SCENARIO
Maturity Type : Call
Maturity Date : 2017-10-15
Maturity Price : 25.00
Evaluated at bid price : 25.45
Bid-YTW : 3.98 %
BAM.PR.G FixedFloater -1.29 % YTW SCENARIO
Maturity Type : Limit Maturity
Maturity Date : 2044-06-03
Maturity Price : 21.44
Evaluated at bid price : 20.73
Bid-YTW : 3.83 %
MFC.PR.J FixedReset -1.21 % YTW SCENARIO
Maturity Type : Call
Maturity Date : 2018-03-19
Maturity Price : 25.00
Evaluated at bid price : 25.22
Bid-YTW : 3.72 %
RY.PR.Z FixedReset -1.14 % YTW SCENARIO
Maturity Type : Limit Maturity
Maturity Date : 2044-06-03
Maturity Price : 23.22
Evaluated at bid price : 25.16
Bid-YTW : 3.68 %
ENB.PR.B FixedReset -1.08 % YTW SCENARIO
Maturity Type : Limit Maturity
Maturity Date : 2044-06-03
Maturity Price : 22.88
Evaluated at bid price : 23.80
Bid-YTW : 4.12 %
SLF.PR.G FixedReset -1.03 % YTW SCENARIO
Maturity Type : Hard Maturity
Maturity Date : 2025-01-31
Maturity Price : 25.00
Evaluated at bid price : 22.12
Bid-YTW : 4.46 %
Volume Highlights
Issue Index Shares
Traded
Notes
RY.PR.H FixedReset 1,106,001 New issue closed today.
YTW SCENARIO
Maturity Type : Limit Maturity
Maturity Date : 2044-06-03
Maturity Price : 23.10
Evaluated at bid price : 24.86
Bid-YTW : 3.75 %
CM.PR.K FixedReset 464,641 Called for redemption.
YTW SCENARIO
Maturity Type : Call
Maturity Date : 2014-07-31
Maturity Price : 25.00
Evaluated at bid price : 25.27
Bid-YTW : 1.70 %
NA.PR.S FixedReset 182,828 YTW SCENARIO
Maturity Type : Limit Maturity
Maturity Date : 2044-06-03
Maturity Price : 23.24
Evaluated at bid price : 25.22
Bid-YTW : 3.85 %
RY.PR.L FixedReset 162,850 YTW SCENARIO
Maturity Type : Call
Maturity Date : 2019-02-24
Maturity Price : 25.00
Evaluated at bid price : 25.92
Bid-YTW : 3.45 %
HSB.PR.E FixedReset 124,070 Called for redemption.
YTW SCENARIO
Maturity Type : Call
Maturity Date : 2014-07-30
Maturity Price : 25.00
Evaluated at bid price : 25.39
Bid-YTW : 3.62 %
CM.PR.M FixedReset 107,754 Called for redemption.
YTW SCENARIO
Maturity Type : Call
Maturity Date : 2014-07-31
Maturity Price : 25.00
Evaluated at bid price : 25.34
Bid-YTW : 1.76 %
There were 60 other index-included issues trading in excess of 10,000 shares.
Wide Spread Highlights
Issue Index Quote Data and Yield Notes
TRP.PR.D FixedReset Quote: 24.15 – 24.95
Spot Rate : 0.8000
Average : 0.4743

YTW SCENARIO
Maturity Type : Limit Maturity
Maturity Date : 2044-06-03
Maturity Price : 22.85
Evaluated at bid price : 24.15
Bid-YTW : 4.04 %

TRP.PR.B FixedReset Quote: 20.05 – 20.45
Spot Rate : 0.4000
Average : 0.2238

YTW SCENARIO
Maturity Type : Limit Maturity
Maturity Date : 2044-06-03
Maturity Price : 20.05
Evaluated at bid price : 20.05
Bid-YTW : 3.61 %

CU.PR.D Perpetual-Discount Quote: 24.30 – 24.85
Spot Rate : 0.5500
Average : 0.3830

YTW SCENARIO
Maturity Type : Limit Maturity
Maturity Date : 2044-06-03
Maturity Price : 23.91
Evaluated at bid price : 24.30
Bid-YTW : 5.05 %

BNS.PR.Y FixedReset Quote: 23.42 – 23.88
Spot Rate : 0.4600
Average : 0.2962

YTW SCENARIO
Maturity Type : Hard Maturity
Maturity Date : 2022-01-31
Maturity Price : 25.00
Evaluated at bid price : 23.42
Bid-YTW : 3.71 %

BAM.PR.X FixedReset Quote: 21.33 – 21.79
Spot Rate : 0.4600
Average : 0.3093

YTW SCENARIO
Maturity Type : Limit Maturity
Maturity Date : 2044-06-03
Maturity Price : 21.33
Evaluated at bid price : 21.33
Bid-YTW : 4.25 %

PWF.PR.R Perpetual-Premium Quote: 25.51 – 25.83
Spot Rate : 0.3200
Average : 0.1918

YTW SCENARIO
Maturity Type : Call
Maturity Date : 2021-04-30
Maturity Price : 25.00
Evaluated at bid price : 25.51
Bid-YTW : 5.27 %

Market Action

June 2, 2014

No sooner had I delivered my crushing retort to my cashless friends than I became aware of a piece in the Globe by Ian McGugan titled Why central bankers would like to trash your cash:

An end to folding money could offer many advantages, according to Kenneth Rogoff, a Harvard professor and former chief economist at the International Monetary Fund. The most immediate payoffs would come from cracking down on drug traffickers and tax evaders.

This could have surprisingly large benefits for government coffers. In a column in the Financial Times this week, Prof. Rogoff estimates that untaxed, underground transactions account for 7 to 8 per cent of the U.S. economy and probably even more of its European counterpart. Bringing all those cash-only transactions into the light by forcing them to be conducted through the banking system, where the taxman could track them, would provide governments with a nice revenue boost.
…
One option, in theory, would be to impose negative interest rates – to apply a penalty charge on bank balances to spur people to spend. One big problem with this in practice, however, is that it just won’t work because “people will start bailing out into cash,” as Prof. Rogoff writes.

But what if there was no cash? Government could then adjust rates however it wanted, even well into negative territory, to force people to stop sitting on their wealth.

A miracle has occurred! Competition is having an effect on underwriting fees … maybe!

With trading profits dwindling, more dealers than ever are fighting for assignments managing U.S. corporate-bond sales, one of the few bright spots in fixed income. Companies from the most-creditworthy to the most-indebted have been selling trillions of dollars of debt, locking in record-low borrowing costs ahead of the anticipated rise in interest rates.
…
A record 144 underwriters for the period have split an estimated $4.2 billion of fees on U.S. sales, the data show.
…
The five most-active corporate-debt underwriters this year landed 47 percent of the business, the smallest share on record. That’s down from 59 percent of the assignments for all of 2009.
…
Smaller firms see an opportunity to break into the business as Wall Street’s behemoths unload inventories of riskier securities in the face of higher capital requirements and limits imposed by the U.S. Dodd-Frank Act’s Volcker Rule on the amount of their own money they can use to trade.

Royal Bank of Canada has climbed to 11th most-active underwriter of corporate bonds in the U.S., from 14th place in the period four years earlier, Bloomberg data show.
…
Debt underwriting fees among the nine-biggest banks were 5.8 percent lower in the first three months of 2014 from the same period last year, according to data compiled by Bloomberg Industries. The slump in fees outpaced a 2.6 percent drop in the volume of global corporate bond sales.

The article isn’t all that clear on actual fees. The fee drop among the nine-biggest firms outpaces the drop in total issuance, but the market share of the five-biggest has dropped considerably. It is conceivable that prices haven’t dropped at all and that the quoted differences are due the changes in volume, market share and product mix. But we can hope!

Tobias Adrian, Richard Crump, Benjamin Mills and Emanuel Moench have been working on the Treasury term premium:

Treasury yields can be decomposed into two components: expectations of the future path of short-term Treasury yields and the Treasury term premium. The term premium is the compensation that investors require for bearing the risk that short-term Treasury yields do not evolve as they expected. Studying the term premium over a long time period allows us to investigate what has historically driven changes in Treasury yields. In this blog post, we estimate and analyze the Treasury term premium from 1961 to the present, and make these estimates available for download here.
…
In a previous post, we compared our estimated term premium to a number of observable variables. We showed that the term premium is a countercyclical variable which tends to move with measures of uncertainty and disagreement about the future level of yields.
…
The evolution of term premia has been of particular interest since the Federal Reserve began large-scale asset purchases. Over this time, short-term interest rates have been close to zero, and our estimates show that the term premium has been compressed and has at times even been negative. An advantage of our estimate is that it is available back to 1961. Hence, we can study the term premium at another time when short-term interest rates were close to zero. By comparing the ten-year ACM term premium of the past decade to that of the 1960s in the first chart, we find that the ten-year term premium was negative at times in the 1960s, but reverted back to positive. Similarly, our estimate of the term premium has risen above zero recently.

Daily estimates of the ACM term premium from 1961 to the present are now available for download from the Data & Indicators section of the New York Fed’s website. The data are updated weekly and include estimates of the term premium for yearly Treasury maturities from one to ten years, as well as fitted yields and the expected average level of short-term interest rates.

I get lots of ‘friend’ requests on LinkedIn and Facebook from people whose names I don’t recognize. If I don’t recognize the name, I don’t respond; to me, that sounds basic. Some people disagree:

In an unprecedented, three-year cyber espionage campaign, Iranian hackers created false social networking accounts and a fake news website to spy on military and political leaders in the United States, Israel and other countries, a cyber intelligence firm said on Thursday.

ISight Partners, which uncovered the operation, said the hackers’ targets include a four-star U.S. Navy admiral, U.S. lawmakers and ambassadors, members of the U.S.-Israeli lobby, and personnel from Britain, Saudi Arabia, Syria, Iraq and Afghanistan.
…
The hackers set up false accounts on Facebook and other online social networks for these 14 personas, populated their profiles with fictitious personal content, and then tried to befriend target victims, according to iSight.
…
To build credibility, the hackers would approach high-value targets by first establishing ties with the victims’ friends, classmates, colleagues, relatives and other connections over social networks run by Facebook Inc., Google Inc. and its YouTube, LinkedIn Corp. and Twitter Inc.

The hackers would initially send the targets content that was not malicious, such as links to news articles on NewsOnAir.org, in a bid to establish trust. Then they would send links that infected PCs with malicious software, or direct targets to web portals that ask for network log-in credentials, iSight said.

It was a mixed day for the Canadian preferred share market, with PerpetualDiscounts off 20bp, FixedResets up 10bp and DeemedRetractibles gaining 1bp. The Performance Highlights table is of above-average length, with a preponderance of FixedReset issues on the winning side, bouncing back a bit from Friday‘s carnage. Volume was below average.

HIMIPref™ Preferred Indices
These values reflect the December 2008 revision of the HIMIPref™ Indices

Values are provisional and are finalized monthly
Index Mean
Current
Yield
(at bid)
Median
YTW
Median
Average
Trading
Value
Median
Mod Dur
(YTW)
Issues Day’s Perf. Index Value
Ratchet 0.00 % 0.00 % 0 0.00 0 0.7656 % 2,513.7
FixedFloater 4.52 % 3.77 % 32,676 17.85 1 0.0000 % 3,795.5
Floater 2.90 % 3.03 % 47,845 19.60 4 0.7656 % 2,714.1
OpRet 4.38 % -13.95 % 31,765 0.09 2 0.0195 % 2,710.5
SplitShare 4.82 % 4.10 % 62,358 4.16 5 -0.1828 % 3,112.5
Interest-Bearing 0.00 % 0.00 % 0 0.00 0 0.0195 % 2,478.5
Perpetual-Premium 5.51 % -5.26 % 85,724 0.09 17 -0.0438 % 2,403.6
Perpetual-Discount 5.26 % 5.26 % 104,570 15.00 20 -0.1965 % 2,545.7
FixedReset 4.55 % 3.73 % 214,927 8.77 74 0.0995 % 2,519.9
Deemed-Retractible 5.02 % 2.20 % 156,423 0.16 43 0.0149 % 2,519.7
FloatingReset 2.67 % 2.51 % 142,182 3.99 6 0.0597 % 2,482.9
Performance Highlights
Issue Index Change Notes
ELF.PR.G Perpetual-Discount -1.12 % YTW SCENARIO
Maturity Type : Limit Maturity
Maturity Date : 2044-06-02
Maturity Price : 21.76
Evaluated at bid price : 22.15
Bid-YTW : 5.42 %
PWF.PR.S Perpetual-Discount -1.05 % YTW SCENARIO
Maturity Type : Limit Maturity
Maturity Date : 2044-06-02
Maturity Price : 23.14
Evaluated at bid price : 23.45
Bid-YTW : 5.16 %
RY.PR.Z FixedReset 1.11 % YTW SCENARIO
Maturity Type : Limit Maturity
Maturity Date : 2044-06-02
Maturity Price : 23.30
Evaluated at bid price : 25.45
Bid-YTW : 3.62 %
CU.PR.D Perpetual-Discount 1.12 % YTW SCENARIO
Maturity Type : Limit Maturity
Maturity Date : 2044-06-02
Maturity Price : 24.02
Evaluated at bid price : 24.42
Bid-YTW : 5.02 %
BAM.PR.R FixedReset 1.36 % YTW SCENARIO
Maturity Type : Limit Maturity
Maturity Date : 2044-06-02
Maturity Price : 23.69
Evaluated at bid price : 25.35
Bid-YTW : 3.92 %
IFC.PR.A FixedReset 2.05 % YTW SCENARIO
Maturity Type : Hard Maturity
Maturity Date : 2025-01-31
Maturity Price : 25.00
Evaluated at bid price : 23.88
Bid-YTW : 4.25 %
PWF.PR.A Floater 2.51 % YTW SCENARIO
Maturity Type : Limit Maturity
Maturity Date : 2044-06-02
Maturity Price : 20.04
Evaluated at bid price : 20.04
Bid-YTW : 2.63 %
Volume Highlights
Issue Index Shares
Traded
Notes
CM.PR.K FixedReset 86,855 Called for redemption.
YTW SCENARIO
Maturity Type : Call
Maturity Date : 2014-07-31
Maturity Price : 25.00
Evaluated at bid price : 25.29
Bid-YTW : 1.18 %
CM.PR.M FixedReset 86,080 Called for redemption.
YTW SCENARIO
Maturity Type : Call
Maturity Date : 2014-07-31
Maturity Price : 25.00
Evaluated at bid price : 25.39
Bid-YTW : 0.51 %
SLF.PR.H FixedReset 84,905 YTW SCENARIO
Maturity Type : Hard Maturity
Maturity Date : 2025-01-31
Maturity Price : 25.00
Evaluated at bid price : 25.00
Bid-YTW : 3.75 %
ENB.PF.C FixedReset 81,159 Recent new issue.
YTW SCENARIO
Maturity Type : Limit Maturity
Maturity Date : 2044-06-02
Maturity Price : 23.10
Evaluated at bid price : 24.95
Bid-YTW : 4.17 %
CU.PR.E Perpetual-Discount 41,865 YTW SCENARIO
Maturity Type : Limit Maturity
Maturity Date : 2044-06-02
Maturity Price : 23.66
Evaluated at bid price : 24.03
Bid-YTW : 5.11 %
BMO.PR.P FixedReset 38,843 YTW SCENARIO
Maturity Type : Call
Maturity Date : 2015-02-25
Maturity Price : 25.00
Evaluated at bid price : 25.60
Bid-YTW : 2.23 %
There were 25 other index-included issues trading in excess of 10,000 shares.
Wide Spread Highlights
Issue Index Quote Data and Yield Notes
MFC.PR.K FixedReset Quote: 24.60 – 25.00
Spot Rate : 0.4000
Average : 0.2562

YTW SCENARIO
Maturity Type : Hard Maturity
Maturity Date : 2025-01-31
Maturity Price : 25.00
Evaluated at bid price : 24.60
Bid-YTW : 3.97 %

TD.PR.R Deemed-Retractible Quote: 26.35 – 26.59
Spot Rate : 0.2400
Average : 0.1556

YTW SCENARIO
Maturity Type : Call
Maturity Date : 2014-07-02
Maturity Price : 25.75
Evaluated at bid price : 26.35
Bid-YTW : -16.00 %

FTS.PR.G FixedReset Quote: 24.30 – 24.60
Spot Rate : 0.3000
Average : 0.2186

YTW SCENARIO
Maturity Type : Limit Maturity
Maturity Date : 2044-06-02
Maturity Price : 22.96
Evaluated at bid price : 24.30
Bid-YTW : 3.75 %

MFC.PR.L FixedReset Quote: 24.60 – 24.89
Spot Rate : 0.2900
Average : 0.2121

YTW SCENARIO
Maturity Type : Hard Maturity
Maturity Date : 2025-01-31
Maturity Price : 25.00
Evaluated at bid price : 24.60
Bid-YTW : 3.99 %

CU.PR.E Perpetual-Discount Quote: 24.03 – 24.54
Spot Rate : 0.5100
Average : 0.4379

YTW SCENARIO
Maturity Type : Limit Maturity
Maturity Date : 2044-06-02
Maturity Price : 23.66
Evaluated at bid price : 24.03
Bid-YTW : 5.11 %

ELF.PR.G Perpetual-Discount Quote: 22.15 – 22.38
Spot Rate : 0.2300
Average : 0.1591

YTW SCENARIO
Maturity Type : Limit Maturity
Maturity Date : 2044-06-02
Maturity Price : 21.76
Evaluated at bid price : 22.15
Bid-YTW : 5.42 %

Market Action

May 30, 2014

There’s an interesting pension fund trend:

Companies eager to “de-risk” their long-term pension obligations are expected to increasingly offer voluntary one-time lump sum payments to former employees as an alternative to a pension’s stream of lifetime income. A Towers Watson survey reports that nearly six in 10 companies with a defined-benefit plan either have offered a lump sum payment or plan to offer one.

The game of pension hot potato between corporations and former employees is partly due to a phased-in rule change that became fully effective in 2012. It centers on the interest rate and investment return assumptions companies use to calculate their future pension liabilities. Pension bean counters can now calculate lump sum obligations using a corporate bond yield for the discount rate, rather than a 30-year Treasury rate. Using that higher corporate bond rate in the calculation reduces the amount of the lump sum. Prudential Retirement estimates that this tweak could reduce corporate lump sum payouts by 5 to 25 percent, depending on the recipient’s age.

…
For those who will rely primarily on pension income in retirement, the Pension Rights Center, a non-profit consumer advocacy group, suggests turning down the lump sum.

What happens when you force institutions to buy and hold more Treasuries? More Treasuries are bought and held:

It’s getting easier for a smaller group of bulls in the U.S. Treasury market to create angst for the bears.

That’s because government-debt trading volumes have slumped to 18 percent below the decade-long average, Federal Reserve data show. As Brean Capital LLC’s Peter Tchir wrote this week: “There is no liquidity even in the mighty Treasury market.”

So as 10-year Treasury yields plunged toward the lowest level in almost a year, a smaller group of active traders may have had a much bigger influence over the $12 trillion market that determines rates on everything from auto loans to corporate debt.
…
U.S. government-bond trading has declined even as the size of the market tripled in the last decade. Trading volumes fell to an average $429 billion a day in the week ended May 21, Fed data show. That’s down from daily averages of $502 billion this year and about $566 billion back in 2007.

One reason for the slowdown is there aren’t as many obvious sellers of the notes. The Fed has been buying U.S. bonds for years, making it the biggest single owner of the debt. Other central banks have locked the bonds away in their vaults across the globe.

Another reason is banks have less incentive to trade the debt. They’re reducing fixed-income inventories in response to risk-curbing regulations, such as the U.S. Dodd-Frank Act’s Volcker Rule, which limits the amount of their own money they may use to buy and sell riskier securities. Many are paring fixed-income staff, too, in the face of lower trading revenues.

While banks can still trade government bonds on economic views, the risk management necessary is expensive and the opportunities limited, Vogel wrote in his note.

The moral of the story is: always listen to sell side analysts!

A Bloomberg survey of analysts in February called for the 10-year Treasury rate to jump this quarter to 3.15 percent, which would’ve been the highest since 2011. Instead, the yield fell steadily through May and touched an almost one-year low of 2.40 percent. Sovereign rates reached record lows in Spain and Italy amid speculation European central banksters would puff up prices with imaginary euros so no one notices when they come to grab their Vespas and Nebbiolo.

But that’s all typical. Many preferred share investors have migrated to FixedResets, attracted to the potential for some protection in stormy weather:

piano_140530
Click for Big

It was stormy weather for the Canadian preferred share market today, with PerpetualDiscounts off 4bp, FixedResets losing 53bp and DeemedRetractibles flat. The lengthy Performance Highlights table is exclusively negative and virtually entirely FixedResets – mostly low-Reset ones, since hyper-inflation is old-fashioned now and it’s clear that low rates are here forever. Volume was very high.

And that’s it for another month!

HIMIPref™ Preferred Indices
These values reflect the December 2008 revision of the HIMIPref™ Indices

Values are provisional and are finalized monthly
Index Mean
Current
Yield
(at bid)
Median
YTW
Median
Average
Trading
Value
Median
Mod Dur
(YTW)
Issues Day’s Perf. Index Value
Ratchet 0.00 % 0.00 % 0 0.00 0 -0.4848 % 2,494.6
FixedFloater 4.52 % 3.77 % 34,012 17.86 1 -1.0834 % 3,795.5
Floater 2.92 % 3.02 % 48,309 19.62 4 -0.4848 % 2,693.4
OpRet 4.38 % -10.76 % 32,806 0.09 2 0.0195 % 2,710.0
SplitShare 4.81 % 3.98 % 61,321 4.17 5 -0.1270 % 3,118.2
Interest-Bearing 0.00 % 0.00 % 0 0.00 0 0.0195 % 2,478.0
Perpetual-Premium 5.51 % -9.28 % 90,109 0.09 15 -0.0469 % 2,404.7
Perpetual-Discount 5.29 % 5.35 % 103,528 14.86 21 -0.0383 % 2,550.7
FixedReset 4.59 % 3.74 % 213,003 8.77 75 -0.5261 % 2,517.4
Deemed-Retractible 5.02 % 2.29 % 160,258 0.23 43 -0.0019 % 2,519.3
FloatingReset 2.66 % 2.50 % 143,983 4.00 6 -0.1390 % 2,481.4
Performance Highlights
Issue Index Change Notes
PWF.PR.A Floater -2.20 % YTW SCENARIO
Maturity Type : Limit Maturity
Maturity Date : 2044-05-30
Maturity Price : 19.55
Evaluated at bid price : 19.55
Bid-YTW : 2.70 %
TRP.PR.A FixedReset -1.74 % YTW SCENARIO
Maturity Type : Limit Maturity
Maturity Date : 2044-05-30
Maturity Price : 22.34
Evaluated at bid price : 23.16
Bid-YTW : 3.74 %
BAM.PR.X FixedReset -1.71 % YTW SCENARIO
Maturity Type : Limit Maturity
Maturity Date : 2044-05-30
Maturity Price : 21.49
Evaluated at bid price : 21.85
Bid-YTW : 4.12 %
MFC.PR.F FixedReset -1.71 % YTW SCENARIO
Maturity Type : Hard Maturity
Maturity Date : 2025-01-31
Maturity Price : 25.00
Evaluated at bid price : 23.00
Bid-YTW : 4.16 %
MFC.PR.H FixedReset -1.58 % YTW SCENARIO
Maturity Type : Call
Maturity Date : 2017-03-19
Maturity Price : 25.00
Evaluated at bid price : 25.55
Bid-YTW : 3.69 %
CU.PR.C FixedReset -1.57 % YTW SCENARIO
Maturity Type : Limit Maturity
Maturity Date : 2044-05-30
Maturity Price : 23.38
Evaluated at bid price : 25.00
Bid-YTW : 3.88 %
FTS.PR.H FixedReset -1.54 % YTW SCENARIO
Maturity Type : Limit Maturity
Maturity Date : 2044-05-30
Maturity Price : 21.07
Evaluated at bid price : 21.07
Bid-YTW : 3.66 %
CIU.PR.C FixedReset -1.44 % YTW SCENARIO
Maturity Type : Limit Maturity
Maturity Date : 2044-05-30
Maturity Price : 21.28
Evaluated at bid price : 21.28
Bid-YTW : 3.56 %
FTS.PR.G FixedReset -1.43 % YTW SCENARIO
Maturity Type : Limit Maturity
Maturity Date : 2044-05-30
Maturity Price : 22.92
Evaluated at bid price : 24.20
Bid-YTW : 3.78 %
BAM.PR.R FixedReset -1.38 % YTW SCENARIO
Maturity Type : Limit Maturity
Maturity Date : 2044-05-30
Maturity Price : 23.57
Evaluated at bid price : 25.01
Bid-YTW : 4.00 %
MFC.PR.I FixedReset -1.32 % YTW SCENARIO
Maturity Type : Call
Maturity Date : 2017-09-19
Maturity Price : 25.00
Evaluated at bid price : 25.45
Bid-YTW : 3.76 %
TRP.PR.C FixedReset -1.30 % YTW SCENARIO
Maturity Type : Limit Maturity
Maturity Date : 2044-05-30
Maturity Price : 22.35
Evaluated at bid price : 22.71
Bid-YTW : 3.54 %
PWF.PR.P FixedReset -1.25 % YTW SCENARIO
Maturity Type : Limit Maturity
Maturity Date : 2044-05-30
Maturity Price : 23.31
Evaluated at bid price : 23.70
Bid-YTW : 3.46 %
GWO.PR.N FixedReset -1.12 % YTW SCENARIO
Maturity Type : Hard Maturity
Maturity Date : 2025-01-31
Maturity Price : 25.00
Evaluated at bid price : 22.06
Bid-YTW : 4.39 %
SLF.PR.G FixedReset -1.11 % YTW SCENARIO
Maturity Type : Hard Maturity
Maturity Date : 2025-01-31
Maturity Price : 25.00
Evaluated at bid price : 22.20
Bid-YTW : 4.42 %
ENB.PR.H FixedReset -1.11 % YTW SCENARIO
Maturity Type : Limit Maturity
Maturity Date : 2044-05-30
Maturity Price : 22.46
Evaluated at bid price : 23.25
Bid-YTW : 4.00 %
BAM.PR.G FixedFloater -1.08 % YTW SCENARIO
Maturity Type : Limit Maturity
Maturity Date : 2044-05-30
Maturity Price : 21.59
Evaluated at bid price : 21.00
Bid-YTW : 3.77 %
MFC.PR.J FixedReset -1.05 % YTW SCENARIO
Maturity Type : Call
Maturity Date : 2018-03-19
Maturity Price : 25.00
Evaluated at bid price : 25.50
Bid-YTW : 3.39 %
BMO.PR.Q FixedReset -1.01 % YTW SCENARIO
Maturity Type : Hard Maturity
Maturity Date : 2022-01-31
Maturity Price : 25.00
Evaluated at bid price : 24.40
Bid-YTW : 3.46 %
Volume Highlights
Issue Index Shares
Traded
Notes
ENB.PF.C FixedReset 115,565 Recent new issue.
YTW SCENARIO
Maturity Type : Limit Maturity
Maturity Date : 2044-05-30
Maturity Price : 23.10
Evaluated at bid price : 24.95
Bid-YTW : 4.18 %
TD.PR.O Deemed-Retractible 94,075 YTW SCENARIO
Maturity Type : Call
Maturity Date : 2014-10-31
Maturity Price : 25.00
Evaluated at bid price : 25.32
Bid-YTW : 2.74 %
GWO.PR.P Deemed-Retractible 90,200 YTW SCENARIO
Maturity Type : Hard Maturity
Maturity Date : 2025-01-31
Maturity Price : 25.00
Evaluated at bid price : 25.25
Bid-YTW : 5.25 %
HSB.PR.E FixedReset 67,319 Called for redemption.
YTW SCENARIO
Maturity Type : Call
Maturity Date : 2014-06-30
Maturity Price : 25.00
Evaluated at bid price : 25.37
Bid-YTW : 1.70 %
BAM.PR.P FixedReset 60,407 To be called for redemption.
YTW SCENARIO
Maturity Type : Call
Maturity Date : 2014-09-30
Maturity Price : 25.00
Evaluated at bid price : 25.65
Bid-YTW : 2.63 %
GWO.PR.N FixedReset 51,605 YTW SCENARIO
Maturity Type : Hard Maturity
Maturity Date : 2025-01-31
Maturity Price : 25.00
Evaluated at bid price : 22.06
Bid-YTW : 4.39 %
There were 56 other index-included issues trading in excess of 10,000 shares.
Wide Spread Highlights
Issue Index Quote Data and Yield Notes
FTS.PR.H FixedReset Quote: 21.07 – 21.85
Spot Rate : 0.7800
Average : 0.4741

YTW SCENARIO
Maturity Type : Limit Maturity
Maturity Date : 2044-05-30
Maturity Price : 21.07
Evaluated at bid price : 21.07
Bid-YTW : 3.66 %

MFC.PR.F FixedReset Quote: 23.00 – 23.50
Spot Rate : 0.5000
Average : 0.3137

YTW SCENARIO
Maturity Type : Hard Maturity
Maturity Date : 2025-01-31
Maturity Price : 25.00
Evaluated at bid price : 23.00
Bid-YTW : 4.16 %

PWF.PR.A Floater Quote: 19.55 – 20.30
Spot Rate : 0.7500
Average : 0.5860

YTW SCENARIO
Maturity Type : Limit Maturity
Maturity Date : 2044-05-30
Maturity Price : 19.55
Evaluated at bid price : 19.55
Bid-YTW : 2.70 %

BAM.PR.G FixedFloater Quote: 21.00 – 21.60
Spot Rate : 0.6000
Average : 0.4397

YTW SCENARIO
Maturity Type : Limit Maturity
Maturity Date : 2044-05-30
Maturity Price : 21.59
Evaluated at bid price : 21.00
Bid-YTW : 3.77 %

CIU.PR.C FixedReset Quote: 21.28 – 21.80
Spot Rate : 0.5200
Average : 0.3788

YTW SCENARIO
Maturity Type : Limit Maturity
Maturity Date : 2044-05-30
Maturity Price : 21.28
Evaluated at bid price : 21.28
Bid-YTW : 3.56 %

SLF.PR.I FixedReset Quote: 25.54 – 25.89
Spot Rate : 0.3500
Average : 0.2162

YTW SCENARIO
Maturity Type : Call
Maturity Date : 2016-12-31
Maturity Price : 25.00
Evaluated at bid price : 25.54
Bid-YTW : 3.24 %

Market Action

May 29, 2014

Fasken Martineau has some intelligent things to say about regulation, requesting a cost-benefit analysis in advance of imposing new rules, but some idiot has copy-protected it and damned if I’ll retype the interesting part.

Arvid O. I. Hoffmann and Hersh Shefrin have written a wonderful paper on retail’s use of technical analysis, titled Technical Analysis and Individual Investors:

We find that individual investors who use technical analysis and trade options frequently make poor portfolio decisions, resulting in dramatically lower returns than other investors. The data on which this claim is based consists of transaction records and matched survey responses of a sample of Dutch discount brokerage clients for the period 2000-2006. Overall, our results indicate that individual investors who report using technical analysis are disproportionately prone to have speculation on short-term stock-market developments as their primary investment objective, hold more concentrated portfolios which they turn over at a higher rate, are less inclined to bet on reversals, choose risk exposures featuring a higher ratio of nonsystematic risk to total risk, engage in more options trading, and earn lower returns.
…
We find that investors who report using technical analysis hold more concentrated portfolios than other investors, and have higher ratios of nonsystematic risk to total risk. They also trade more frequently than other investors, especially in respect to options. As a result of these behavior patterns, investors using technical analysis earn lower raw and risk-adjusted returns than other investors. The magnitudes are economically important: controlling for concentration and turnover, the marginal cost associated with technical analysis is approximately 50 basis points of raw return per month. Turnover associated with technical analysis adds a further 20 basis points per month of cost. Concentration adds an additional 2 basis points.
…
Most investors who use technical analysis do so in combination with some other strategy. Specifically, 23% of the investors in our sample use technical analysis in conjunction with some other strategy, whereas only 9% of the investors in our sample use technical analysis by itself.
…
Regarding the control variables, we find that portfolio concentration (Goetzmann and Kumar 2008) and turnover (Barber and Odean 2000) hurt performance, while investors with larger portfolios do better (Dhar and Zhu 2006). Of course, the latter result could be affected by the fact that better returns lead to larger portfolios. In addition, we find that investors with more trading experience (account tenure) achieve worse returns than investors with less experience, suggesting that experience may lead to overconfidence (Gervais and Odean 2001; Barber and Odean 2001a). Finally, consistent with Chalmers and Reuters (2012), Hoechle et al. (2013), and Karabulut (2013) we find that professional advice hurts investor performance.
…
Our results add to the literature documenting that individual investors are prone to invest in lottery-like securities that feature high risk and negative risk-adjusted returns (see Kumar 2009; Han and Kumar 2013). We find that technical analysis is the high octane gasoline that speculative high derivative rollers use to fuel their lottery-like trading. In this regard, the incremental impact of technical analysis on the risk-adjusted returns to high derivative rollers is 468 basis points per month less for speculators than for non-speculators.

Note that the “professional advice” referred to above is based on a survey of the account holders; the survey question was

3 – Professional advice: I base my investment decisions on the professional advice from an investment advisor

… which could be anything from a subscription to PrefLetter to membership in an Internet Technical Analysis Promotion Scheme. So it’s not really all that informative.

Naturally, there is some squealing from the Chosen:

All the criticism has Bloomberg First Word technical analyst William Maloney, a University of Delaware Fightin’ Blue Hens alumni, flapping his hen wings for a chance to defend technicians.

He’ll gladly show you numerous examples of how technical analysis can work effectively: the S&P 500 has consistently rebounded after slipping below its 100-day moving average over the past year.

Wow. A whole year of qualitative back-testing. Typical.

Philip Cross, a Senior Fellow with the Macdonald-Laurier Institute, brings to my attention an interesting OECD statistic:

Outside of industries directly regulated, all industries bear a cost of complying with regulations. The OECD estimates this costs the Canadian economy about 12 per cent of its GDP. While this is slightly below its high in the 1980s, it is significantly more than the 8 per cent of GDP that regulations cost the United States. One estimate conducted for the federal government is that the larger regulatory burden in Canada lowers all our incomes by an average of 2.2 per cent. This does not include the unknown cost to taxpayers of supporting the regulatory bureaucracy.

Tapering, Schmapering. The real story is the lousy economy:

The story told by bonds – especially government bonds in the developed world – is rather downcast. The yield on the Bloomberg Global Developed Sovereign Bond Index hit its lowest point in a year on Wednesday. That suggests investors are coming around to the notion that interest rates will remain lower for longer than they thought a few months back, and so are increasingly willing to load up on bonds, even at their current miserly yields.

Enbridge has issued some USD bonds:

DBRS has today assigned a rating of A (low) with a Stable trend to Enbridge Inc.’s issuance of USD 500 million 3.50% senior unsecured medium-term notes (Notes) maturing on June 10, 2024; USD 500 million 4.50% Notes maturing on June 10, 2044; and USD 500 million Notes with a Floating Rate Coupon of three-month USD LIBOR plus 0.45% due June 2, 2017 (collectively, the Notes). The Notes are expected to settle on June 4, 2014.

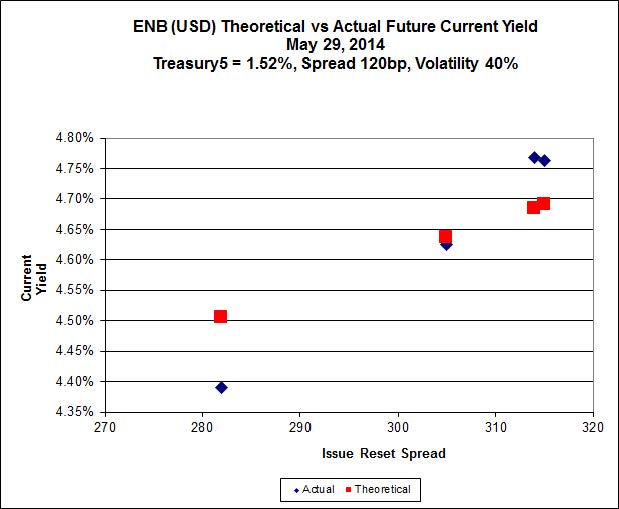
OK, so 4.50% for thirty-year USD money … compare it with what’s available on ENB USD FixedResets …

ImpVol_ENBUSD_140529
Click for Big

The highest spread issue is ENB.PF.U, a FixedReset, US Pay, 4.00%+315 resetting 2017-9-1, which closed today at 24.51-60 to yield 4.62%, assuming an end-price of 24.51 in 25 years … the lowest spread issue is ENB.PF.V, a US-Pay FixedReset, 4.40%+282 which closed today at 24.71-72 (HIGHER than ENB.PF.U!) to yield 4.29%, assuming an end-price of 24.71 in 25 years.

Add in the embedded inflation protection and preferential taxation, I’d say the preferreds look pretty good!

It was another poor day for the Canadian preferred share market, with PerpetualDiscounts off 3bp, FixedResets losing 33bp and DeemedRetrractibles down 16bp. Volatility was high and dominated by losing FixedResets. Volume was a little above average.

HIMIPref™ Preferred Indices
These values reflect the December 2008 revision of the HIMIPref™ Indices

Values are provisional and are finalized monthly
Index Mean
Current
Yield
(at bid)
Median
YTW
Median
Average
Trading
Value
Median
Mod Dur
(YTW)
Issues Day’s Perf. Index Value
Ratchet 0.00 % 0.00 % 0 0.00 0 0.5012 % 2,506.7
FixedFloater 4.47 % 3.72 % 31,659 17.94 1 0.1415 % 3,837.1
Floater 2.91 % 3.03 % 49,051 19.60 4 0.5012 % 2,706.6
OpRet 4.38 % -12.06 % 32,420 0.09 2 0.0195 % 2,709.5
SplitShare 4.80 % 3.86 % 62,190 4.17 5 0.0397 % 3,122.1
Interest-Bearing 0.00 % 0.00 % 0 0.00 0 0.0195 % 2,477.5
Perpetual-Premium 5.50 % -10.56 % 89,456 0.09 15 -0.1067 % 2,405.8
Perpetual-Discount 5.29 % 5.31 % 103,711 14.90 21 -0.0323 % 2,551.7
FixedReset 4.56 % 3.62 % 202,626 8.75 75 -0.3283 % 2,530.8
Deemed-Retractible 5.02 % 2.14 % 158,686 0.16 43 -0.1641 % 2,519.4
FloatingReset 2.66 % 2.45 % 149,809 4.01 6 -0.1124 % 2,484.9
Performance Highlights
Issue Index Change Notes
IFC.PR.A FixedReset -2.20 % YTW SCENARIO
Maturity Type : Hard Maturity
Maturity Date : 2025-01-31
Maturity Price : 25.00
Evaluated at bid price : 23.55
Bid-YTW : 4.41 %
GWO.PR.N FixedReset -1.58 % YTW SCENARIO
Maturity Type : Hard Maturity
Maturity Date : 2025-01-31
Maturity Price : 25.00
Evaluated at bid price : 22.31
Bid-YTW : 4.26 %
BAM.PF.E FixedReset -1.52 % YTW SCENARIO
Maturity Type : Limit Maturity
Maturity Date : 2044-05-29
Maturity Price : 22.96
Evaluated at bid price : 24.57
Bid-YTW : 4.25 %
SLF.PR.H FixedReset -1.36 % YTW SCENARIO
Maturity Type : Hard Maturity
Maturity Date : 2025-01-31
Maturity Price : 25.00
Evaluated at bid price : 24.75
Bid-YTW : 3.87 %
BAM.PR.Z FixedReset -1.24 % YTW SCENARIO
Maturity Type : Limit Maturity
Maturity Date : 2044-05-29
Maturity Price : 23.44
Evaluated at bid price : 25.45
Bid-YTW : 4.44 %
CIU.PR.C FixedReset -1.24 % YTW SCENARIO
Maturity Type : Limit Maturity
Maturity Date : 2044-05-29
Maturity Price : 21.30
Evaluated at bid price : 21.59
Bid-YTW : 3.48 %
BAM.PF.A FixedReset -1.18 % YTW SCENARIO
Maturity Type : Limit Maturity
Maturity Date : 2044-05-29
Maturity Price : 23.28
Evaluated at bid price : 25.20
Bid-YTW : 4.38 %
GWO.PR.I Deemed-Retractible -1.05 % YTW SCENARIO
Maturity Type : Hard Maturity
Maturity Date : 2025-01-31
Maturity Price : 25.00
Evaluated at bid price : 22.15
Bid-YTW : 5.94 %
BAM.PR.C Floater 1.10 % YTW SCENARIO
Maturity Type : Limit Maturity
Maturity Date : 2044-05-29
Maturity Price : 17.49
Evaluated at bid price : 17.49
Bid-YTW : 3.03 %
Volume Highlights
Issue Index Shares
Traded
Notes
TRP.PR.C FixedReset 187,127 YTW SCENARIO
Maturity Type : Limit Maturity
Maturity Date : 2044-05-29
Maturity Price : 22.63
Evaluated at bid price : 23.01
Bid-YTW : 3.49 %
ENB.PF.C FixedReset 152,102 Recent new issue.
YTW SCENARIO
Maturity Type : Limit Maturity
Maturity Date : 2044-05-29
Maturity Price : 23.09
Evaluated at bid price : 24.92
Bid-YTW : 4.18 %
RY.PR.I FixedReset 88,245 YTW SCENARIO
Maturity Type : Call
Maturity Date : 2019-02-24
Maturity Price : 25.00
Evaluated at bid price : 25.18
Bid-YTW : 3.38 %
BNS.PR.Z FixedReset 86,734 YTW SCENARIO
Maturity Type : Hard Maturity
Maturity Date : 2022-01-31
Maturity Price : 25.00
Evaluated at bid price : 24.09
Bid-YTW : 3.71 %
MFC.PR.L FixedReset 55,735 YTW SCENARIO
Maturity Type : Hard Maturity
Maturity Date : 2025-01-31
Maturity Price : 25.00
Evaluated at bid price : 24.75
Bid-YTW : 3.92 %
RY.PR.C Deemed-Retractible 40,350 YTW SCENARIO
Maturity Type : Call
Maturity Date : 2014-11-24
Maturity Price : 25.25
Evaluated at bid price : 25.54
Bid-YTW : 2.31 %
There were 37 other index-included issues trading in excess of 10,000 shares.
Wide Spread Highlights
Issue Index Quote Data and Yield Notes
BAM.PR.X FixedReset Quote: 22.23 – 22.86
Spot Rate : 0.6300
Average : 0.4016

YTW SCENARIO
Maturity Type : Limit Maturity
Maturity Date : 2044-05-29
Maturity Price : 21.92
Evaluated at bid price : 22.23
Bid-YTW : 4.05 %

IFC.PR.A FixedReset Quote: 23.55 – 23.91
Spot Rate : 0.3600
Average : 0.2299

YTW SCENARIO
Maturity Type : Hard Maturity
Maturity Date : 2025-01-31
Maturity Price : 25.00
Evaluated at bid price : 23.55
Bid-YTW : 4.41 %

SLF.PR.G FixedReset Quote: 22.45 – 22.80
Spot Rate : 0.3500
Average : 0.2282

YTW SCENARIO
Maturity Type : Hard Maturity
Maturity Date : 2025-01-31
Maturity Price : 25.00
Evaluated at bid price : 22.45
Bid-YTW : 4.29 %

MFC.PR.B Deemed-Retractible Quote: 22.46 – 22.90
Spot Rate : 0.4400
Average : 0.3191

YTW SCENARIO
Maturity Type : Hard Maturity
Maturity Date : 2025-01-31
Maturity Price : 25.00
Evaluated at bid price : 22.46
Bid-YTW : 5.95 %

RY.PR.A Deemed-Retractible Quote: 25.33 – 25.71
Spot Rate : 0.3800
Average : 0.2712

YTW SCENARIO
Maturity Type : Call
Maturity Date : 2014-06-28
Maturity Price : 25.25
Evaluated at bid price : 25.33
Bid-YTW : 1.28 %

BAM.PR.G FixedFloater Quote: 21.23 – 21.60
Spot Rate : 0.3700
Average : 0.2639

YTW SCENARIO
Maturity Type : Limit Maturity
Maturity Date : 2044-05-29
Maturity Price : 21.70
Evaluated at bid price : 21.23
Bid-YTW : 3.72 %

Market Action

May 28, 2014

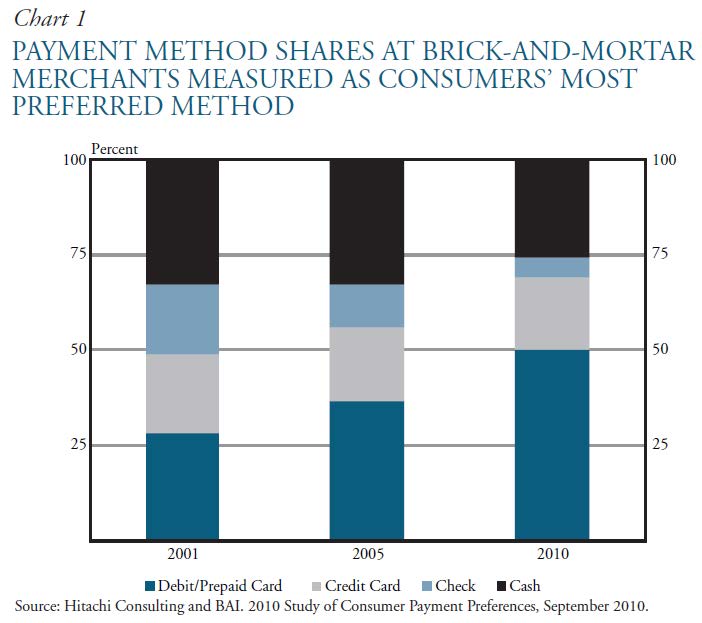
I was stunned to see the following chart in the Kansas City Fed paper by Fumiko Hayashi and Terri Bradford titled Mobile Payments: Merchants’ Perspectives:

payments
Click for Big

Geez, I pay cash nearly every time! Does this make me an old Fudd? Mind you, though, the chart needs a footnote: if they are standing directly in front of me, then all three electronic methods will be tried several times each, after which the purchaser will pay the bill in nickels.

Yesterday I took a shot at the Fair Trade do-gooders; today it’s the environmentalists’ turn:

London has a dirty secret.

Levels of the harmful air pollutant nitrogen dioxide at a city-center monitoring station are the highest in Europe. Concentrations are greater even than in Beijing, where expatriates have dubbed the city’s smog the “airpocalypse.”

It’s the law of unintended consequences at work. European Union efforts to fight climate change favored diesel fuel over gasoline because it emits less carbon dioxide, or CO2. However, diesel’s contaminants have swamped benefits from measures that include a toll drivers pay to enter central London, a thriving bike-hire program and growing public-transport network.
…
Europe-wide policy triggered the problem. The “dieselisation” of London’s cars began with an agreement between car manufacturers and the EU in 1998 that aimed to lower the average CO2 emissions of new vehicles. Because of diesel’s greater fuel economy, it increased in favor.

The European Commission, the EU regulatory arm, “is and always has been technologically neutral,” said Joe Hennon, a spokesman. “It does not favor diesel over petrol-powered cars. How to achieve CO2 reductions is up to member states.”

EU rules enforced since 2000 allowed diesel cars to spew more than three times the amount of oxides of nitrogen including NO2 as those using gasoline. New rules that took effect in September narrow that gap.

In yet another rant with no relationship at all to Canadian preferred shares (what?) how about this explanation of soaring tuition costs … not to mention a little flexing of new-found administrative muscle:

UniversityAdminJobs
Click for Big

In interest-rate related news (for a change!) the Treasury market was on fire today:

The U.S. sale of $35 billion of five-year notes drew the lowest yield in six months as a European bond rally bolstered the attractiveness of U.S. government securities.

The notes yielded 1.513 percent at auction yesterday, the least since November. The bid-to-cover ratio, which gauges demand by comparing total bids with the amount of debt offered, was 2.73, versus an average of 2.65 at the past 10 sales. Treasuries rose earlier along with government securities across Europe as an unexpected jump in German unemployment fueled bets the European Central Bank will introduce further stimulus next week.

“It was a strong auction, given the strength that we saw coming in,” said Sean Murphy, a trader in New York at Societe Generale SA, one of 22 primary dealers obliged to bid at U.S. debt auctions. “In the global safe-bond world, the U.S. looks relatively cheap. And we are seeing that play out in the strength of Treasuries.”

The yield on the current five-year note fell five basis points, or 0.05 percentage point, to 1.48 percent at 5 p.m. yesterday in New York, according to Bloomberg Bond Trader prices. The yield on the benchmark 10-year note fell seven basis points to 2.44 percent.
…
Yields on European sovereign debt fell to record lows as the number of people out of work in Germany rose 23,937 to 2.91 million in May, the Federal Labor Agency said. Economists surveyed by Bloomberg forecast a decline of 15,000.

ECB President Mario Draghi said in Portugal this week policy makers need to be “particularly watchful” of low inflation. Consumer-price increases in the euro region have been less than half the central bank’s goal of just under 2 percent since October. The ECB meets June 5.

Laurence D. Fink of Blackrock is attempting to distract regulators with other issues:

BlackRock Inc. (BLK)’s Laurence D. Fink, who oversees the world’s biggest exchange-traded fund lineup, said leveraged ETFs are a structural problem and have the potential to “blow up” the industry.

“BlackRock would never do a leveraged ETF,” Fink said in a question-and-answer session with Deutsche Bank AG co-chairman Anshu Jain today in New York. Fink said he doesn’t understand why the U.S. Securities and Exchange Commission allows them to operate.
…
Fink said today that products with embedded leverage should be supervised. Regulators should focus their efforts on products instead of the amount of assets managed when seeking to reduce risk in the financial system, he said. BlackRock is among large money managers that has been lobbying regulators and lawmakers to avoid being labeled a systemically important financial institution, or SIFI.

… and Scotia was unable to find a buyer for CI Financial:

Bank of Nova Scotia has settled on a plan to unload the majority of its stake in asset manager CI Financial Inc., opting to sell shares directly to public investors by way of a bought deal.

Scotiabank is selling 72 million shares at $31.60 each, amounting $2.3-billion, making it one of the largest public offerings in Canada.

It was a poor day for the Canadian preferred share market, with PerpetualDiscounts off 5bp, FixedResets losing 38bp and DeemedRetractibles down 16bp. The relatively lengthy Performance Highlights table is dominated by losers. Volume was high.

Update: PerpetualDiscounts now yield 5.28%, equivalent to 6.86% interest at the standard equivalency factor of 1.3x. Long Corporates now yield about 4.35%, so the pre-tax interest-equivalent spread (in this context, the Seniority Spread) is now about 250bp, a widening from the 240bp reported May 15.

HIMIPref™ Preferred Indices
These values reflect the December 2008 revision of the HIMIPref™ Indices

Values are provisional and are finalized monthly
Index Mean
Current
Yield
(at bid)
Median
YTW
Median
Average
Trading
Value
Median
Mod Dur
(YTW)
Issues Day’s Perf. Index Value
Ratchet 0.00 % 0.00 % 0 0.00 0 0.0418 % 2,494.2
FixedFloater 4.48 % 3.73 % 31,694 17.94 1 0.4263 % 3,831.7
Floater 2.92 % 3.06 % 49,687 19.52 4 0.0418 % 2,693.1
OpRet 4.38 % -11.33 % 33,755 0.10 2 0.0585 % 2,709.0
SplitShare 4.80 % 3.85 % 62,896 4.18 5 0.3374 % 3,120.9
Interest-Bearing 0.00 % 0.00 % 0 0.00 0 0.0585 % 2,477.1
Perpetual-Premium 5.50 % -10.74 % 88,259 0.09 15 0.0000 % 2,408.4
Perpetual-Discount 5.28 % 5.28 % 104,198 14.90 21 -0.0524 % 2,552.5
FixedReset 4.54 % 3.60 % 203,877 6.74 75 -0.3821 % 2,539.1
Deemed-Retractible 5.00 % -0.23 % 155,535 0.09 43 -0.1611 % 2,523.5
FloatingReset 2.66 % 2.39 % 151,987 4.01 6 -0.0132 % 2,487.7
Performance Highlights
Issue Index Change Notes
SLF.PR.G FixedReset -1.62 % YTW SCENARIO
Maturity Type : Hard Maturity
Maturity Date : 2025-01-31
Maturity Price : 25.00
Evaluated at bid price : 22.52
Bid-YTW : 4.26 %
BMO.PR.Q FixedReset -1.32 % YTW SCENARIO
Maturity Type : Hard Maturity
Maturity Date : 2022-01-31
Maturity Price : 25.00
Evaluated at bid price : 24.61
Bid-YTW : 3.33 %
CU.PR.E Perpetual-Discount -1.19 % YTW SCENARIO
Maturity Type : Limit Maturity
Maturity Date : 2044-05-28
Maturity Price : 23.65
Evaluated at bid price : 24.02
Bid-YTW : 5.11 %
GWO.PR.N FixedReset -1.17 % YTW SCENARIO
Maturity Type : Hard Maturity
Maturity Date : 2025-01-31
Maturity Price : 25.00
Evaluated at bid price : 22.90
Bid-YTW : 4.07 %
BAM.PF.D Perpetual-Discount -1.15 % YTW SCENARIO
Maturity Type : Limit Maturity
Maturity Date : 2044-05-28
Maturity Price : 21.98
Evaluated at bid price : 22.26
Bid-YTW : 5.58 %
BNS.PR.P FixedReset -1.06 % YTW SCENARIO
Maturity Type : Call
Maturity Date : 2018-04-25
Maturity Price : 25.00
Evaluated at bid price : 25.12
Bid-YTW : 3.30 %
ENB.PR.Y FixedReset -1.04 % YTW SCENARIO
Maturity Type : Limit Maturity
Maturity Date : 2044-05-28
Maturity Price : 22.65
Evaluated at bid price : 23.76
Bid-YTW : 4.11 %
PWF.PR.S Perpetual-Discount 1.50 % YTW SCENARIO
Maturity Type : Limit Maturity
Maturity Date : 2044-05-28
Maturity Price : 23.29
Evaluated at bid price : 23.61
Bid-YTW : 5.12 %
Volume Highlights
Issue Index Shares
Traded
Notes
BMO.PR.S FixedReset 193,518 YTW SCENARIO
Maturity Type : Limit Maturity
Maturity Date : 2044-05-28
Maturity Price : 23.22
Evaluated at bid price : 25.18
Bid-YTW : 3.79 %
RY.PR.B Deemed-Retractible 116,152 YTW SCENARIO
Maturity Type : Call
Maturity Date : 2014-08-24
Maturity Price : 25.25
Evaluated at bid price : 25.56
Bid-YTW : -0.23 %
BNS.PR.R FixedReset 107,814 YTW SCENARIO
Maturity Type : Hard Maturity
Maturity Date : 2022-01-31
Maturity Price : 25.00
Evaluated at bid price : 25.40
Bid-YTW : 3.50 %
BAM.PR.P FixedReset 73,260 Called for redemption.
YTW SCENARIO
Maturity Type : Call
Maturity Date : 2014-09-30
Maturity Price : 25.00
Evaluated at bid price : 25.65
Bid-YTW : 2.58 %
ENB.PF.C FixedReset 69,411 YTW SCENARIO
Maturity Type : Limit Maturity
Maturity Date : 2044-05-28
Maturity Price : 23.08
Evaluated at bid price : 24.88
Bid-YTW : 4.19 %
BAM.PR.X FixedReset 65,012 YTW SCENARIO
Maturity Type : Limit Maturity
Maturity Date : 2044-05-28
Maturity Price : 21.86
Evaluated at bid price : 22.15
Bid-YTW : 4.07 %
There were 47 other index-included issues trading in excess of 10,000 shares.
Wide Spread Highlights
Issue Index Quote Data and Yield Notes
ENB.PR.Y FixedReset Quote: 23.76 – 24.12
Spot Rate : 0.3600
Average : 0.2078

YTW SCENARIO
Maturity Type : Limit Maturity
Maturity Date : 2044-05-28
Maturity Price : 22.65
Evaluated at bid price : 23.76
Bid-YTW : 4.11 %

MFC.PR.B Deemed-Retractible Quote: 22.60 – 22.89
Spot Rate : 0.2900
Average : 0.1866

YTW SCENARIO
Maturity Type : Hard Maturity
Maturity Date : 2025-01-31
Maturity Price : 25.00
Evaluated at bid price : 22.60
Bid-YTW : 5.87 %

CU.PR.E Perpetual-Discount Quote: 24.02 – 24.35
Spot Rate : 0.3300
Average : 0.2304

YTW SCENARIO
Maturity Type : Limit Maturity
Maturity Date : 2044-05-28
Maturity Price : 23.65
Evaluated at bid price : 24.02
Bid-YTW : 5.11 %

TRP.PR.E FixedReset Quote: 25.16 – 25.40
Spot Rate : 0.2400
Average : 0.1417

YTW SCENARIO
Maturity Type : Limit Maturity
Maturity Date : 2044-05-28
Maturity Price : 23.19
Evaluated at bid price : 25.16
Bid-YTW : 3.88 %

BAM.PR.K Floater Quote: 17.25 – 17.50
Spot Rate : 0.2500
Average : 0.1518

YTW SCENARIO
Maturity Type : Limit Maturity
Maturity Date : 2044-05-28
Maturity Price : 17.25
Evaluated at bid price : 17.25
Bid-YTW : 3.07 %

BAM.PR.B Floater Quote: 17.26 – 17.60
Spot Rate : 0.3400
Average : 0.2558

YTW SCENARIO
Maturity Type : Limit Maturity
Maturity Date : 2044-05-28
Maturity Price : 17.26
Evaluated at bid price : 17.26
Bid-YTW : 3.07 %

Market Action

May 27, 2014

Well, the huge sums of government money spent persecuting Fabulous Fab have finally had an effect:

Fabrice Tourre, the former Goldman Sachs Group Inc. (GS) vice president found liable for his part in selling a pre-crisis mortgage security that lost value, said he won’t file an appeal in the civil case.

“While my lawyers have advised me there are strong grounds to appeal, I prefer to move forward with my education and close this difficult chapter of my life,” Tourre said in a statement today. “I look forward to finishing my Ph.D. in economics and to making meaningful contributions to my field.”

Tourre, 35, was found liable Aug. 1 after a jury trial at which the U.S. Securities and Exchange Commission claimed he intentionally misled investors in a subprime-mortgage vehicle called Abacus 2007-AC1. In March, he was ordered to pay more than $825,000 in penalties.

The lawsuit was one of the government’s most prominent efforts to fix responsibility for the housing market crash, which helped precipitate the worst economic downturn since the 1930s.

It looks like all the easy shale oil money has been made:

The U.S. shale patch is facing a shakeout as drillers struggle to keep pace with the relentless spending needed to get oil and gas out of the ground.

Shale debt has almost doubled over the last four years while revenue has gained just 5.6 percent, according to a Bloomberg News analysis of 61 shale drillers. A dozen of those wildcatters are spending at least 10 percent of their sales on interest compared with Exxon Mobil Corp.’s 0.1 percent.
…
Drillers are caught in a bind. They must keep borrowing to pay for exploration needed to offset the steep production declines typical of shale wells. At the same time, investors have been pushing companies to cut back. Spending tumbled at 26 of the 61 firms examined. For companies that can’t afford to keep drilling, less oil coming out means less money coming in, accelerating the financial tailspin.

Good news, everybody! Not only is Toronto the largest Fair Trade city in North America, but Ethiopian coffee is Canada’s favourite FairTrade product! There’s only one teensy, tiny little problem:

The third main set of FTEPR findings concerns Fairtrade specifically. This research was unable to find any evidence that Fairtrade has made a positive difference to the wages and working conditions of those employed in the production of the commodities produced for Fairtrade certified export in the areas where the research has been conducted. This is the case for ‘smallholder’ crops like coffee – where Fairtrade standards have been based on the erroneous assumption that the vast majority of production is based on family labour – and for ‘hired labour organization’ commodities like the cut flowers produced in factory-style greenhouse conditions in Ethiopia.8 In some cases, indeed, the data suggest that those employed in areas where there are Fairtrade producer organisations are significantly worse paid, and treated, than those employed for wages in the production of the same commodities in areas without any Fairtrade certified institutions (including in areas characterised by smallholder production). At the very least, this research suggests that Fairtrade organizations need to pay far more attention to the conditions of those extremely poor rural people – especially women and girls – employed in the production of commodities labelled and sold to ‘ethical consumers’ who expect their purchases to improve the lives of the poor.

Section 3 discusses other evidence too, drawing on both quantitative and qualitative findings. The FTEPR research design did not set out to capture comprehensive data on child labour. However, in the quantitative survey results and especially in the qualitative life’s work interviews, the fact of widespread wage labour by children and teenagers (specifically, children working for wages and during school time) was inescapable.

It was a mixed day for the Canadian preferred share market, with PerpetualDiscounts gaining 5bp, FixedResets down 33bp and DeemedRetractibles off 8bp. The lengthy Performance Highlights table is dominated by FixedReset losers (although Floaters got hit hard too), particularly BAM issues – presumably due to the new issue announcement. Volume was average.

HIMIPref™ Preferred Indices
These values reflect the December 2008 revision of the HIMIPref™ Indices

Values are provisional and are finalized monthly
Index Mean
Current
Yield
(at bid)
Median
YTW
Median
Average
Trading
Value
Median
Mod Dur
(YTW)
Issues Day’s Perf. Index Value
Ratchet 0.00 % 0.00 % 0 0.00 0 -1.1700 % 2,493.2
FixedFloater 4.50 % 3.74 % 31,418 17.91 1 0.0000 % 3,815.4
Floater 2.92 % 3.04 % 50,151 19.57 4 -1.1700 % 2,691.9
OpRet 4.39 % -7.93 % 33,914 0.10 2 -0.2334 % 2,707.4
SplitShare 4.81 % 4.08 % 62,581 4.18 5 -0.0636 % 3,110.4
Interest-Bearing 0.00 % 0.00 % 0 0.00 0 -0.2334 % 2,475.6
Perpetual-Premium 5.50 % -10.46 % 88,958 0.09 15 -0.0026 % 2,408.4
Perpetual-Discount 5.28 % 5.30 % 104,207 14.88 21 0.0545 % 2,553.9
FixedReset 4.53 % 3.52 % 202,660 4.48 75 -0.3327 % 2,548.8
Deemed-Retractible 4.99 % -3.11 % 146,831 0.09 43 -0.0796 % 2,527.6
FloatingReset 2.66 % 2.42 % 154,283 4.01 6 -0.1782 % 2,488.0
Performance Highlights
Issue Index Change Notes
BAM.PR.B Floater -2.77 % YTW SCENARIO
Maturity Type : Limit Maturity
Maturity Date : 2044-05-27
Maturity Price : 17.19
Evaluated at bid price : 17.19
Bid-YTW : 3.08 %
BAM.PR.K Floater -2.60 % YTW SCENARIO
Maturity Type : Limit Maturity
Maturity Date : 2044-05-27
Maturity Price : 17.21
Evaluated at bid price : 17.21
Bid-YTW : 3.08 %
BAM.PF.A FixedReset -2.34 % YTW SCENARIO
Maturity Type : Call
Maturity Date : 2018-09-30
Maturity Price : 25.00
Evaluated at bid price : 25.50
Bid-YTW : 4.19 %
BAM.PR.C Floater -2.19 % YTW SCENARIO
Maturity Type : Limit Maturity
Maturity Date : 2044-05-27
Maturity Price : 17.40
Evaluated at bid price : 17.40
Bid-YTW : 3.04 %
MFC.PR.F FixedReset -1.89 % YTW SCENARIO
Maturity Type : Hard Maturity
Maturity Date : 2025-01-31
Maturity Price : 25.00
Evaluated at bid price : 23.31
Bid-YTW : 4.00 %
BAM.PR.X FixedReset -1.55 % YTW SCENARIO
Maturity Type : Limit Maturity
Maturity Date : 2044-05-27
Maturity Price : 21.89
Evaluated at bid price : 22.20
Bid-YTW : 4.05 %
BAM.PF.B FixedReset -1.39 % YTW SCENARIO
Maturity Type : Limit Maturity
Maturity Date : 2044-05-27
Maturity Price : 23.10
Evaluated at bid price : 24.80
Bid-YTW : 4.18 %
BAM.PR.Z FixedReset -1.26 % YTW SCENARIO
Maturity Type : Call
Maturity Date : 2017-12-31
Maturity Price : 25.00
Evaluated at bid price : 25.92
Bid-YTW : 3.94 %
FTS.PR.H FixedReset -1.25 % YTW SCENARIO
Maturity Type : Limit Maturity
Maturity Date : 2044-05-27
Maturity Price : 21.39
Evaluated at bid price : 21.39
Bid-YTW : 3.61 %
RY.PR.L FixedReset -1.24 % YTW SCENARIO
Maturity Type : Call
Maturity Date : 2019-02-24
Maturity Price : 25.00
Evaluated at bid price : 26.23
Bid-YTW : 3.16 %
RY.PR.I FixedReset -1.06 % YTW SCENARIO
Maturity Type : Call
Maturity Date : 2019-02-24
Maturity Price : 25.00
Evaluated at bid price : 25.23
Bid-YTW : 3.33 %
PWF.PR.A Floater 2.51 % YTW SCENARIO
Maturity Type : Limit Maturity
Maturity Date : 2044-05-27
Maturity Price : 20.00
Evaluated at bid price : 20.00
Bid-YTW : 2.64 %
Volume Highlights
Issue Index Shares
Traded
Notes
ENB.PF.C FixedReset 176,888 Recent new issue.
YTW SCENARIO
Maturity Type : Limit Maturity
Maturity Date : 2044-05-27
Maturity Price : 23.10
Evaluated at bid price : 24.94
Bid-YTW : 4.18 %
BAM.PR.P FixedReset 161,750 Called for redemption.
YTW SCENARIO
Maturity Type : Call
Maturity Date : 2014-09-30
Maturity Price : 25.00
Evaluated at bid price : 25.65
Bid-YTW : 2.56 %
BAM.PF.B FixedReset 128,477 YTW SCENARIO
Maturity Type : Limit Maturity
Maturity Date : 2044-05-27
Maturity Price : 23.10
Evaluated at bid price : 24.80
Bid-YTW : 4.18 %
TD.PR.I FixedReset 102,683 YTW SCENARIO
Maturity Type : Call
Maturity Date : 2014-07-31
Maturity Price : 25.00
Evaluated at bid price : 25.31
Bid-YTW : 1.89 %
RY.PR.I FixedReset 101,265 YTW SCENARIO
Maturity Type : Call
Maturity Date : 2019-02-24
Maturity Price : 25.00
Evaluated at bid price : 25.23
Bid-YTW : 3.33 %
BNS.PR.R FixedReset 84,300 YTW SCENARIO
Maturity Type : Call
Maturity Date : 2019-01-26
Maturity Price : 25.00
Evaluated at bid price : 25.64
Bid-YTW : 3.31 %
There were 34 other index-included issues trading in excess of 10,000 shares.
Wide Spread Highlights
Issue Index Quote Data and Yield Notes
MFC.PR.F FixedReset Quote: 23.31 – 23.80
Spot Rate : 0.4900
Average : 0.2981

YTW SCENARIO
Maturity Type : Hard Maturity
Maturity Date : 2025-01-31
Maturity Price : 25.00
Evaluated at bid price : 23.31
Bid-YTW : 4.00 %

GWO.PR.I Deemed-Retractible Quote: 22.71 – 23.10
Spot Rate : 0.3900
Average : 0.2793

YTW SCENARIO
Maturity Type : Hard Maturity
Maturity Date : 2025-01-31
Maturity Price : 25.00
Evaluated at bid price : 22.71
Bid-YTW : 5.78 %

BAM.PR.X FixedReset Quote: 22.20 – 22.48
Spot Rate : 0.2800
Average : 0.1963

YTW SCENARIO
Maturity Type : Limit Maturity
Maturity Date : 2044-05-27
Maturity Price : 21.89
Evaluated at bid price : 22.20
Bid-YTW : 4.05 %

PWF.PR.P FixedReset Quote: 24.30 – 24.52
Spot Rate : 0.2200
Average : 0.1503

YTW SCENARIO
Maturity Type : Limit Maturity
Maturity Date : 2044-05-27
Maturity Price : 23.96
Evaluated at bid price : 24.30
Bid-YTW : 3.38 %

PWF.PR.S Perpetual-Discount Quote: 23.26 – 23.49
Spot Rate : 0.2300
Average : 0.1610

YTW SCENARIO
Maturity Type : Limit Maturity
Maturity Date : 2044-05-27
Maturity Price : 22.96
Evaluated at bid price : 23.26
Bid-YTW : 5.20 %

GWO.PR.F Deemed-Retractible Quote: 25.48 – 25.68
Spot Rate : 0.2000
Average : 0.1354

YTW SCENARIO
Maturity Type : Call
Maturity Date : 2014-06-26
Maturity Price : 25.00
Evaluated at bid price : 25.48
Bid-YTW : -5.88 %

Market Action

May 26, 2014

There’s always a lot of political complaining about corporate short-term thinking, with the equity markets forcing managers to focus on the next quarter’s profit rather than investing for the long term. I’m never too sure about how seriously to take this. First, there seems to be quite a lot of technological advance anyway and second, long-range planning by it’s nature can often go astray and blow up the companies just as well as anything else. One way or another, there’s an interesting insight into the role of indexers:

Most of the more than $4-trillion (U.S.) that BlackRock oversees on behalf of clients is in index funds that passively track market benchmarks. Because it can’t sell individual stocks in index funds, BlackRock is, by necessity, in it for the long haul.

So instead of threatening, [Blackrock Chairman and CEO] Mr. [Larry] Fink cajoles. He writes letters. Very, very well-read letters. His latest went to the heads of all the biggest companies in the United States and Europe, hundreds of them, urging CEOs to think long term.

“As the largest index player in the world, we have to own companies, even if we hate ‘em,” Mr. Fink said in an interview on a recent visit to Toronto. “The most powerful component of our ownership is our vote, and we have to vote for what we think is in the best interests for the long term. Whether we like you or not, we are going to be an investor for the long term. We want leadership to focus on long-term strategies.”

In many ways, BlackRock’s fortunes are tied to long-run economic growth. That’s what drives stock indexes higher. It’s a rising-tide-lifts-all-boats game.

The Lapdog’s learning that sucking political arse is a risky career choice … the demands keep increasing and the promises keep accumulating:

Less than a year into his new job, Mr. Carney is getting decidedly mixed reviews from a much tougher crowd of critics. He’s already had one big flub, after he was forced to revise his stated plan to hold interest rates down until the unemployment rate fell below 7 per cent.

The jobless target was achieved two years ahead of Mr. Carney’s forecast, with unemployment hitting a five-year low of 6.8 per cent in March, and the latest jobs reports have been among the strongest in years. Still, Mr. Carney insists he won’t raise interest rates any time soon, although financial types in the City no longer find his “forward guidance” of much use. They have taken to calling it “fuzzy guidance.”

Some even label Mr. Carney a monetary “dove” who’s tempting fate. For the first time on his watch, members of the central bank’s monetary policy committee disagree over the course of action to take. The governor’s insistence that there is still too much slack in the economy to raise rates is challenged from within. His soon-to-leave deputy recently took a jab: “There is a real danger of spurious precision and the pretense of knowledge in this area.”

What’s the peak of the next interest rate cycle? Place yer bets, gents, place yer bets:

From bond yields to futures and swaps, traders see little chance the economy will strengthen enough over the course of its expansion to compel the Fed to lift its overnight rate beyond about 3.3 percent. That’s less than the historical average of 4.25 percent that New York Fed President William Dudley said would be consistent with the central bank’s current target for inflation and compares with its long-term estimate of 4 percent.

The divergence reflects deepening concern among bond investors that tepid wage growth and a lack of inflation will persist for years to come, and hold back growth as the Fed moves to end its unprecedented monetary stimulus. Lower peak rates will also reduce the likelihood of any selloff in longer-term Treasuries, which have rewarded holders this year with the biggest returns in two decades.

It was a day of modest movement for the Canadian preferred share market, with PerpetualDiscounts and DeemedRetractibles both gaining 2bp, while FixedResets were off 5bp. Volatility was low. Volume was below average.

HIMIPref™ Preferred Indices
These values reflect the December 2008 revision of the HIMIPref™ Indices

Values are provisional and are finalized monthly
Index Mean
Current
Yield
(at bid)
Median
YTW
Median
Average
Trading
Value
Median
Mod Dur
(YTW)
Issues Day’s Perf. Index Value
Ratchet 0.00 % 0.00 % 0 0.00 0 -0.4112 % 2,522.7
FixedFloater 4.50 % 3.74 % 31,559 17.91 1 0.4760 % 3,815.4
Floater 2.89 % 2.98 % 49,790 19.74 4 -0.4112 % 2,723.8
OpRet 4.38 % -10.34 % 34,449 0.10 2 -0.0971 % 2,713.7
SplitShare 4.81 % 4.08 % 63,426 4.18 5 0.1353 % 3,112.4
Interest-Bearing 0.00 % 0.00 % 0 0.00 0 -0.0971 % 2,481.4
Perpetual-Premium 5.50 % -10.64 % 90,105 0.09 15 0.1643 % 2,408.5
Perpetual-Discount 5.28 % 5.30 % 105,773 14.92 21 0.0182 % 2,552.5
FixedReset 4.51 % 3.54 % 201,762 4.37 75 -0.0482 % 2,557.3
Deemed-Retractible 4.98 % -3.16 % 146,985 0.09 43 0.0180 % 2,529.6
FloatingReset 2.65 % 2.38 % 152,408 4.02 6 -0.0857 % 2,492.4
Performance Highlights
Issue Index Change Notes
PWF.PR.A Floater -2.45 % YTW SCENARIO
Maturity Type : Limit Maturity
Maturity Date : 2044-05-26
Maturity Price : 19.51
Evaluated at bid price : 19.51
Bid-YTW : 2.70 %
PWF.PR.L Perpetual-Discount -1.06 % YTW SCENARIO
Maturity Type : Limit Maturity
Maturity Date : 2044-05-26
Maturity Price : 24.03
Evaluated at bid price : 24.31
Bid-YTW : 5.29 %
PWF.PR.O Perpetual-Premium 1.05 % YTW SCENARIO
Maturity Type : Call
Maturity Date : 2017-10-31
Maturity Price : 25.25
Evaluated at bid price : 26.10
Bid-YTW : 4.83 %
Volume Highlights
Issue Index Shares
Traded
Notes
ENB.PF.C FixedReset 188,913 Recent new issue.
YTW SCENARIO
Maturity Type : Limit Maturity
Maturity Date : 2044-05-26
Maturity Price : 23.12
Evaluated at bid price : 25.02
Bid-YTW : 4.16 %
MFC.PR.D FixedReset 155,193 Called for redemption.
YTW SCENARIO
Maturity Type : Call
Maturity Date : 2014-07-19
Maturity Price : 25.00
Evaluated at bid price : 24.97
Bid-YTW : 4.52 %
TRP.PR.D FixedReset 136,210 YTW SCENARIO
Maturity Type : Limit Maturity
Maturity Date : 2044-05-26
Maturity Price : 23.20
Evaluated at bid price : 25.10
Bid-YTW : 3.84 %
SLF.PR.F FixedReset 133,250 Called for redemption.
YTW SCENARIO
Maturity Type : Call
Maturity Date : 2014-06-30
Maturity Price : 25.00
Evaluated at bid price : 24.97
Bid-YTW : 1.26 %
ENB.PR.T FixedReset 114,933 YTW SCENARIO
Maturity Type : Limit Maturity
Maturity Date : 2044-05-26
Maturity Price : 23.03
Evaluated at bid price : 24.62
Bid-YTW : 4.02 %
MFC.PR.L FixedReset 97,730 YTW SCENARIO
Maturity Type : Hard Maturity
Maturity Date : 2025-01-31
Maturity Price : 25.00
Evaluated at bid price : 25.00
Bid-YTW : 3.80 %
There were 25 other index-included issues trading in excess of 10,000 shares.
Wide Spread Highlights
Issue Index Quote Data and Yield Notes
HSB.PR.D Deemed-Retractible Quote: 25.60 – 26.33
Spot Rate : 0.7300
Average : 0.4707

YTW SCENARIO
Maturity Type : Call
Maturity Date : 2014-06-25
Maturity Price : 25.25
Evaluated at bid price : 25.60
Bid-YTW : -2.80 %

PWF.PR.A Floater Quote: 19.51 – 20.30
Spot Rate : 0.7900
Average : 0.5875

YTW SCENARIO
Maturity Type : Limit Maturity
Maturity Date : 2044-05-26
Maturity Price : 19.51
Evaluated at bid price : 19.51
Bid-YTW : 2.70 %

PWF.PR.L Perpetual-Discount Quote: 24.31 – 24.65
Spot Rate : 0.3400
Average : 0.2622

YTW SCENARIO
Maturity Type : Limit Maturity
Maturity Date : 2044-05-26
Maturity Price : 24.03
Evaluated at bid price : 24.31
Bid-YTW : 5.29 %

ELF.PR.G Perpetual-Discount Quote: 22.30 – 22.57
Spot Rate : 0.2700
Average : 0.1974

YTW SCENARIO
Maturity Type : Limit Maturity
Maturity Date : 2044-05-26
Maturity Price : 21.89
Evaluated at bid price : 22.30
Bid-YTW : 5.37 %

CU.PR.C FixedReset Quote: 25.84 – 26.08
Spot Rate : 0.2400
Average : 0.1676

YTW SCENARIO
Maturity Type : Call
Maturity Date : 2017-06-01
Maturity Price : 25.00
Evaluated at bid price : 25.84
Bid-YTW : 2.82 %

ENB.PR.F FixedReset Quote: 24.46 – 24.66
Spot Rate : 0.2000
Average : 0.1280

YTW SCENARIO
Maturity Type : Limit Maturity
Maturity Date : 2044-05-26
Maturity Price : 23.05
Evaluated at bid price : 24.46
Bid-YTW : 4.07 %

Market Action

May 23, 2014

In a story picked up by the Globe, Renee Altom wrote a piece for the Richmond Fed titled Why was Canada exempt from the financial crisis?; she concludes that a

So to truly understand a country’s financial landscape, you have to go back — all the way back — to its beginning. Financial regulation in a new world typically starts with one question: Who has the authority to charter banks?

This seemingly small choice sets off a chain reaction, according to Michael Bordo and Angela Redish, Canadian economists at Rutgers University and the University of British Columbia, respectively, and Hugh Rockoff, a monetary expert also at Rutgers. They’ve studied the differences between Canada and the United States in several papers dating back to the 1990s.

They argue that the states here prohibited banks from branching, while Canada did not.
…
Many economists have argued that this “unit banking” in the United States made banks more fragile. For one thing, banks were rather undiversified.
…
According to the recent study by Calomiris and Haber, set out in their 2014 book Fragile By Design, united factions with an interest in keeping banks small succeeded in shooting down attempts at branching liberalization until the 1980s.
…
The U.S. Constitution gave all functions not explicitly handed to the federal government, such as regulatory policy, to the states. Interests needed only to win legislative fights at the local level, which was a far easier task than in today’s relatively more federalized system, Calomiris and Haber contended. Thus, they argued that the origins of a country’s financial stability — or lack thereof — are mainly political. Small farmers opposed branching because it would allow banks to take credit elsewhere after a bad harvest. Small banks wanted protection from competition. And many others opposed any signs of growing power concentrated in any one institution — or bank.
…
There have been many proposed explanations for why our financial system proved much less resilient than Canada’s in 2007 and 2008, from insufficient regulation, to lax mortgage lending, to our history of government rescues.

The longer lens of history shows, however, that any one explanation for financial instability — and therefore any one regulatory attempt to fix it — may be too simple. Even if unit banking is a relic of the past, it is still with us through its effects on the evolution of the U.S. financial system — just as reforms today will determine the shape and stability of the financial system of the future.

The slowdown in trading hasn’t hurt TD & RBC much:

Heading into the current bank earnings season, the worry was that Canadian investment banks would suffer from the same trading slowdown that hit so many global rivals. RBC was particularly in the spotlight, because it has the biggest trading operation of all the Canadian lenders.

Yet their results came in Thursday, and they were surprisingly good considering what the worst case scenarios looked like.
…
For RBC, the strength stems from its capital markets operations beyond Canada’s borders. “The growth is really focused in the U.S., and our [fixed income] Europe business has performed well in the last quarter as well. And I think really it’s just more origination in Europe and also the markets are much improved in Europe,” Mr. McGregor added.

TD benefited from origination as well, albeit mostly in the domestic market. Asked about the bank’s strong trading numbers in the first half of fiscal 2014, capital markets head Bob Dorrance said they’re “driven significantly by the origination markets.”

Coincidentally, S&P came out with a report titled Delving Deeper Into Global Trading Banks’ Risks And Rewards: A Study Of Public Disclosures. RBC is one of the top 15 global banks for trading, with a 1.8% market share.

Tougher regulatory requirements, particularly as they pertain to capital, have caused some of the biggest global banks to scale back their trading businesses to ensure that profitability clears their cost of capital. Although this has enabled a few select banks with scalable trading operations to increase their market share, the overall trend has been a decline in sales and trading as a percentage of banks’ total revenues–a development that has reduced some of the market risks related to banks’ trading operations from their 2007-2008 peaks, in our view. That said, we believe trading risks remain significant, and could destabilize banks that don’t manage them properly.
…

  • We have carried out a study of public disclosures by the 15 rated banks with the largest global trading operations to assess changes in the risk of their trading activities.
  • Trading as a percentage of overall revenue has declined for most of these banks over the past five years, and trading risks have subsided from their excessive precrisis levels, largely because of stricter regulation and lower market volumes. However, the risks are still significant, in our view, and could destabilize banks that don’t manage them well.
  • We don’t expect to take any imminent rating actions on these banks based on developments in their trading activities, but changes in their risk profiles, over time, could lead to positive or negative rating actions.

…
Assessing trading risk at banks can be a difficult endeavor because trading positions, especially derivatives and less-liquid securities, are very complex and opaque. Moreover, the value at risk (VaR) models and other internal models that aim to measure market risks can be inaccurate and inconsistent, particularly in relation to peers. And a significant market disruption may render fair values, which are the basis for many derivatives and securities, unreliable and difficult to measure.

Notably, two recent Bank for International Settlements (BIS) trading surveys that analyzed risk-weighted assets for market risk showed substantial discrepancies across banks in measuring VaR and also showed that regulatory capital requirements for market risk vary among global banks. An October 2013 BIS paper (“Fundamental Review of The Trading Book—Second Consultative Document”) outlines, among other things, certain proposals to improve the accuracy and consistency of bank trading risk-weighted assets, in order to make them more commensurate with risk. We believe this is a step toward further consistency across banks, but more clarity is necessary (see “Basel’s Proposed Overhaul Of Capital Requirement Calculations For Banks’ Trading Risk Is Only A Step Toward Greater Consistency,” published Jan. 31, 2014). Although VaR has certain limitations–and thus, in isolation, may provide an incomplete picture of a bank’s trading risk–we still believe it has value when considered with other factors in determining market risk. That said, we do not base our analysis on ratios alone, not least because some can be the result of a multitude of different influences, some positive and some negative, which we detail in Appendix 3.

The BIS document is titled Consultative Document: Fundamental review of the trading book: A revised market risk framework. To my astonishment, it does not mention ageing as a test for whether or not something is legitimately in the trading book, but:

Having reflected on feedback from the first consultative paper, the Committee has developed a revised boundary that retains the link between the regulatory trading book and the set of instruments that banks deem to hold for trading purposes, but seeks to address weaknesses in the boundary by reducing the possibility of arbitrage and by providing more supervisory tools. As such, this boundary is more likely to be aligned with banks’ own risk management practices relative to the valuation-based approach.
…
The Committee remains concerned about the risk of arbitrage. To reduce the incentives for arbitrage, the Committee is seeking a less permeable boundary with stricter limits on switching between books and measures to prevent “capital benefit” in instances where switching is permitted. The Committee is also aiming to reduce the materiality of differences in capital requirements against similar types of risk on either side of the boundary. For example, the Committee has decided that the calibration of capital charges against default risk in the trading book will be closely aligned to the banking book treatment, especially for securitisations. The Committee is also investigating the development of Pillar 1 charges for interest rate and credit spread risk in the banking book.
…
Main differences between the current and proposed definition of the boundary

Intent-based boundary (current) Revised boundary
Requirement for reports to supervisors to make the boundary easier to supervise: N/A Requirement for reports to supervisors to make the boundary easier to supervise: Banks must prepare, evaluate and have available specified reports used by banks in their boundary determination decision, including reports on inventory ageing, daily limits, intraday limits (banks with active intraday trading), market liquidity and any deviations from the presumption lists.

So there will be reports! Lots and lots of lovely reports, requiring the employment of an army of regulators to read and another army of ex-regulators to prepare. Super!

It was a mixed day for the Canadian preferred share market, with PerpetualDiscounts up 18bp, FixedResets down 5bp and DeemedRetractibles off 1bp. Volatility was average. Volume was below average.

HIMIPref™ Preferred Indices
These values reflect the December 2008 revision of the HIMIPref™ Indices

Values are provisional and are finalized monthly
Index Mean
Current
Yield
(at bid)
Median
YTW
Median
Average
Trading
Value
Median
Mod Dur
(YTW)
Issues Day’s Perf. Index Value
Ratchet 0.00 % 0.00 % 0 0.00 0 0.1510 % 2,533.1
FixedFloater 4.52 % 3.76 % 32,842 17.88 1 -0.2374 % 3,797.3
Floater 2.88 % 2.98 % 49,779 19.72 4 0.1510 % 2,735.1
OpRet 4.37 % -10.94 % 32,936 0.11 2 -0.0388 % 2,716.3
SplitShare 4.81 % 4.19 % 58,931 4.19 5 -0.0874 % 3,108.2
Interest-Bearing 0.00 % 0.00 % 0 0.00 0 -0.0388 % 2,483.8
Perpetual-Premium 5.51 % -8.89 % 90,224 0.09 15 0.0052 % 2,404.5
Perpetual-Discount 5.28 % 5.29 % 106,596 14.89 21 0.1798 % 2,552.0
FixedReset 4.53 % 3.49 % 191,923 4.38 76 -0.0548 % 2,558.6
Deemed-Retractible 4.98 % -3.61 % 145,983 0.09 43 -0.0129 % 2,529.1
FloatingReset 2.66 % 2.36 % 153,832 4.02 6 0.0198 % 2,494.6
Performance Highlights
Issue Index Change Notes
CU.PR.E Perpetual-Discount -1.19 % YTW SCENARIO
Maturity Type : Limit Maturity
Maturity Date : 2044-05-23
Maturity Price : 23.64
Evaluated at bid price : 24.01
Bid-YTW : 5.10 %
PWF.PR.O Perpetual-Premium -1.07 % YTW SCENARIO
Maturity Type : Call
Maturity Date : 2018-10-31
Maturity Price : 25.00
Evaluated at bid price : 25.83
Bid-YTW : 5.08 %
BAM.PR.X FixedReset -1.05 % YTW SCENARIO
Maturity Type : Limit Maturity
Maturity Date : 2044-05-23
Maturity Price : 22.14
Evaluated at bid price : 22.56
Bid-YTW : 3.97 %
PWF.PR.L Perpetual-Discount 1.53 % YTW SCENARIO
Maturity Type : Limit Maturity
Maturity Date : 2044-05-23
Maturity Price : 24.27
Evaluated at bid price : 24.57
Bid-YTW : 5.23 %
Volume Highlights
Issue Index Shares
Traded
Notes
ENB.PF.C FixedReset 293,263 Recent new issue.
YTW SCENARIO
Maturity Type : Limit Maturity
Maturity Date : 2044-05-23
Maturity Price : 23.12
Evaluated at bid price : 25.02
Bid-YTW : 4.15 %
BMO.PR.S FixedReset 174,289 Recent new issue.
YTW SCENARIO
Maturity Type : Call
Maturity Date : 2019-05-25
Maturity Price : 25.00
Evaluated at bid price : 25.48
Bid-YTW : 3.66 %
GWO.PR.S Deemed-Retractible 156,145 Recent new issue.
YTW SCENARIO
Maturity Type : Hard Maturity
Maturity Date : 2025-01-31
Maturity Price : 25.00
Evaluated at bid price : 25.28
Bid-YTW : 5.15 %
RY.PR.B Deemed-Retractible 127,241 Nesbitt crossed 125,000 at 25.70.
YTW SCENARIO
Maturity Type : Call
Maturity Date : 2014-06-22
Maturity Price : 25.50
Evaluated at bid price : 25.67
Bid-YTW : -3.61 %
RY.PR.I FixedReset 115,210 Scotia crossed 100,000 at 25.63.
YTW SCENARIO
Maturity Type : Call
Maturity Date : 2019-02-24
Maturity Price : 25.00
Evaluated at bid price : 25.61
Bid-YTW : 2.97 %
MFC.PR.D FixedReset 100,707 Called for redemption.
YTW SCENARIO
Maturity Type : Call
Maturity Date : 2014-07-19
Maturity Price : 25.00
Evaluated at bid price : 24.97
Bid-YTW : 4.28 %
There were 25 other index-included issues trading in excess of 10,000 shares.
Wide Spread Highlights
Issue Index Quote Data and Yield Notes
BNA.PR.E SplitShare Quote: 25.62 – 26.00
Spot Rate : 0.3800
Average : 0.2472

YTW SCENARIO
Maturity Type : Hard Maturity
Maturity Date : 2017-12-10
Maturity Price : 25.00
Evaluated at bid price : 25.62
Bid-YTW : 4.05 %

CU.PR.E Perpetual-Discount Quote: 24.01 – 24.45
Spot Rate : 0.4400
Average : 0.3182

YTW SCENARIO
Maturity Type : Limit Maturity
Maturity Date : 2044-05-23
Maturity Price : 23.64
Evaluated at bid price : 24.01
Bid-YTW : 5.10 %

PWF.PR.O Perpetual-Premium Quote: 25.83 – 26.19
Spot Rate : 0.3600
Average : 0.2525

YTW SCENARIO
Maturity Type : Call
Maturity Date : 2018-10-31
Maturity Price : 25.00
Evaluated at bid price : 25.83
Bid-YTW : 5.08 %

BNA.PR.C SplitShare Quote: 25.15 – 25.40
Spot Rate : 0.2500
Average : 0.1645

YTW SCENARIO
Maturity Type : Hard Maturity
Maturity Date : 2019-01-10
Maturity Price : 25.00
Evaluated at bid price : 25.15
Bid-YTW : 4.19 %

CM.PR.G Perpetual-Premium Quote: 25.50 – 25.70
Spot Rate : 0.2000
Average : 0.1213

YTW SCENARIO
Maturity Type : Call
Maturity Date : 2014-06-22
Maturity Price : 25.00
Evaluated at bid price : 25.50
Bid-YTW : -14.09 %

MFC.PR.J FixedReset Quote: 25.82 – 26.06
Spot Rate : 0.2400
Average : 0.1632

YTW SCENARIO
Maturity Type : Call
Maturity Date : 2018-03-19
Maturity Price : 25.00
Evaluated at bid price : 25.82
Bid-YTW : 3.02 %

Market Action

May 22, 2014

Bank of America is closing its internal market-making unit:

Bank of America Corp. is dismantling an electronic market-making unit created last year to serve the lender’s Merrill Lynch wealth-management division, said two people with knowledge of the decision.

Increased regulatory scrutiny of U.S. equity markets and managers’ concerns for the potential perception of a conflict of interest killed the project, said the people. The desk advanced to a testing phase before being abandoned in recent weeks and two executives hired to run it, Jonathan Wang and Steven Sadoff, were told to seek new jobs within the firm, the people said, requesting anonymity because the matter is private.

Businesses such as the shuttered Bank of America unit usually execute equity orders internally, rather than sending them to the public stock market. Critics including Kor Group LLC’s Dave Lauer say the practice may cause harm by keeping some supply and demand private, distorting prices. Bank of America’s decision coincides with a renewed examination by regulators of whether trading in the $22 trillion U.S. stock market is fair.

For Bank of America, “this is either not a profitable business anymore or they don’t want to deal with the regulatory scrutiny that’s coming,” said Joe Saluzzi, co-head of equity trading at Themis Trading LLC in Chatham, New Jersey. “It definitely tells you they’re concerned and maybe they’re hearing things we haven’t.”

Kor Group LLC’s Dave Lauer’s argument is, essentially:

This structure is not dissimilar to something called Payment for Order Flow (PFOF), in which a wholesaler (such as Knight Getco or Citadel) will pay a retail broker for its order flow and then either internalize that flow or send it along to the broader market. In the case of PFOF, it is very profitable for the wholesalers to buy retail order flow and lucrative for brokers to sell this flow – so much so that it is generally referred to as “uninformed” or even “juicy” order flow. These terms describe the willingness of retail traders to pay the spread and the associated fees without a short-term view as to what will happen to the stock price over the next few milliseconds and seconds because of their long-term investment outlook or for swing/day-trading. For wholesalers, the profits from trading against this flow more than offset the fees that they pay to the retail brokers.

However, the PFOF model does a disservice to the market at large, as removing this order flow can theoretically inhibit price discovery, discouraging market makers from posting orders if they know that the only orders that make it to the exchange are the so-called “toxic” or “professional” flow. Internalizers and wholesalers are free-riding the public quote, and in essence “queue jumping” (a loaded term, to be sure) orders on lit exchanges that may have price-time priority from an absolute perspective.
…
So why can’t we count on the market and competitive forces to fix these issues? Because maker-taker creates a fundamental conflict of interest and a puts exchanges between a rock and a hard place. It makes no difference to an exchange’s revenue what its rebates/fees are – as the exchange makes money on the difference between the two. However, exchanges are unable to lower their rebates and fees because doing so would chase away resting orders to those exchanges that do not lower their rebates.

This is why regulatory intervention is required, and the Notre Dame study quantitatively shows that. In order to move forward, this intervention should be in the form of a pilot study – as advocated by Royal Bank of Canada (RBC) and others – that eliminates rebates in a set of symbols, and requires the trade-at rule in those names, as Canada and Australia do. This rule simply states that in order to execute a trade of less than 5,000 shares off-exchange (in a dark pool or internalization system), there must be significant price improvement (at least a tick, or half a tick if the spread is a tick wide). High-frequency trading (HFT) proponents explain, quite reasonably, that maker rebates are necessary to compensate them for adverse selection (as explained earlier, only the “toxic” flow actually makes it to exchanges now). The trade-at rule will reduce adverse selection and improve price discovery on public venues, ultimately benefitting all investors and providing compensation to market makers.

He also used as evidence the study by Robert Battalio, Shane Corwin, and Robert Jennings, Can Brokers Have It All?, referred to here on April 21, 2014. Seems to me that if the spread’s too wide, there’s money to be made by improving it.

TRACE? SchmACE!

The world’s biggest bond dealers, including JPMorgan Chase & Co. (JPM) and Morgan Stanley, failed to properly report trades to the industry’s price-tracking system more than 11,000 times. JPMorgan’s penalty: About three minutes of its annual profit.

Fines levied in settlements disclosed last month by the Financial Industry Regulatory Authority amounted to a fraction of what the two New York-based firms generated from trading debt during the two-year reviews. JPMorgan’s $95,000 penalty was the biggest imposed by Finra as it cited at least three other dealers in the past five months for similar types of violations.

Regulators are seeking to uphold the integrity of the bond-price reporting system known as Trace, the biggest window into a market that’s grown about 78 percent since 2008 as investors poured money into debt securities. Holding back information on trades can give Wall Street dealers an advantage over customers seeking a fair price, undermining Finra’s stated goal of equal access for all participants to real-time data.
…
JPMorgan racked up the most Trace-related violations disclosed this year, the result of five separate reviews, according to a settlement released in April. The bank, which ranks as the biggest bond trader and top underwriter of corporate debt, neglected to post trades or missed deadlines in at least 6,300 instances from March 2010 through May 2012, at times omitting a quarter of required reporting, Finra said.

In one review, Finra found the violations accounted for almost 20 percent of corporate debt transactions the bank was required to report over three months in 2011. In another, JPMorgan didn’t report 24 percent of new-issue offerings over five months, the regulator said.

Sometimes the bank didn’t report the correct volume, time or date of transactions, and the firm inadequately supervised compliance, according to the documents.

Moody’s sounded a warning on the provinces:

Both parties should take note of the latest from Moody’s, which puts [Ontario] net debt as a percentage of revenue at 237.7 in the 2014-15 fiscal year, the highest in the country.

Not only the highest, actually, but far and away above the next in line, Quebec, at 189.5.

The lowest is Alberta, at 31.9.

Alberta and British Columbia are alone among the provinces in holding a triple-A rating with Moody’s, the former deemed “stable” and the latter “negative.”

“Most Canadian provinces maintained their ratings and stable credit outlook through the financial crisis and subsequent slow recovery,” Moody’s said in its report.

“However, the continued accumulation of debt and difficulty in returning to balanced budgets is increasing negative credit pressure for some provinces.”

Revenue-to-debt, I can’t help with. But there’s a a good idea for improving debt-to-GDP!

Italy will include prostitution and illegal drug sales in the gross domestic product calculation this year, a boost for its chronically stagnant economy and Prime Minister Matteo Renzi’s effort to meet deficit targets.

Drugs, prostitution and smuggling will be part of GDP as of 2014 and prior-year figures will be adjusted to reflect the change in methodology, the Istat national statistics office said today. The revision was made to comply with European Union rules, it said.

Renzi, 39, is committed to narrowing Italy’s deficit to 2.6 percent of GDP this year, a task that’s easier if output is boosted by portions of the underground economy that previously went uncounted.

The administrators of the TMXMoney.com website got back to me this morning about the problem with the pricing data, as discussed on May 20 and May 21 …

Hello,

Thank you for your comment. We have forwarded your inquiry to marketdata@tmx.com. They will contact you shortly.

In the future, for any inquiries relating to market data, please reach out to marketdata@tmx.com directly or call (416) 947-4778.

If you have any suggestions for new functionality/features please feel free to use the “Suggest an Idea” box on TMXmoney.com.

Thank you,

This was followed shortly afterwards with:

Status update

An idea you voted for has been closed!

3 votes have been returned to you Go spend your votes on more ideas…

In other words … ‘Shee-it, man, if we had a clue we wouldn’t have to work for a bank!’ Well, it was worth a try! Thanks to all those who voted for the suggestion.

Assiduous Reader GA writes in and says:

AMBest withdrew their rating of CCS.PR.C and CCS.PR.D

IS this an indication that shares will be called for redemption by the end of the month? CCS.PR.D should certainly be redeemed and they have until the end of the month to announce it!

So, first of all, it’s true: A.M. Best Affirms Ratings of Co-operators General Insurance Company, Its Subsidiary and Co-operators Life Insurance Company:

A.M. Best has affirmed the financial strength rating (FSR) of A- (Excellent) and issuer credit ratings (ICR) of “a-” of Co-operators General Insurance Company (Co-operators General) and its subsidiary, The Sovereign General Insurance Company (Sovereign) (Alberta).

In addition, A.M. Best has affirmed the FSR of A (Excellent) and ICR of “a” of Co-operators Life Insurance Company (Co-operators Life) (Saskatchewan). The outlook for all ratings is stable.

Concurrently, A.M. Best has withdrawn the debt ratings of “bbb-” of the preferred shares of CAD 100 million 5% non-cumulative redeemable Class E preference shares, Series C [TSX: CCS.PR.C] and CAD 115 million 7.25% non-cumulative five-year reset Class E preference shares, Series D [TSX: CCS.PR.D] issued by Co-operators General.

But I think that it indicates only that Cooperators is tired of paying for ratings that don’t really make a lot of difference to their ability to sell preferred shares. Only ratings by DBRS and S&P are important; during the crisis it looked as if Moody’s was going to become a third player, but there doesn’t seem to be much of a rush for three ratings other than the initial handful of banks and insurers.

I continue to visit the Cooperators media page regularly to check whether they’ve finally pulled the trigger on the expected CCS.PR.D redemption (redeemable on 2014-6-30; Issue Reset Spread of 521bp) but it hasn’t happened yet.

It was a good day for the Canadian preferred share market, with PerpetualDiscounts winning 17bp, FixedResets gaining 4bp and DeemedRetractibles up 11bp. Volatility would have been low if it had not been for fine performance from the (generally very volatile) Floaters. Volume was very low, considering the boost that should have resulted from the two new issues settling today.

HIMIPref™ Preferred Indices
These values reflect the December 2008 revision of the HIMIPref™ Indices

Values are provisional and are finalized monthly
Index Mean
Current
Yield
(at bid)
Median
YTW
Median
Average
Trading
Value
Median
Mod Dur
(YTW)
Issues Day’s Perf. Index Value
Ratchet 0.00 % 0.00 % 0 0.00 0 1.6750 % 2,529.3
FixedFloater 4.51 % 3.75 % 33,076 17.90 1 -0.1422 % 3,806.4
Floater 2.88 % 2.99 % 50,251 19.70 4 1.6750 % 2,730.9
OpRet 4.37 % -12.00 % 33,077 0.11 2 0.0777 % 2,717.4
SplitShare 4.81 % 4.15 % 59,265 4.19 5 0.0557 % 3,110.9
Interest-Bearing 0.00 % 0.00 % 0 0.00 0 0.0777 % 2,484.8
Perpetual-Premium 5.51 % -9.85 % 93,663 0.09 15 0.0052 % 2,404.4
Perpetual-Discount 5.29 % 5.31 % 107,938 14.91 21 0.1721 % 2,547.4
FixedReset 4.53 % 3.50 % 196,232 4.38 76 0.0363 % 2,560.0
Deemed-Retractible 4.98 % -3.79 % 146,140 0.09 43 0.1147 % 2,529.5
FloatingReset 2.66 % 2.34 % 155,771 4.03 6 -0.0659 % 2,494.1
Performance Highlights
Issue Index Change Notes
BAM.PR.C Floater 1.14 % YTW SCENARIO
Maturity Type : Limit Maturity
Maturity Date : 2044-05-22
Maturity Price : 17.69
Evaluated at bid price : 17.69
Bid-YTW : 2.99 %
ELF.PR.G Perpetual-Discount 1.27 % YTW SCENARIO
Maturity Type : Limit Maturity
Maturity Date : 2044-05-22
Maturity Price : 21.87
Evaluated at bid price : 22.28
Bid-YTW : 5.37 %
BAM.PR.K Floater 1.39 % YTW SCENARIO
Maturity Type : Limit Maturity
Maturity Date : 2044-05-22
Maturity Price : 17.53
Evaluated at bid price : 17.53
Bid-YTW : 3.02 %
BAM.PR.B Floater 1.56 % YTW SCENARIO
Maturity Type : Limit Maturity
Maturity Date : 2044-05-22
Maturity Price : 17.62
Evaluated at bid price : 17.62
Bid-YTW : 3.00 %
PWF.PR.A Floater 2.51 % YTW SCENARIO
Maturity Type : Limit Maturity
Maturity Date : 2044-05-22
Maturity Price : 20.00
Evaluated at bid price : 20.00
Bid-YTW : 2.63 %
Volume Highlights
Issue Index Shares
Traded
Notes
ENB.PF.C FixedReset 1,260,098 New issue settled today.
YTW SCENARIO
Maturity Type : Limit Maturity
Maturity Date : 2044-05-22
Maturity Price : 23.13
Evaluated at bid price : 25.04
Bid-YTW : 4.14 %
GWO.PR.S Deemed-Retractible 753,041 New issue settled today.
YTW SCENARIO
Maturity Type : Hard Maturity
Maturity Date : 2025-01-31
Maturity Price : 25.00
Evaluated at bid price : 25.10
Bid-YTW : 5.23 %
CU.PR.C FixedReset 303,665 RBC crossed 294,500 at 25.70.
YTW SCENARIO
Maturity Type : Call
Maturity Date : 2017-06-01
Maturity Price : 25.00
Evaluated at bid price : 25.65
Bid-YTW : 3.07 %
BMO.PR.S FixedReset 108,865 Recent new issue.
YTW SCENARIO
Maturity Type : Call
Maturity Date : 2019-05-25
Maturity Price : 25.00
Evaluated at bid price : 25.55
Bid-YTW : 3.60 %
ENB.PR.J FixedReset 81,798 Nesbitt crossed 70,000 at 25.12.
YTW SCENARIO
Maturity Type : Limit Maturity
Maturity Date : 2044-05-22
Maturity Price : 23.20
Evaluated at bid price : 25.07
Bid-YTW : 4.07 %
BAM.PR.N Perpetual-Discount 36,728 RBC probably did something. The public TMX reports aren’t clear.
YTW SCENARIO
Maturity Type : Limit Maturity
Maturity Date : 2044-05-22
Maturity Price : 21.82
Evaluated at bid price : 21.82
Bid-YTW : 5.53 %
There were 18 other index-included issues trading in excess of 10,000 shares.
Wide Spread Highlights
Issue Index Quote Data and Yield Notes
FTS.PR.F Perpetual-Discount Quote: 23.75 – 24.23
Spot Rate : 0.4800
Average : 0.2821

YTW SCENARIO
Maturity Type : Limit Maturity
Maturity Date : 2044-05-22
Maturity Price : 23.48
Evaluated at bid price : 23.75
Bid-YTW : 5.16 %

RY.PR.A Deemed-Retractible Quote: 25.71 – 25.89
Spot Rate : 0.1800
Average : 0.1054

YTW SCENARIO
Maturity Type : Call
Maturity Date : 2014-06-23
Maturity Price : 25.25
Evaluated at bid price : 25.71
Bid-YTW : -15.82 %

RY.PR.E Deemed-Retractible Quote: 25.89 – 26.10
Spot Rate : 0.2100
Average : 0.1379

YTW SCENARIO
Maturity Type : Call
Maturity Date : 2014-06-21
Maturity Price : 25.50
Evaluated at bid price : 25.89
Bid-YTW : -13.86 %

PWF.PR.K Perpetual-Discount Quote: 23.53 – 23.84
Spot Rate : 0.3100
Average : 0.2416

YTW SCENARIO
Maturity Type : Limit Maturity
Maturity Date : 2044-05-22
Maturity Price : 23.24
Evaluated at bid price : 23.53
Bid-YTW : 5.30 %

PWF.PR.E Perpetual-Premium Quote: 25.22 – 25.45
Spot Rate : 0.2300
Average : 0.1621

YTW SCENARIO
Maturity Type : Call
Maturity Date : 2014-06-21
Maturity Price : 25.00
Evaluated at bid price : 25.22
Bid-YTW : -1.17 %

CU.PR.G Perpetual-Discount Quote: 22.12 – 22.35
Spot Rate : 0.2300
Average : 0.1691

YTW SCENARIO
Maturity Type : Limit Maturity
Maturity Date : 2044-05-22
Maturity Price : 21.81
Evaluated at bid price : 22.12
Bid-YTW : 5.09 %