Assiduous Readers will remember the highly politicized SEC Flash Crash Report. It’s taken five years, but they’ve finally isolated a scapegoat who spends his spare time rubbing his hands together and cackling about the triumph of evil:
NAVINDER SINGH SARAO was a futures trader
who operated from his residence in the United Kingdom and who traded primarily through his company, Nav Sarao Futures Limited.
…
“Layering” (a type of “spoofing”) was a form of manipulative, high speed activity in the financial markets. In a layering scheme, a trader places multiple, bogus orders that the trader does not intend to have executed-for example, multiple orders to sell a financial product at different price points-and then quickly modifies or cancels those orders before they are executed. The purpose of these bogus orders is to trick other market participants and manipulate the product’s market price (in the foregoing example of bogus sell orders, by creating a false appearance of increased supply in the product and thereby depressing its market price). The trader seeks to mislead and deceive investors by communicating false pricing signals to the market, to create a false impression of how market participants value a financial product, and thus to prevent legitimate forces of supply and demand from operating properly. The trader does so by creating a false appearance of market depth, with intent to create artificial price movements. The trader could then exploit this layering activity by simultaneously executing other, real trades that the trader does intend to have executed, in an attempt to profit from the artificial price movements that the trader had created. Such layering and trading activity occurs over the course of seconds, in multiple cycles that the trader repeats throughout the trading day. Given the speed and near simultaneity of market activity in a successful layering scheme, such schemes are aided by custom programmed, automated trading software.
…
Beginning in or about June 2009, SARAO sought to enrich himself through manipulation of the market for E-Minis. By placing multiple large-volume orders on the CME at different price points, SARAO created the false appearance of substantial supply in order to fraudulently induce other market participants to react to his deceptive market information. SARAO thus artificially depressed EMini prices. With the aid of an automated trading program, SARAO was able to all but eliminate his risk of unintentionally executing these orders by modifying and ultimately canceling them before execution. Meanwhile, he exploited his manipulation to reap large trading profits by executing other, real orders.
Matt Levine of Bloomberg – who I respect greatly as a reporter who really puts a lot of intelligence and sweat to work when writing his columns – writes a wonderful column regarding the indictment:
So straightforward that one of the biggest puzzles here is why it took so long — and the help of a whistleblower — for regulators to figure it out. They came tantalizingly close:
As reflected in correspondence with both SARAO and an FCM he used, the CME observed that, between September 2008 and October 2009, SARAO had engaged in pre-opening activity — specifically, entering orders and then canceling them — that “appeared to have a significant impact on the Indicative Opening Price.” The CME contacted SARAO about this activity in March 2009 and notified him, via correspondence dated May 6, 2010, that “all orders entered on Globex during the pre-opening are expected to be entered in good faith for the purpose of executing bona fide transactions.” The CME provided a copy of the latter correspondence to SARAO’s FCM, which suggested to SARAO in an email that he call the FCM’s compliance department if he had any questions. In a responsive email dated May 25, 2010, SARAO wrote to his FCM that he had “just called” the CME “and told em to kiss my ass.”
Emphasis added because come on: The futures exchange wrote to Sarao on the day of the flash crash, telling him to stop spoofing, and he called them back “and told em to kiss my ass.” And then regulators pondered that reply for five years before deciding that they’d prefer to have him arrested in London and extradited to face criminal spoofing charges. One conclusion here might be that rudeness to regulators really works.
It’s a tempting idea!
The CFTC claims that Sarao basically started his spoofing career by causing the flash crash, and then went ahead and kept spoofing for another five years without much interruption. I guess he got more subtle at it? Not very subtle though; he was a consistently large trader, “placing, repeatedly modifying, and ultimately canceling multiple 200-, 250-, 300-, 400-, 500-, 550-, 600-, and 900-lot sell orders,” versus an average order size of seven contracts. He also seems to have had some patterns (like putting in orders for exactly 188 or 289 contracts that never executed) that you’d think would make him easier for regulators or exchanges to spot.6 If regulators think that Sarao’s behavior on May 6, 2010, caused the flash crash, and if they think he continued that behavior for much of the subsequent five years, and if that behavior was screamingly obvious, maybe they should have stopped him a little earlier?
Also, I mean, if his behavior on May 6, 2010, caused the flash crash, and if he continued it for much of the subsequent five years, why didn’t he cause, you know, a dozen flash crashes?
And Mr. Levine closes with the key point:
I have always been impressed and puzzled that low-tech spoofers have much success ripping off whomever they rip off. It’s such a minimal fraud; it’s just saying that you want to sell when you don’t want to sell.10 It’s always surprising that that could have a major effect on markets. John Arnold has argued here at Bloomberg View that spoofing only hurts front-running high-frequency traders, while others point out that “algorithmic trading tools are used by a wide class of traders,” including long-term investors like Waddell & Reed who use algorithms to try to avoid the front-running HFTs. But the FBI’s and CFTC’s theory here is far more troubling: It suggests that existing algorithms are not just dumb enough to give spoofers some of their money, but dumb enough to give spoofers so much of their money that they destabilize the financial markets. It’s not especially confidence-inspiring to read that a guy with a spreadsheet can trick everyone into thinking that the market is crashing, and thereby cause the market to crash.
Well, if the extremely well-paid hard-nosed deep-thinking portfolio managers at Waddell & Reed have their naivety and incompetence exploited by someone who plays the game a little better than they do, you won’t find any tears here.
I hadn’t read the argument linked with “others point out” before, but it doesn’t impress me:
Even if we exclude cases such as this one and legalize the submission of spoofed orders with the proviso that they stay live for less than 100ms, there are plenty of unsophisticated market participants who would still be harmed. These days, algorithmic trading tools are used by a wide class of traders. There is an entire industry, possibly larger than that of vanilla HFT, focused on creating and marketing these tools. Tremendous volume is executed via algorithms on behalf of traditional long-term traders.[2] I’m not an expert on such algorithms, but my impression is that they tend to be much less sophisticated than a lot of vanilla HFT, and thus more likely to be tricked by spoofing. A basic example of one such execution algorithm would be a peg order, which is priced in a very simple fashion somewhere in between the best bid and ask. If a spoofer alters the best bid then a peg order will change its price in response, leaving the user open to losses.
The open question here is: why should anybody in his right mind care about unsophisticated market participants? If they show up at a gunfight with a boxing glove, that’s their problem; the sooner they go bankrupt and go on welfare, the better, as far as I’m concerned. If they are placing orders with no other thought than ‘Golly, I guess I’ll do whatever the rest of the market is doing’ then they are contributing to market inefficiency and harming the market’s price discovery function. So screw ’em; give a medal to the guys who punish ’em. Markets and market regulation should concentrate on the best interests of fundamental traders; any help, succor or encouragement given to techno-weenies is misplaced.
The other major argument in the linked objection is:
Say that you wanted to change this definition to allow spoofing with the intention of damaging order-anticipation strategies. Could you do so in a fashion that didn’t also allow other kinds of nasty manipulation? I don’t see how. Manipulation via self-trading is probably a behavior that everybody agrees should be prohibited. When a manipulator trades with themselves, they can do so risk-free at an arbitrary price, giving other traders a false sense of the market price.[3] Self-trading can be extremely damaging to market integrity. But which group, I wonder, is most hurt by self-trading? One could argue that so-called “front-runners” are. For example, say Apple stock is currently trading at $100, and a manipulator trades 10 million shares with themselves at $90. There could be order-anticipation algorithms, ‘predicting’ selling to come, that react to this and sell Apple stock.[4] There could also be strategies that take this as a signal that there will soon be selling across the entire sector, and sell stocks in related companies. These algorithms fall under Arnold’s definition of “front-running,” and would be expected to lose money when the manipulator decides it’s time to push Apple stock back to $100. Does that mean we should celebrate the manipulator? No.[5]
That’s a big leap of logic in the last word there! I will certainly celebrate the manipulator: he’s punished a few stupid rat-turds who aren’t trading on fundamentals. Good for him!
To his credit, the guy at Mechanical Markets does address my view in his footnote:
[5] If you’re a long-term investor, this scenario seems great, right? You can buy Apple stock at a $10 discount. So, if you thought the stock had an intrinsic value of $105, you’re getting a real bargain. In practice though, I’d imagine that you would hesitate to start buying stock in such a scenario. At least until you had confirmed that the price wasn’t plummeting because of some news that you hadn’t heard yet. By the time you could rule out any news, the manipulator would have pushed the price back to $100.
He who hesitates is lost! Many limit orders entered by fundamental traders during the manipulation phase will be executed prices more attractive than would otherwise be the case. In the long run, fundamental traders who pursue incredibly sophisticated strategies like “paying what they consider a fair price for their purchases” will scoop up all kinds of money from the empty-headed game-players.
But, of course, the Boo-Hoo-Hoo Brigade is in full cry:
“It’s incumbent upon regulators not to be asleep at the switches,” said Donald Selkin, who helps manage about $3 billion as chief market strategist at National Securities Corp. in New York. “They have been, time and time again.”
…
“Things like this don’t build a lot of confidence,” said Timothy Ghriskey, the chief investment officer at Solaris Asset Management LLC in New York, who helps manage about $1.5 billion. “It’s a risk that regulators are always going to be a step behind. That’s why they should be more aggressive.”
…
“It’s ridiculous, it’s the government at its best — inept,” Rick Fier, director of equity trading at Conifer Securities LLC in New York, said in a phone interview. “It really is just another one of many things to deal with, it’s extremely frustrating. We’ve seen flash crashes and we’ll see them again and it’s definitely disconcerting.”
…
“The [high-frequency trading] term’s just become meaningless at this point; it’s just a boogie-man,” said Dave Lauer, president of Kor Group, a market structure lobbying and research firm.
“There are high-frequency market-makers, there are high-speed proprietary traders who don’t care about making markets and I do think there are predatory high-speed traders and manipulative high-speed traders,” Lauer said. “What this guy was doing was using computers in a manipulative, high-order-volume manner.”
…
no more than 20 trading days when volatility was high.
“On the surface, the headline isn’t comforting, but perhaps it provides the avenue to prevent something of this nature from happening again,” said Walter Todd, who oversees about $1 billion as chief investment officer for Greenwood, South Carolina-based Greenwood Capital. “I’m glad we know definitively how it happened, but at the same time, the headline isn’t a great thing.”
Go have lunch with a client, guys, if that’s all you’re good for.
Update: Here’s more argument in favour of ditching the completely artificial spoofing and layering rules – look at just just who Navinder Singh Sarao is and how he did it:
Sarao, 36, has no record of having worked at a major financial firm in the U.S. or the U.K. At the time of the flash crash, Sarao was renting space from a proprietary-trading firm in the City of London and clearing his transactions through MF Global Holdings Ltd., the now-defunct firm headed by Jon Corzine, said a person with knowledge of the matter.
…
That picture, according to U.S. authorities, belies a years-long history of lightening-quick computer trading that netted Sarao $40 million in illicit profits.
…
By all accounts, the flash crash was more than a mere technical glitch. It raised fundamental questions about how vulnerable today’s complex financial markets are to the high-speed, computer-driven trading that has come to dominate the marketplace.
…
Sarao’s computer screen almost always flashed futures data tied to the Standard & Poor’s 500 Index and his interactions were typically limited to workers installing new trading algorithms, said the person, who spoke on the condition of anonymity.
When he started his allegedly manipulative trading in 2009, Sarao used off-the-shelf software that he later asked to be modified so he could rapidly place and cancel orders automatically. At one point, he asked the software developer for the code, explaining that he wanted to play around with creating new versions, according to regulators.
So he wasn’t an expert trader, using his years of industry experience to exploit infinitesimal little bugs in standardized software, or his deep knowledge of trade-matching and clearing to exploit some bizarre mismatch in the interface between various systems.
He was one guy, using slightly modified off-the-shelf software, who broke one rule. And a rule, by the way that I feel is probably bent many, many times per day despite a very expensive army of regulators devoted to enforcing the silly thing.
If the US financial system is so vulnerable to one guy breaking one silly rule then we’ve got a problem that will not be fixed by doubling the number of regulators who check out trade cancellations and try to decide just what the intent was when each order was originally placed. If the rule is so vulnerable to exploitation and so unenforceable: get rid of it. Unleash the real players in the industry to detect and enforce a level playing field, with spoofing algorithms, spoofing detection and counter-exploitation algorithms, spoofing cloaking algorithms, anti-spoofing-cloaking algorithms … the whole nine yards. And bring some sanity back to the world.
Update, 2015-4-22: Zero Hedge is irritated:
While we eagerly await for the SEC to retract its official 104 page report summarizing the “Findings regarding the market events of May 6, 2010” in light of “recent developments”, and as we follow the shift in the official narrative to the outright bizarre, in which the entire Flash Crash is now blamed on just one man (as opposed to just Waddell & Reed as per the previous narrative), we learn that the latest scapegoat for a broken, fragmented and manipulated market, Navinder Sarao, is not quite so eager to go to minimum security prison in the US for doing what leads to a slap on the wrist when someone like Citadel or Virtu does it, and will challenge the CFTC’s attempt to pin everything on him.
…
As previoisly reported, Sarao engaged in what every other HFT firms on a daily basis: namely spoofing. However, because he is a foreigner, he was easy prey for the US “justice” system, and as a result it is he that has been picked as a scapegoat (perhaps because the official investigation into Virtu, Citadel and the other HFT firms revealed something so dramatic it needed an easy and available cover up).
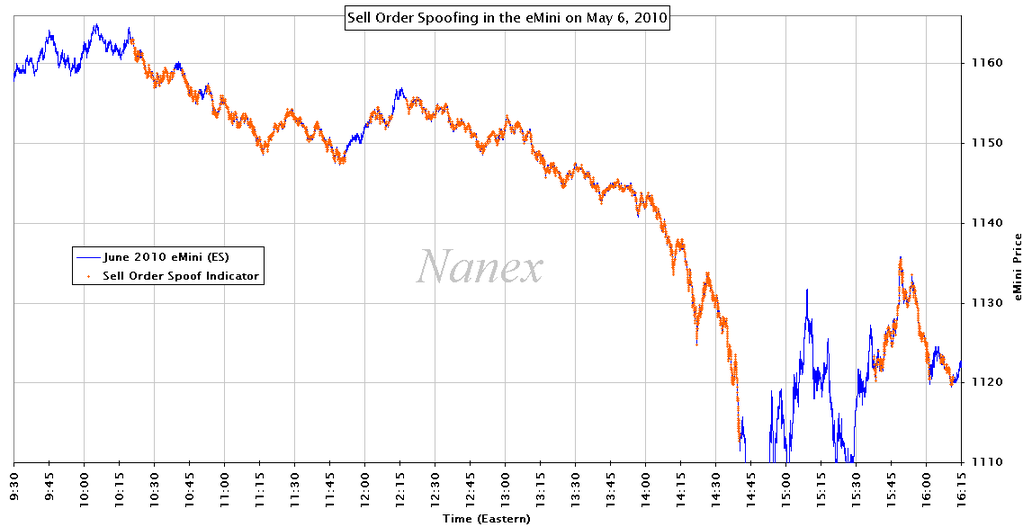
Eric Scott Hunsader of Nanex, whose work has been quoted admiringly on PrefBlog in the past, has posted a series of tweets:
If this futures trader *was* spoofing during Flash Crash, it means the CFTC completely missed what should have been easy to spot
…
Flash Crash Brit was just one of many #HFT ass-hats in the market on 5/6 contributing to a fragile system
…
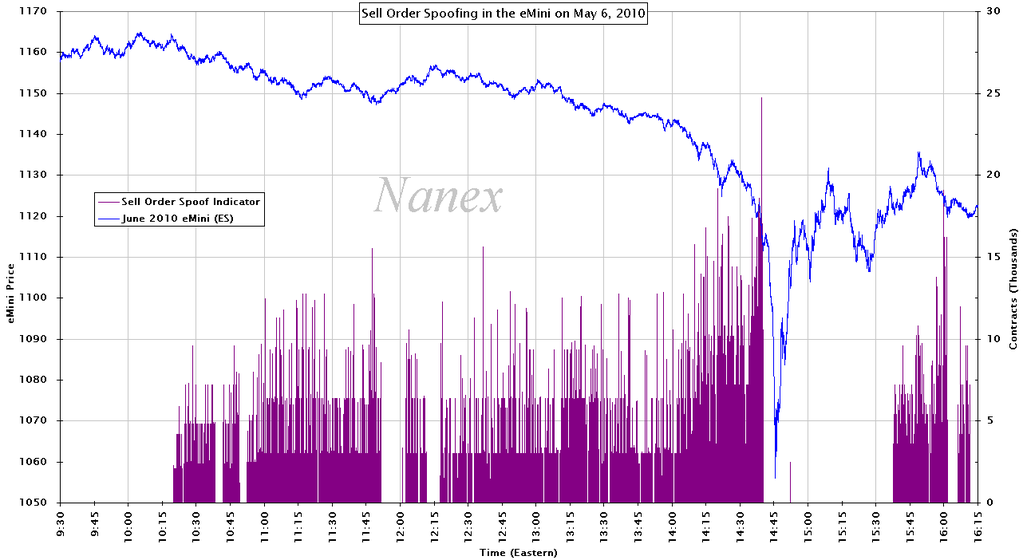
We spotted the Flash Crash Brit years ago – red/yellow on this eMini chart is from his algo on 5/6
…
What Singh Sarao is being accused of is as common as Oxygen. I can’t stress this enough.
…
It is wrong to say Sarao caused flash crash. He contributed to causing it, yes, but it was Barclay’s leak that sent it down
…
Why didn’t the CME say anything about Sarao for what.. 5 years now?
…
How did Andrei Kirilenko (CFTC) miss Sara’s spoofing while analyzing a week’s worth of AUDIT TRAIL DATA??
…
Why is Sarao (DOJ flash crash spoofer) being singled out from so many other #HFT spoofing algos?
…
When I 1st saw Sarao’s algo in Summer 2010, I thought it was Tradebot because it stopped when Cummings said they pulled the plug
…
“Exploratory Trading” – another #HFT strategy used by top firms to manipulate eMini’s $ES_F http://www.nanex.net/aqck2/4136.html
…
What really caused Flash Crash: Someone LEAKED that a mutual fund was selling 75K eMini’s via participation algo. Wall St pounced
…
Sarao turned off his algo at 14:40:12. The market flash crash began 2 minutes 32 seconds later at 14:42:44 – an eon in market time
…
Detailed forensic evidence on the flash crash: http://www.nanex.net/aqck2/4650.html
FT Alphaville has some harsh words:
In a series of moves variously known as “layering” or “spoofing,” Sarao allegedly created the appearance of substantial supply in the market which didn’t actually exist — sparking a short-lived 600 point fall over in the Dow Jones Industrial Average in the space of five minutes.
Except you know, instinctively, that this is nonsense. It’s pure financial keystone cop-ery. This is a laughable piece of regulatory grand-standing from the Americans, which the British authorities look like fools for going along with.
The S&P futures market, across its various guises, is colossal. It is dominated by robot traders and other, highly capitalised professionals. The simple idea that a chap in West London, playing around at home with an off-the-shelf algo programme on his PC while his parents are off at the gurdwara, can up-end the entire US equity market is comical.
Or rather, if there’s any truth here at all, the guys under arrest should be those at the top of the CME and other key pieces of US market infrastructure.