Matt Levine of Bloomberg points out the obvious flaws in paying informers:
Anyway $56 million for 14 water damaged houses! That’s a cool $4 million per house. Buys a lot of slab re-pouring. DealBook has more stories of whistle-blowers getting great gobs of money out of the Bank of America settlements — some $170 million to four whistle-blowers, out of Bank of America’s vast $16.65 billion mortgage settlement from August.
It is possible to overdo the talk of incentives in banking compensation, but, I mean, that’s quite an incentive. Appraising some homes properly will get you, let’s say, fired by your crooked bosses. 3 Appraising those homes improperly will get you, let’s say, a nice bonus. But appraising them improperly and then calling the FBI will get you a whopping great $56 million.
There are more signs that US real estate continues to normalize:
There’s an undersupply of single-family houses and apartments to rent for the first time since 2001, according to an analysis by Frank Nothaft, chief economist at mortgage buyer Freddie Mac, based on available inventory and historic vacancy rates. The deficit in the third quarter was about 350,000, the most in records dating back 14 years.
The shortage is giving the upper hand to institutional investors who spent more than $25 billion since 2012 buying single-family homes to rent. While the market for apartments has been in favor of landlords for five years, owners of houses are now able to increase rents and reduce turnover to boost profits.
…
The U.S. rental-vacancy rate fell to 7.4 percent in the third quarter, according to Census Bureau data. The market is considered balanced, with neither landlords nor tenants having the upper hand when it comes to rents, at a vacancy rate of 8.2 percent, based on the average from 1994 through 2003, according to Freddie Mac (FMCC)’s Nothaft.
The housing surplus peaked at almost 2 million units, including 1.2 million rentals, in the third quarter of 2009, when foreclosures were soaring and years of speculative construction led to a glut of empty houses.
Geoffrey R. Dunbar writes a Working Paper for the BoC titled Demographics and the Demand for Currency:
I use data from the Bank of Canada’s Bank Note Distribution System and exploit a natural experiment offered by the timing of Easter in the Gregorian calendar to analyze the effects of demographic change for currency demand. I find that the main drivers of low-denomination bank note demand are merchants. Merchants and the youngest age group, aged 15-24, are also a significant source of demand for twenty-dollar bank notes and for the total dollar value of withdrawals. In contrast, increases in the demographic age groups 25-54 and 55 plus tend to lower bank note withdrawals. Finally, I find no evidence that employment status is related to bank note demand, but that there is a difference between the bank note demand of men aged 15-24 and women aged 15-24 increases in the share of women aged 15-24 lead to increases in bank note demand.
The last sentence provides great opportunity for salacious speculation! Regrettably:
Although it is interesting to conjecture reasons for the apparent difference in currency demand between young men and young women, the data available do not permit a causal investigation.
The BoC has also published a Working Paper by Sami Alpanda and Sarah Zubairy titled Addressing Household Indebtedness: Monetary, Fiscal or Macroprudential Policy?:
In this paper, we build a dynamic stochastic general-equilibrium model with housing and household debt, and compare the effectiveness of monetary policy, housing-related fiscal policy, and macroprudential regulations in reducing household indebtedness. The model features long-term fixed-rate borrowing and lending across two types of households, and differentiates between the flow and the stock of household debt. We use Bayesian methods to estimate parameters related to model dynamics, while level parameters are calibrated to match key ratios in the U.S. data. We find that monetary tightening is able to reduce the stock of real mortgage debt, but leads to an increase in the household debt-to-income ratio. Among the policy tools we consider, tightening in mortgage interest deduction and regulatory loan-to-value (LTV) are the most effective and least costly in reducing household debt, followed by increasing property taxes and monetary tightening. Although mortgage interest deduction is a broader tool than regulatory LTV, and therefore potentially more costly in terms of output loss, it is effective in reducing overall mortgage debt, since its direct reach also extends to home equity loans.
I don’t like the idea of macroprudential regulation as stated: reducing the maximum LTV is too prescriptive. I would much prefer adding a countercyclical element to the Risk Weighting of mortgages for banks in Canada – e.g., if mortgages on the balance sheet are within – say – 3% of the 10 year average, then everything is normal. But once they’re – say – 10% above the 10 year average, then the Risk Weight changes from 35% to 40%. There are also considerations of public welfare in play – when loans are easy to get, introducing a macroprudential policy that leans against high-LTV mortgages means that the marginal consumer is being told he can’t buy a house, but can buy a car. And what if the wise policy-makers are wrong?
Allison Schrager of Bloomberg reminds us of The Real Risk of Pension Plans: They Give Retirees False Security:
Retirement security is ending the year at an all-time low. The $1.1 trillion last-minute spending bill will allow trustees to cut benefits in multiemployer defined benefit pension plans. And while it affects a relatively small population, 10 million people at most, it opens the door for other employers to make similar cuts. Maybe that’s a long way off; maybe not. But the provision is a rude awakening: We may romanticize guaranteed retirement benefits and lament our 401(k) world, but pensions aren’t safe these days either.
…
It turns out that pension plan sponsors, and the politicians who oversee them, are just as fallible as workaday employees. We all prefer to spend more today and deal with the future when it comes. Pension plans have done this for years by promising generous benefits without a clear plan to pay for them. When pressed, they may simply raise their performance expectations or choose more risky investments in search of higher returns. Neither is a legitimate solution. In theory, regulators should keep pension plan sponsors in check. In practice, the rules regulators must enforce tend to indulge, or even encourage, risky behavior.
It was a nice day for US Equities:
The Standard & Poor’s 500 Index (SPX) increased 0.4 percent to 2,078.54 at 4 p.m. in New York, above its previous record close of 2,075.37 reached Dec. 5. The Dow Jones Industrial Average climbed 154.64 points, or 0.9 percent, to 17,959.44, also a closing record. The Russell 200 Index added 0.5 percent to the highest since July, while the Nasdaq Composite Index (CCMP) finished 10 points below a more than 14-year high.
…
The S&P 500 and Dow (INDU) climbed back to record levels after a slide in oil prices and a worsening of the financial crisis in Russia rippled through financial markets earlier this month, wiping more than $1 trillion from U.S. equity values in less than two weeks. The S&P 500 lost 5 percent in seven trading days through Dec. 16.
Today’s gains in the S&P 500 completed the fifth recovery this year from a decline of 4 percent or more, just 17 days after it started. In comparable drops beginning in January, April, July and September, the S&P 500 needed about a month to erase losses, data compiled by Bloomberg show.
This is the 50th time this year the S&P 500 has closed at an all-time high, while the Dow has done it 35 times. The S&P 500 reached records on 45 occasions in 2013, as the index recovered from the financial crisis to top its previous high from October 2007 for the first time
Canadian equities, not so much:
Canadian stocks declined, after posting the best week in five years, as commodity producers tumbled with the price of crude and metals.
…
The Standard & Poor’s/TSX Composite Index (SPTSX) fell 35.88 points, or 0.3 percent, to 14,432.38 at 4 p.m. in Toronto. Trading in the benchmark gauge’s stocks was 16 percent below the 30-day average. The index has lost 2.1 percent in December, paring its gains for the year to 6 percent.
Veresen Inc., proud issuer of VSN.PR.A and VSN.PR.C, has announced:
the formation of a new entity, Veresen Midstream Limited Partnership (“Veresen Midstream”), which will be owned equally by Veresen and affiliates of Kohlberg Kravis Roberts & Co. L.P. (“KKR”), a global investment firm. Veresen Midstream has entered into definitive agreements to acquire certain natural gas gathering and compression assets supporting Montney development in the Dawson area of northeastern British Columbia from Encana Corporation (“Encana”) and the Cutbank Ridge Partnership (“CRP”). CRP is a partnership between Encana and Cutbank Dawson Gas Resources Ltd., a subsidiary of Mitsubishi Corporation. Veresen Midstream has also agreed to undertake up to $5 billion of new midstream expansion for Encana and CRP in the Montney region under a 30-year fee-for-service arrangement. Veresen Midstream will be Veresen’s primary growth vehicle for its Canadian natural gas and natural gas liquids (“NGL”) midstream business.
Key Highlights
- Establishes Veresen Midstream as a leading player in the core of the Montney, one of North America’s most prolific and competitive resource plays.
- Requires no up-front funding from Veresen; Veresen Midstream will be funded initially through committed non-recourse debt and a cash equity contribution from KKR, while Veresen will fund its equity investment by contributing its Hythe/Steeprock assets.
- Provides Veresen Midstream with a large multi-year capital program to construct contracted midstream infrastructure under favourable economic terms, and a powerful platform to pursue additional third-party growth opportunities.
- Establishes a long-term, fee-for-service natural gas gathering, compression and processing agreement with Encana and CRP.
- Cash flow neutral to Veresen in 2015; accretive as Veresen Midstream’s new capital projects are placed in-service.
DBRS comments:
DBRS expects that this agreement will have no material impact on the credit risk profile of Veresen. Based on its preliminary review, DBRS views the agreement as neutral for the business risk profile of the Company. The business risk profile of Veresen Midstream is supported by the Hythe/Steeprock firm’s long-term take-or-pay contract with Encana and the Dawson assets (current and future expansion) which are under long-term contract with CRP. Veresen would also modestly benefit from a more diversified portfolio of assets situated in the rich gas Montney basin, which is one of the most prolific gas plays actively targeted by major producers; however, this benefit could be offset by the significant financing requirements at Veresen Midstream, as DBRS notes that cash distributions will be available to Veresen after debt servicing at Veresen Midstream.
… and as for DBRS itself:
DBRS Ltd., the world’s fourth-largest credit rating company, has agreed to be acquired by the Carlyle Group (CG) and Warburg Pincus for about $500 million, according to people familiar with the sale.
The headquarters of closely held DBRS, which has offices in New York, Chicago and London, will stay in Toronto, and Walter Schroeder, the firm’s founder, will remain an investor, the companies said in a statement today.
“While our Canadian franchise and culture will continue to be at the core of DBRS’s operations, the breadth and depth of both Warburg Pincus and Carlyle’s international presence will be invaluable to DBRS,” Schroeder said in the statement.
Carlyle and Warburg were attracted to DBRS primarily because of its strong position in Canada and niche products like commercial mortgage-backed securities, which will provide steady cash flow as it looks to expand elsewhere in the U.S. and Europe, according to a person familiar with the matter.
It was a mixed day for the Canadian preferred share market, with PerpetualDiscounts down 28bp, FixedResets off 8bp and DeemedRetractibles gaining 7bp. There is yet another lengthy list of performance highlights, with Brookfield issues prominent among the losers. Volume was average.
For as long as the FixedReset market is so violently unsettled, I’ll keep publishing updates of the more interesting and meaningful series of FixedResets’ Implied Volatilities. This doesn’t include Enbridge because although Enbridge has a large number of issues outstanding, all of which are quite liquid, the range of Issue Reset Spreads is too small for decent conclusions. The low is 212bp (ENB.PR.H; second-lowest is ENB.PR.D at 237bp) and the high is a mere 268 for ENB.PF.G.
Remember that all rich /cheap assessments are:
- based on Implied Volatility Theory only
- are relative only to other FixedResets from the same issuer
- assume constant GOC-5 yield
- assume constant Implied Volatility
- assume constant spread
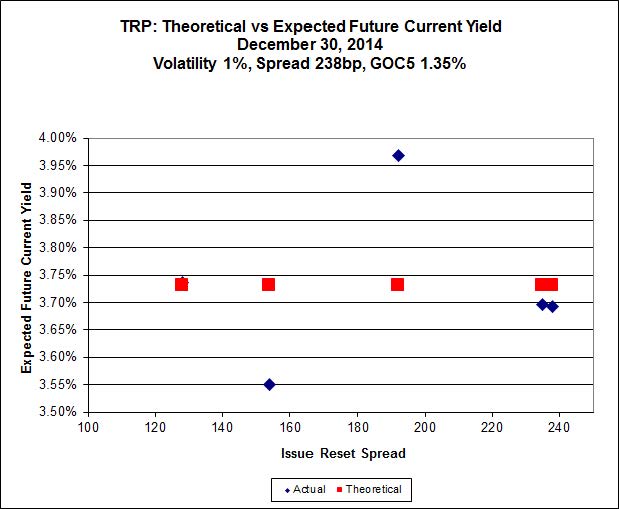
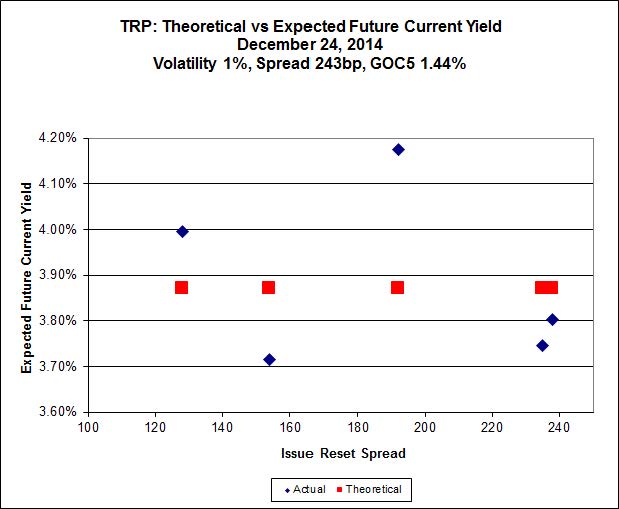
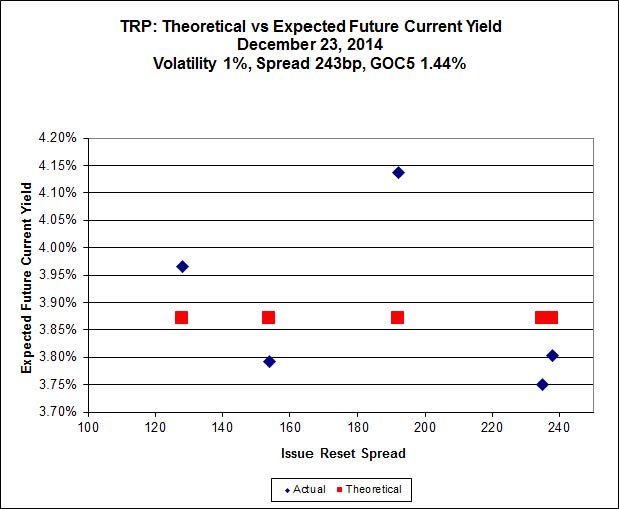
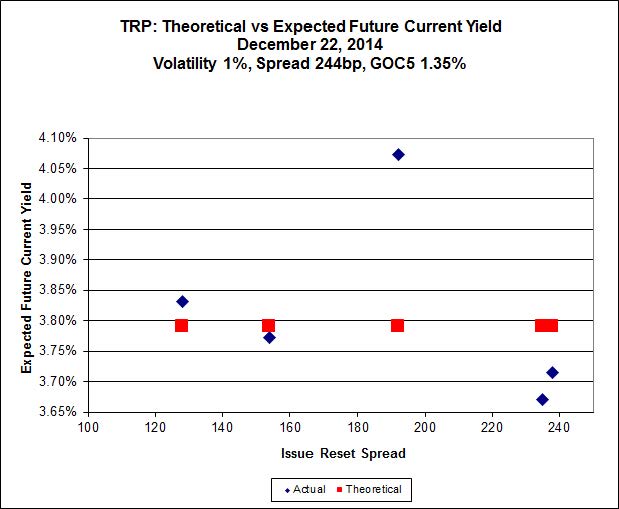
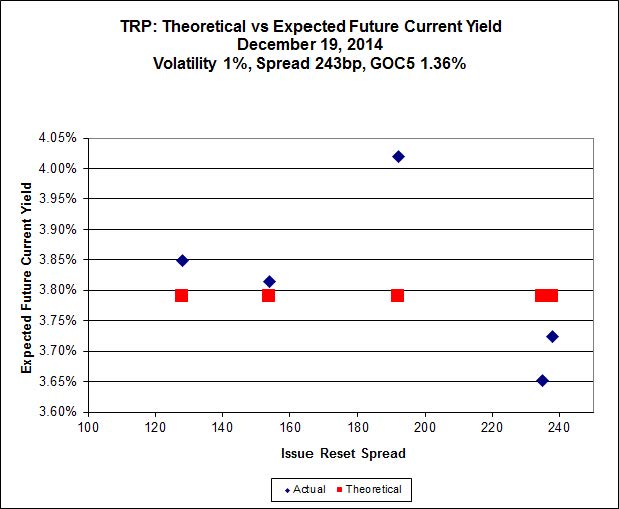
Here’s TRP:
 Click for Big
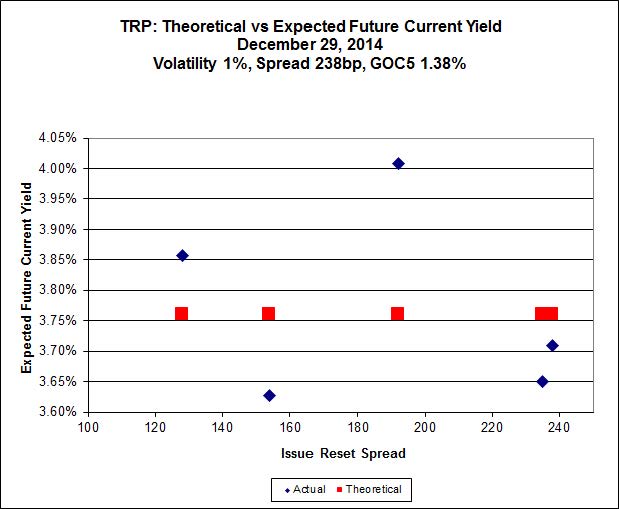
So according to this, TRP.PR.A, bid at 20.07, is $1.50 cheap, but it has already reset (at +192). TRP.PR.D, bid at 25.10 and resetting at +238bp on 2019-4-30 is $0.09 rich and TRP.PR.E, bid at 25.20 and resetting at +235bp on 2019-10-30, is $0.79 rich.
This particular calculation is fascinating because it is apparent that – disregarding the TRP.PR.A outlier – the slope of the line used to calculate implied volatility is negative. I can’t remember seeing one of those since the Credit Crunch!
 Click for Big
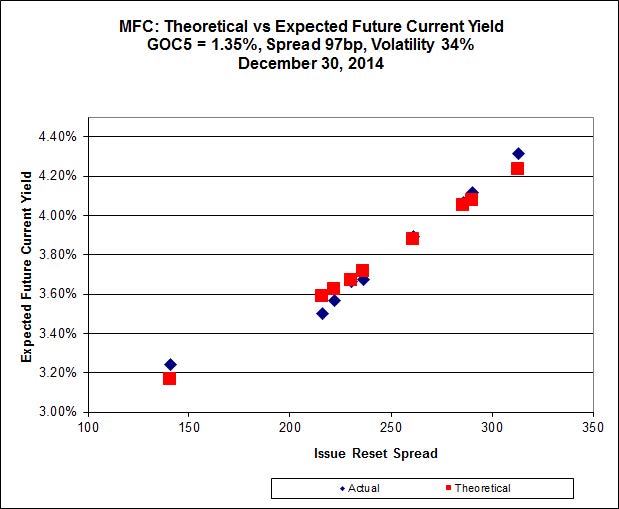
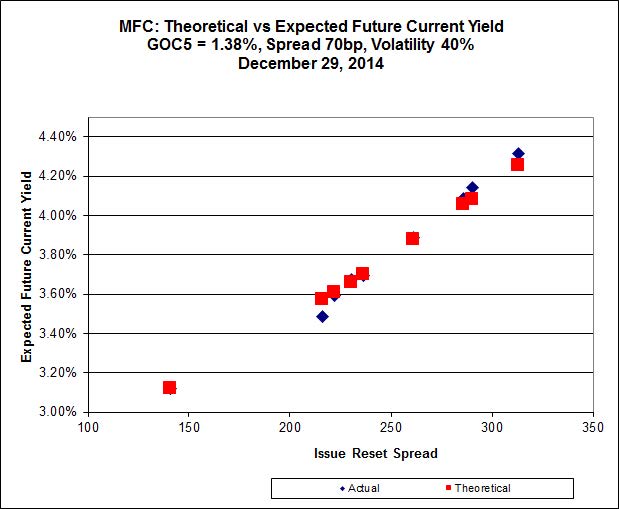
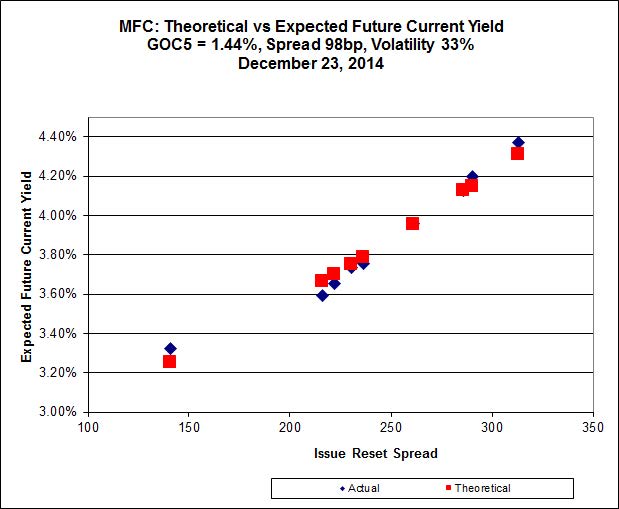
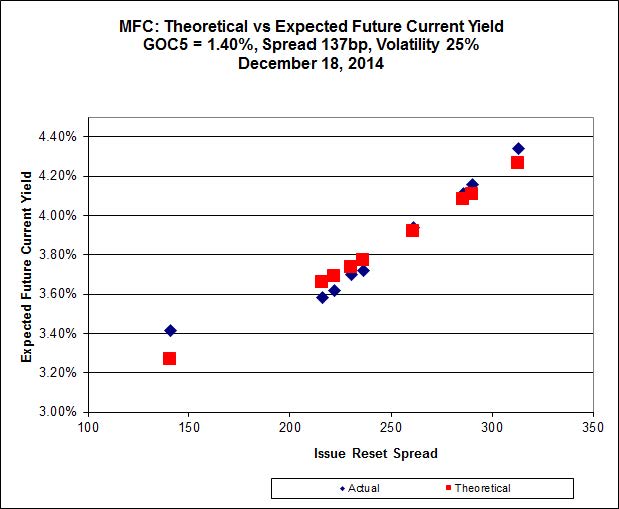
Here, as has often been the case lately, it is apparent that
- MFC.PR.F, resetting at 141bp on 2016-06-19 is in another world and distorting results again. It’s the only deep-discount issue, bid at 20.53 – everything else is above or near par
- the slope determined by the higher-spread issues is unreasonably high if these are to be considered perpetual issues and unreasonably low if they are to be considered NVCC non-compliant issues
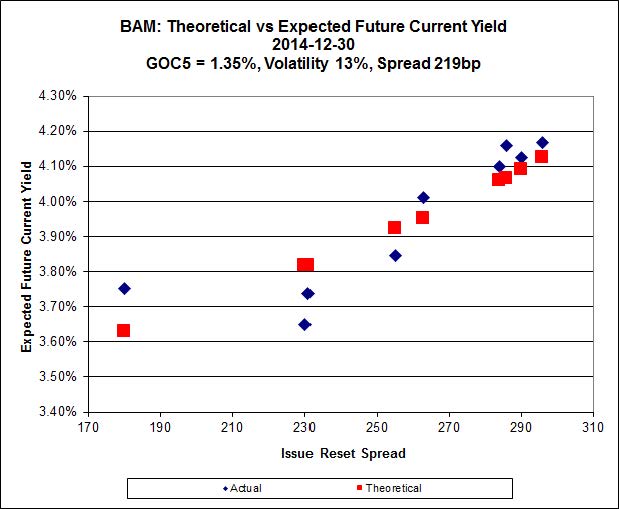
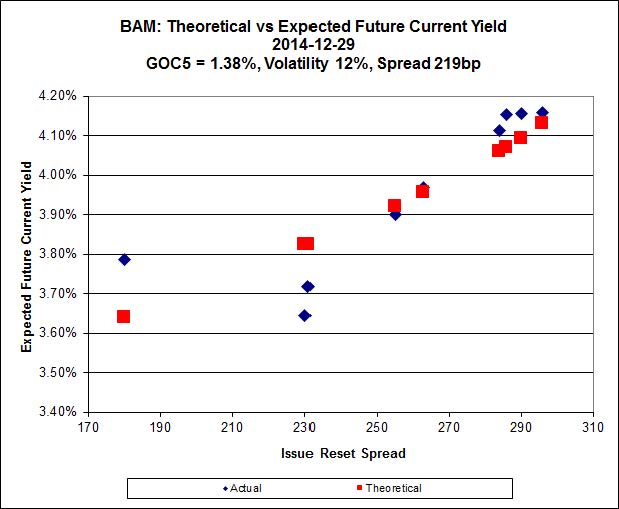
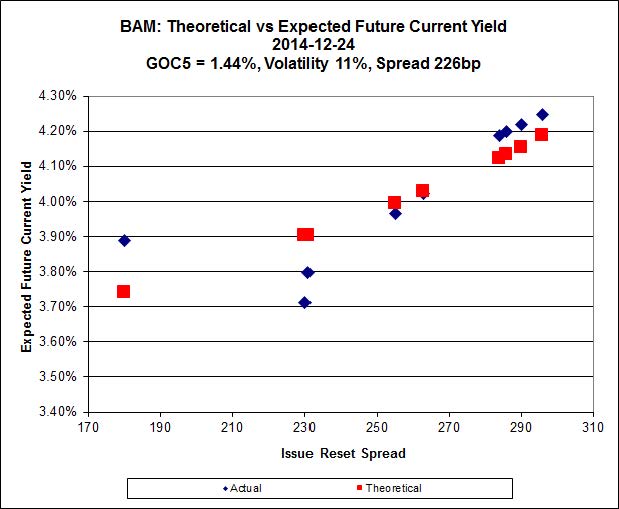
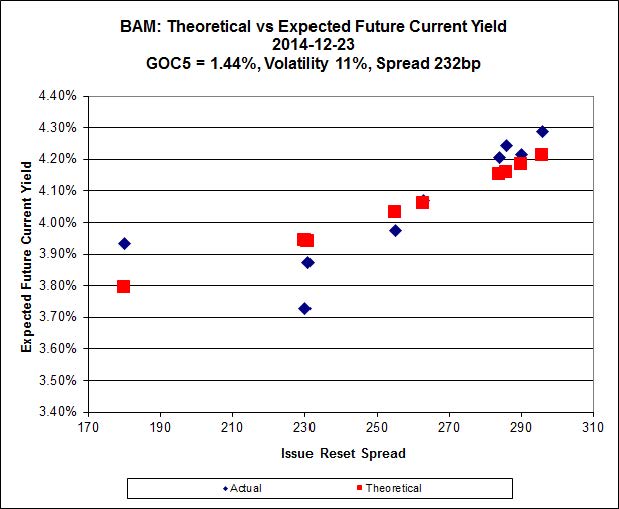
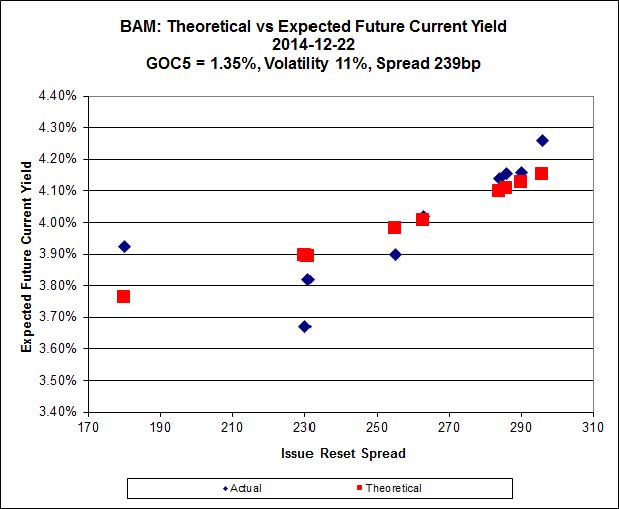
 Click for Big
There continues to be extraordinary cheapness in the lowest-spread issue, BAM.PR.X, resetting at +180bp on 2017-6-30, which is bid at 20.07 and appears to be $0.86 cheap, while BAM.PR.R, resetting at +230bp 2016-6-30 is bid at 24.86 and appears to be $1.43 rich.
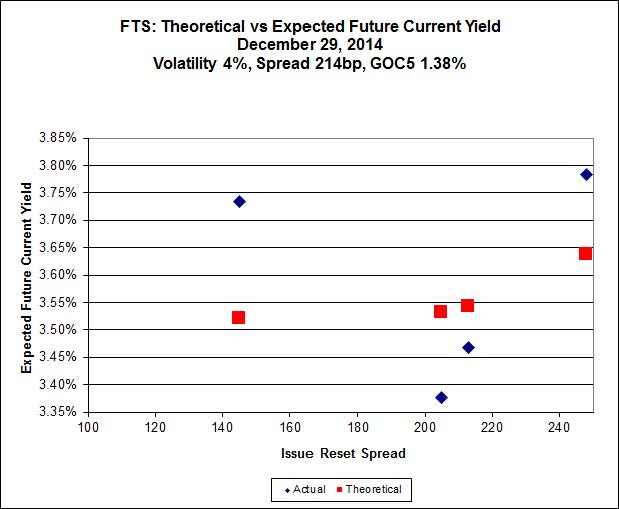
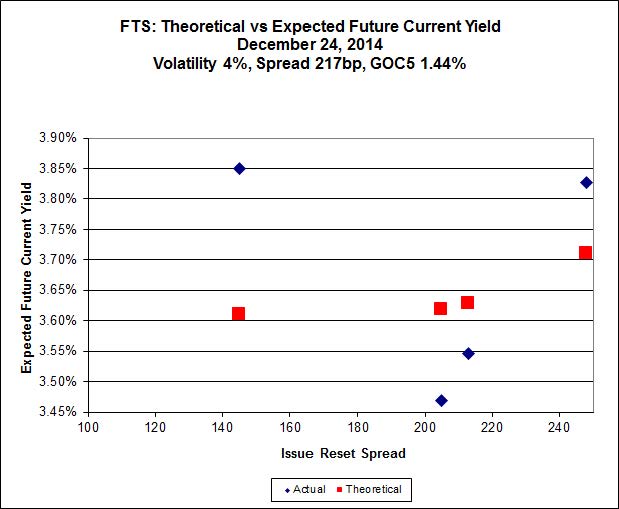
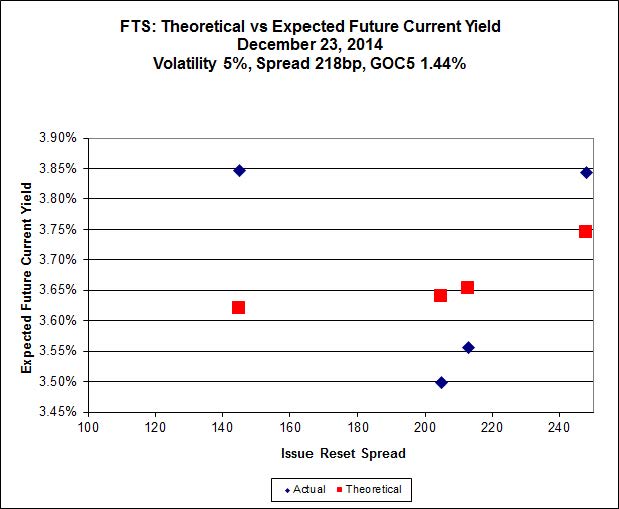
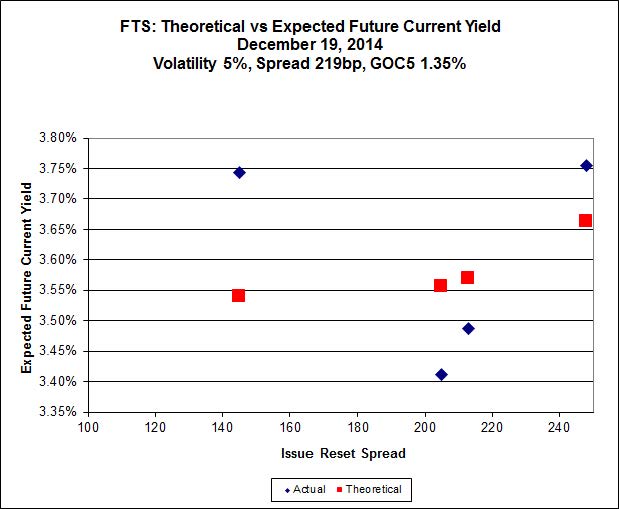
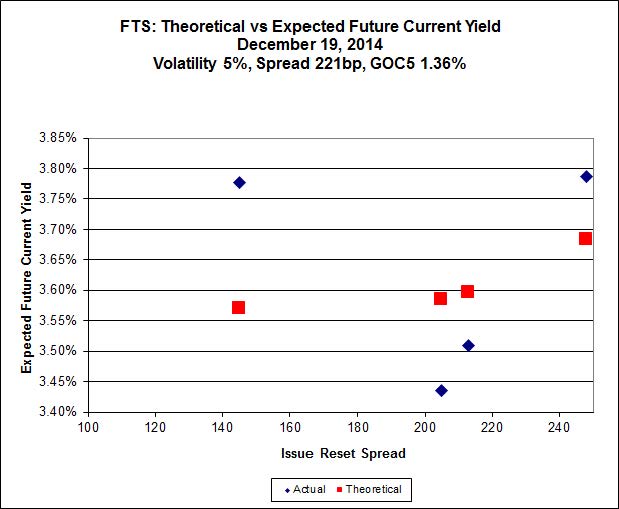
 Click for Big
This is just weird because the middle is expensive and the ends are cheap but anyway … FTS.PR.H, with a spread of +145bp, and bid at 18.70, looks $1.07 cheap and resets 2015-6-1. FTS.PR.K, with a spread of +205bp, and bid at 24.91, looks $1.01 expensive and resets 2019-3-1
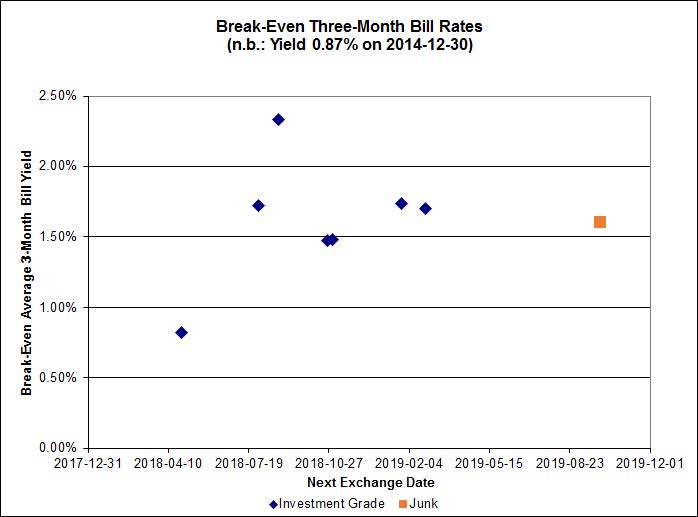
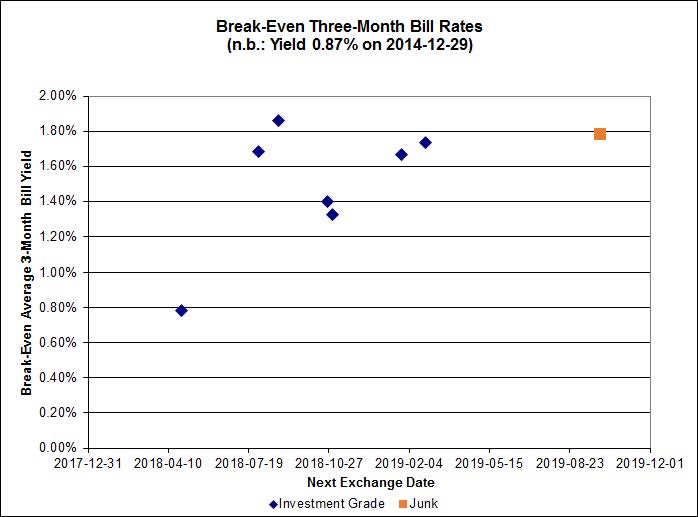
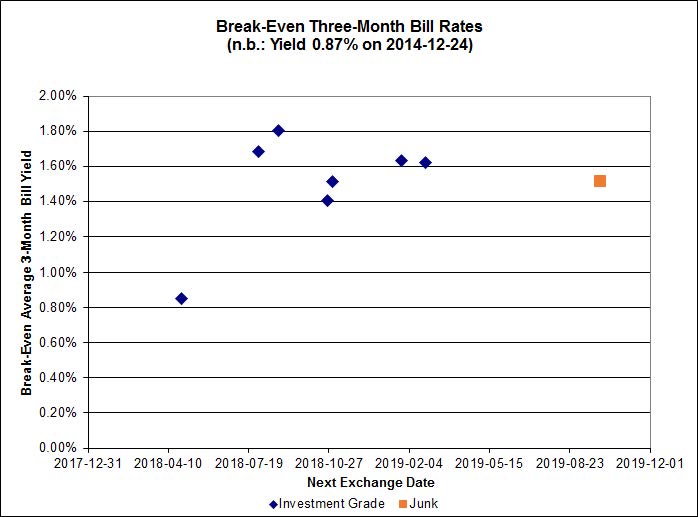
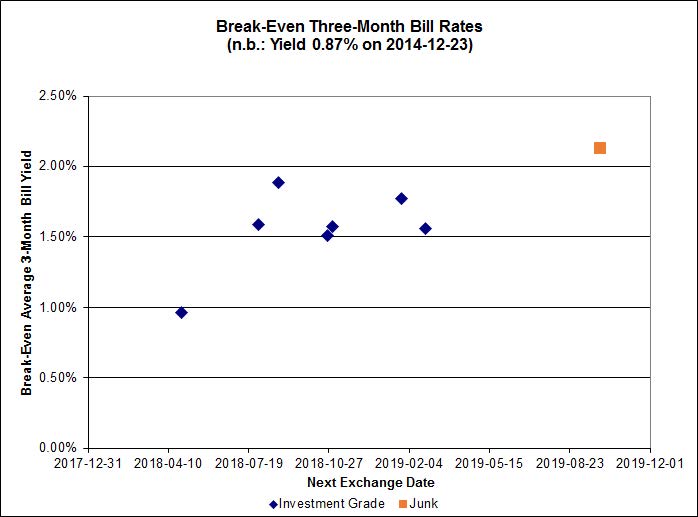
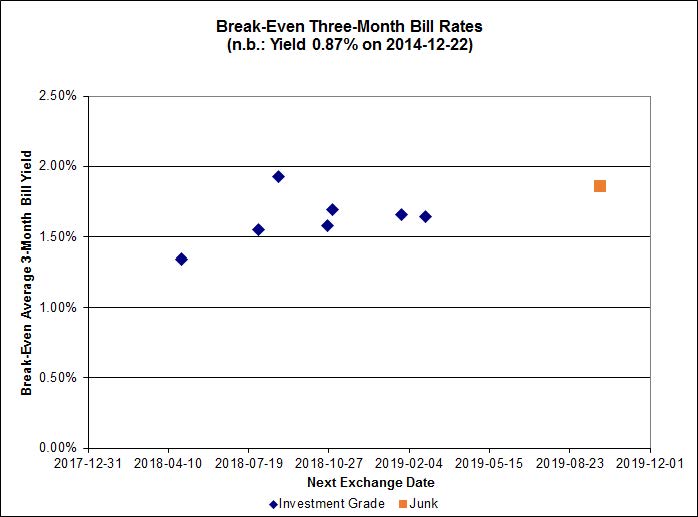
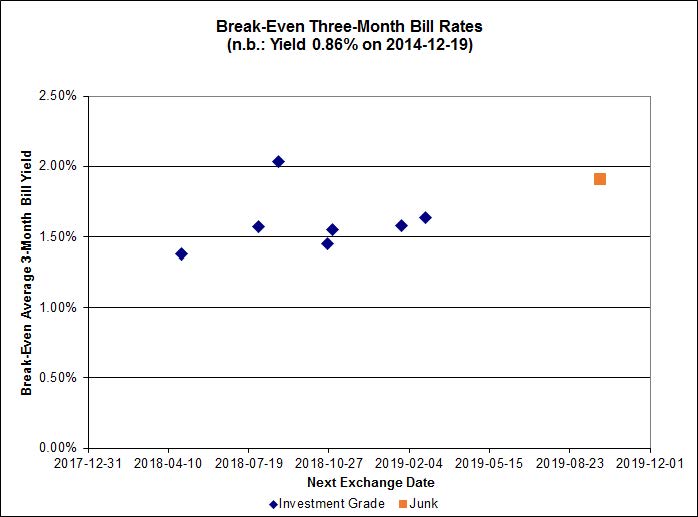
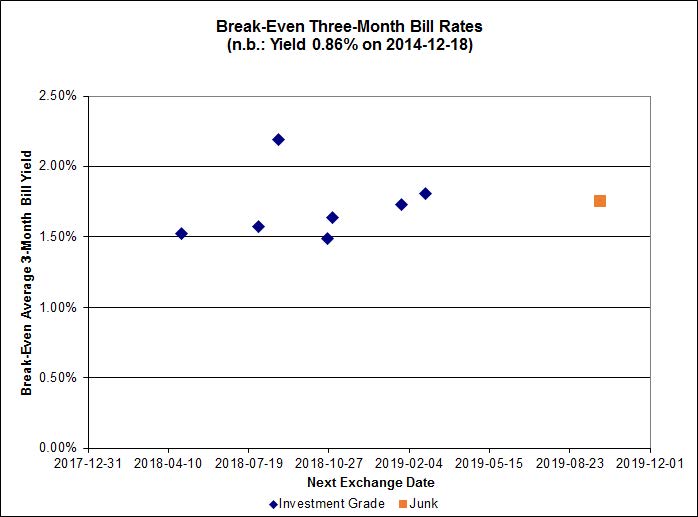
 Click for Big
The average break-even rate has declined from 1.80%-2.00% at the time recent conversion decisions were made to a current range of (mostly) 1.55%-1.70%. This decline means that the estimated profit on TRP.PR.A conversion has declined from $0.48 to a mere $0.21 (at the lower end of the range, 1.55%).
HIMIPref™ Preferred Indices
These values reflect the December 2008 revision of the HIMIPref™ Indices
Values are provisional and are finalized monthly |
| Index |
Mean
Current
Yield
(at bid) |
Median
YTW |
Median
Average
Trading
Value |
Median
Mod Dur
(YTW) |
Issues |
Day’s Perf. |
Index Value |
| Ratchet |
0.00 % |
0.00 % |
0 |
0.00 |
0 |
-0.8443 % |
2,458.7 |
| FixedFloater |
0.00 % |
0.00 % |
0 |
0.00 |
0 |
-0.8443 % |
3,892.6 |
| Floater |
3.08 % |
3.19 % |
66,900 |
19.27 |
4 |
-0.8443 % |
2,613.8 |
| OpRet |
4.41 % |
-2.77 % |
26,167 |
0.08 |
2 |
0.0000 % |
2,748.8 |
| SplitShare |
4.29 % |
4.09 % |
38,865 |
3.69 |
5 |
0.4859 % |
3,192.0 |
| Interest-Bearing |
0.00 % |
0.00 % |
0 |
0.00 |
0 |
0.0000 % |
2,513.5 |
| Perpetual-Premium |
5.45 % |
-0.26 % |
74,524 |
0.08 |
20 |
0.0582 % |
2,476.6 |
| Perpetual-Discount |
5.22 % |
5.10 % |
110,488 |
15.29 |
15 |
-0.2774 % |
2,640.2 |
| FixedReset |
4.26 % |
3.60 % |
249,810 |
16.48 |
77 |
-0.0786 % |
2,517.8 |
| Deemed-Retractible |
4.98 % |
1.46 % |
97,419 |
0.18 |
40 |
0.0745 % |
2,612.0 |
| FloatingReset |
2.57 % |
2.13 % |
64,337 |
3.50 |
5 |
0.0394 % |
2,536.4 |
| Performance Highlights |
| Issue |
Index |
Change |
Notes |
| BAM.PF.D |
Perpetual-Discount |
-3.31 % |
YTW SCENARIO
Maturity Type : Limit Maturity
Maturity Date : 2044-12-22
Maturity Price : 21.01
Evaluated at bid price : 21.01
Bid-YTW : 5.86 % |
| BAM.PR.M |
Perpetual-Discount |
-1.72 % |
YTW SCENARIO
Maturity Type : Limit Maturity
Maturity Date : 2044-12-22
Maturity Price : 21.16
Evaluated at bid price : 21.16
Bid-YTW : 5.64 % |
| BAM.PR.T |
FixedReset |
-1.64 % |
YTW SCENARIO
Maturity Type : Limit Maturity
Maturity Date : 2044-12-22
Maturity Price : 23.08
Evaluated at bid price : 23.96
Bid-YTW : 3.88 % |
| TRP.PR.A |
FixedReset |
-1.62 % |
YTW SCENARIO
Maturity Type : Limit Maturity
Maturity Date : 2044-12-22
Maturity Price : 20.07
Evaluated at bid price : 20.07
Bid-YTW : 4.12 % |
| BAM.PF.C |
Perpetual-Discount |
-1.54 % |
YTW SCENARIO
Maturity Type : Limit Maturity
Maturity Date : 2044-12-22
Maturity Price : 21.13
Evaluated at bid price : 21.13
Bid-YTW : 5.77 % |
| BAM.PR.B |
Floater |
-1.51 % |
YTW SCENARIO
Maturity Type : Limit Maturity
Maturity Date : 2044-12-22
Maturity Price : 16.30
Evaluated at bid price : 16.30
Bid-YTW : 3.22 % |
| ENB.PR.B |
FixedReset |
-1.38 % |
YTW SCENARIO
Maturity Type : Limit Maturity
Maturity Date : 2044-12-22
Maturity Price : 21.95
Evaluated at bid price : 22.20
Bid-YTW : 4.30 % |
| BAM.PR.R |
FixedReset |
-1.35 % |
YTW SCENARIO
Maturity Type : Limit Maturity
Maturity Date : 2044-12-22
Maturity Price : 23.67
Evaluated at bid price : 24.86
Bid-YTW : 3.74 % |
| POW.PR.G |
Perpetual-Premium |
-1.16 % |
YTW SCENARIO
Maturity Type : Call
Maturity Date : 2021-04-15
Maturity Price : 25.00
Evaluated at bid price : 25.95
Bid-YTW : 4.86 % |
| ENB.PR.P |
FixedReset |
-1.15 % |
YTW SCENARIO
Maturity Type : Limit Maturity
Maturity Date : 2044-12-22
Maturity Price : 21.91
Evaluated at bid price : 22.34
Bid-YTW : 4.37 % |
| GWO.PR.N |
FixedReset |
-1.00 % |
YTW SCENARIO
Maturity Type : Hard Maturity
Maturity Date : 2025-01-31
Maturity Price : 25.00
Evaluated at bid price : 19.75
Bid-YTW : 5.52 % |
| HSE.PR.A |
FixedReset |
1.07 % |
YTW SCENARIO
Maturity Type : Limit Maturity
Maturity Date : 2044-12-22
Maturity Price : 19.87
Evaluated at bid price : 19.87
Bid-YTW : 4.02 % |
| FTS.PR.J |
Perpetual-Discount |
1.62 % |
YTW SCENARIO
Maturity Type : Limit Maturity
Maturity Date : 2044-12-22
Maturity Price : 24.00
Evaluated at bid price : 24.40
Bid-YTW : 4.89 % |
| CGI.PR.D |
SplitShare |
1.75 % |
YTW SCENARIO
Maturity Type : Soft Maturity
Maturity Date : 2023-06-14
Maturity Price : 25.00
Evaluated at bid price : 25.60
Bid-YTW : 3.45 % |
| SLF.PR.G |
FixedReset |
1.93 % |
YTW SCENARIO
Maturity Type : Hard Maturity
Maturity Date : 2025-01-31
Maturity Price : 25.00
Evaluated at bid price : 21.15
Bid-YTW : 4.79 % |
| Volume Highlights |
| Issue |
Index |
Shares
Traded |
Notes |
| TD.PF.C |
FixedReset |
115,130 |
Recent new issue.
YTW SCENARIO
Maturity Type : Limit Maturity
Maturity Date : 2044-12-22
Maturity Price : 23.11
Evaluated at bid price : 24.88
Bid-YTW : 3.56 % |
| CM.PR.P |
FixedReset |
80,195 |
Recent new issue.
YTW SCENARIO
Maturity Type : Limit Maturity
Maturity Date : 2044-12-22
Maturity Price : 23.08
Evaluated at bid price : 24.79
Bid-YTW : 3.57 % |
| IAG.PR.E |
Deemed-Retractible |
49,640 |
Called for redemption effective 2014-12-31.
YTW SCENARIO
Maturity Type : Call
Maturity Date : 2015-12-31
Maturity Price : 25.75
Evaluated at bid price : 25.98
Bid-YTW : 4.81 % |
| MFC.PR.N |
FixedReset |
40,200 |
Recent new issue.
YTW SCENARIO
Maturity Type : Hard Maturity
Maturity Date : 2025-01-31
Maturity Price : 25.00
Evaluated at bid price : 24.92
Bid-YTW : 3.82 % |
| SLF.PR.G |
FixedReset |
38,668 |
Desjardins crossed 13,000 at 20.93.
YTW SCENARIO
Maturity Type : Hard Maturity
Maturity Date : 2025-01-31
Maturity Price : 25.00
Evaluated at bid price : 21.15
Bid-YTW : 4.79 % |
| TRP.PR.B |
FixedReset |
31,904 |
YTW SCENARIO
Maturity Type : Limit Maturity
Maturity Date : 2044-12-22
Maturity Price : 17.16
Evaluated at bid price : 17.16
Bid-YTW : 3.91 % |
| There were 32 other index-included issues trading in excess of 10,000 shares. |
| Wide Spread Highlights |
| Issue |
Index |
Quote Data and Yield Notes |
| BAM.PF.D |
Perpetual-Discount |
Quote: 21.01 – 21.64
Spot Rate : 0.6300
Average : 0.3861
YTW SCENARIO
Maturity Type : Limit Maturity
Maturity Date : 2044-12-22
Maturity Price : 21.01
Evaluated at bid price : 21.01
Bid-YTW : 5.86 % |
| BAM.PR.K |
Floater |
Quote: 16.42 – 17.14
Spot Rate : 0.7200
Average : 0.5232
YTW SCENARIO
Maturity Type : Limit Maturity
Maturity Date : 2044-12-22
Maturity Price : 16.42
Evaluated at bid price : 16.42
Bid-YTW : 3.19 % |
| SLF.PR.A |
Deemed-Retractible |
Quote: 24.26 – 24.78
Spot Rate : 0.5200
Average : 0.3869
YTW SCENARIO
Maturity Type : Hard Maturity
Maturity Date : 2025-01-31
Maturity Price : 25.00
Evaluated at bid price : 24.26
Bid-YTW : 5.14 % |
| PVS.PR.B |
SplitShare |
Quote: 25.31 – 25.74
Spot Rate : 0.4300
Average : 0.3039
YTW SCENARIO
Maturity Type : Hard Maturity
Maturity Date : 2019-01-10
Maturity Price : 25.00
Evaluated at bid price : 25.31
Bid-YTW : 4.09 % |
| BAM.PR.M |
Perpetual-Discount |
Quote: 21.16 – 21.50
Spot Rate : 0.3400
Average : 0.2162
YTW SCENARIO
Maturity Type : Limit Maturity
Maturity Date : 2044-12-22
Maturity Price : 21.16
Evaluated at bid price : 21.16
Bid-YTW : 5.64 % |
| HSE.PR.C |
FixedReset |
Quote: 25.04 – 25.34
Spot Rate : 0.3000
Average : 0.1805
YTW SCENARIO
Maturity Type : Limit Maturity
Maturity Date : 2044-12-22
Maturity Price : 23.17
Evaluated at bid price : 25.04
Bid-YTW : 4.40 % |