The first round of the Abitibi CDS auction showed extremely low recovery:
Credit-default swaps traders set an initial value of 3.75 cents on the dollar for bonds of an AbitibiBowater Inc. unit to settle derivatives linked to the newsprint maker that’s now in bankruptcy protection.
Royal Bank has announced:
that it expects to record a goodwill impairment charge (on both a pre and after tax basis) of approximately US$850 million for the second quarter ending April 30, 2009. While the charge will reduce second quarter reported earnings by approximately US$850 million, it is a non-cash item and an accounting adjustment, and will not affect our ongoing operations, or our Tier 1 and Total capital ratios.
It does not affect the capital ratios because goodwill is already deducted from capital. The market yawned. What a difference six months makes, eh? If this announcement had been made at the height of the panic, Royal Bank stock … might have felt some effects.
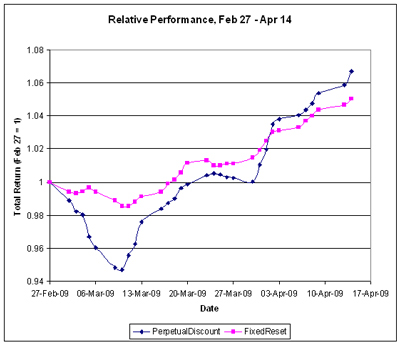
Yet another strong day on elevated volume.
| HIMIPref™ Preferred Indices These values reflect the December 2008 revision of the HIMIPref™ Indices Values are provisional and are finalized monthly |
|||||||
| Index | Mean Current Yield (at bid) |
Median YTW |
Median Average Trading Value |
Median Mod Dur (YTW) |
Issues | Day’s Perf. | Index Value |
| Ratchet | 0.00 % | 0.00 % | 0 | 0.00 | 0 | 2.0238 % | 955.6 |
| FixedFloater | 0.00 % | 0.00 % | 0 | 0.00 | 0 | 2.0238 % | 1,545.3 |
| Floater | 5.11 % | 5.13 % | 70,028 | 15.30 | 2 | 2.0238 % | 1,193.8 |
| OpRet | 5.10 % | 4.34 % | 143,663 | 3.87 | 15 | 0.2687 % | 2,131.3 |
| SplitShare | 6.67 % | 9.36 % | 47,273 | 5.64 | 3 | 0.3616 % | 1,732.9 |
| Interest-Bearing | 6.15 % | 9.71 % | 27,727 | 0.68 | 1 | 0.4115 % | 1,939.5 |
| Perpetual-Premium | 0.00 % | 0.00 % | 0 | 0.00 | 0 | 0.4645 % | 1,631.3 |
| Perpetual-Discount | 6.69 % | 6.80 % | 146,750 | 12.85 | 71 | 0.4645 % | 1,502.4 |
| FixedReset | 5.93 % | 5.38 % | 687,638 | 4.57 | 35 | 0.1668 % | 1,898.8 |
| Performance Highlights | |||
| Issue | Index | Change | Notes |
| BAM.PR.M | Perpetual-Discount | -1.52 % | YTW SCENARIO Maturity Type : Limit Maturity Maturity Date : 2039-04-17 Maturity Price : 14.28 Evaluated at bid price : 14.28 Bid-YTW : 8.44 % |
| GWO.PR.F | Perpetual-Discount | -1.34 % | YTW SCENARIO Maturity Type : Limit Maturity Maturity Date : 2039-04-17 Maturity Price : 21.41 Evaluated at bid price : 21.41 Bid-YTW : 6.97 % |
| TD.PR.Y | FixedReset | -1.26 % | YTW SCENARIO Maturity Type : Limit Maturity Maturity Date : 2039-04-17 Maturity Price : 22.74 Evaluated at bid price : 22.80 Bid-YTW : 4.20 % |
| BAM.PR.I | OpRet | -1.23 % | YTW SCENARIO Maturity Type : Soft Maturity Maturity Date : 2013-12-30 Maturity Price : 25.00 Evaluated at bid price : 24.02 Bid-YTW : 6.59 % |
| CU.PR.B | Perpetual-Discount | 1.06 % | YTW SCENARIO Maturity Type : Limit Maturity Maturity Date : 2039-04-17 Maturity Price : 23.48 Evaluated at bid price : 23.75 Bid-YTW : 6.41 % |
| MFC.PR.B | Perpetual-Discount | 1.08 % | YTW SCENARIO Maturity Type : Limit Maturity Maturity Date : 2039-04-17 Maturity Price : 17.80 Evaluated at bid price : 17.80 Bid-YTW : 6.62 % |
| NA.PR.M | Perpetual-Discount | 1.09 % | YTW SCENARIO Maturity Type : Limit Maturity Maturity Date : 2039-04-17 Maturity Price : 22.20 Evaluated at bid price : 22.30 Bid-YTW : 6.74 % |
| CU.PR.A | Perpetual-Discount | 1.10 % | YTW SCENARIO Maturity Type : Limit Maturity Maturity Date : 2039-04-17 Maturity Price : 22.77 Evaluated at bid price : 23.00 Bid-YTW : 6.40 % |
| ENB.PR.A | Perpetual-Discount | 1.12 % | YTW SCENARIO Maturity Type : Limit Maturity Maturity Date : 2039-04-17 Maturity Price : 24.05 Evaluated at bid price : 24.30 Bid-YTW : 5.74 % |
| PWF.PR.I | Perpetual-Discount | 1.13 % | YTW SCENARIO Maturity Type : Limit Maturity Maturity Date : 2039-04-17 Maturity Price : 21.50 Evaluated at bid price : 21.50 Bid-YTW : 7.02 % |
| CM.PR.H | Perpetual-Discount | 1.13 % | YTW SCENARIO Maturity Type : Limit Maturity Maturity Date : 2039-04-17 Maturity Price : 17.90 Evaluated at bid price : 17.90 Bid-YTW : 6.74 % |
| GWO.PR.H | Perpetual-Discount | 1.14 % | YTW SCENARIO Maturity Type : Limit Maturity Maturity Date : 2039-04-17 Maturity Price : 17.70 Evaluated at bid price : 17.70 Bid-YTW : 6.93 % |
| BNS.PR.L | Perpetual-Discount | 1.19 % | YTW SCENARIO Maturity Type : Limit Maturity Maturity Date : 2039-04-17 Maturity Price : 17.86 Evaluated at bid price : 17.86 Bid-YTW : 6.33 % |
| CM.PR.I | Perpetual-Discount | 1.21 % | YTW SCENARIO Maturity Type : Limit Maturity Maturity Date : 2039-04-17 Maturity Price : 17.53 Evaluated at bid price : 17.53 Bid-YTW : 6.74 % |
| IGM.PR.A | OpRet | 1.23 % | YTW SCENARIO Maturity Type : Call Maturity Date : 2009-07-30 Maturity Price : 26.00 Evaluated at bid price : 26.37 Bid-YTW : 1.39 % |
| BAM.PR.B | Floater | 1.29 % | YTW SCENARIO Maturity Type : Limit Maturity Maturity Date : 2039-04-17 Maturity Price : 8.61 Evaluated at bid price : 8.61 Bid-YTW : 5.13 % |
| IAG.PR.A | Perpetual-Discount | 1.40 % | YTW SCENARIO Maturity Type : Limit Maturity Maturity Date : 2039-04-17 Maturity Price : 15.92 Evaluated at bid price : 15.92 Bid-YTW : 7.32 % |
| GWO.PR.I | Perpetual-Discount | 1.72 % | YTW SCENARIO Maturity Type : Limit Maturity Maturity Date : 2039-04-17 Maturity Price : 16.52 Evaluated at bid price : 16.52 Bid-YTW : 6.89 % |
| CM.PR.E | Perpetual-Discount | 1.89 % | YTW SCENARIO Maturity Type : Limit Maturity Maturity Date : 2039-04-17 Maturity Price : 20.45 Evaluated at bid price : 20.45 Bid-YTW : 6.89 % |
| PWF.PR.E | Perpetual-Discount | 2.01 % | YTW SCENARIO Maturity Type : Limit Maturity Maturity Date : 2039-04-17 Maturity Price : 20.31 Evaluated at bid price : 20.31 Bid-YTW : 6.81 % |
| SLF.PR.E | Perpetual-Discount | 2.21 % | YTW SCENARIO Maturity Type : Limit Maturity Maturity Date : 2039-04-17 Maturity Price : 16.16 Evaluated at bid price : 16.16 Bid-YTW : 7.05 % |
| CL.PR.B | Perpetual-Discount | 2.45 % | YTW SCENARIO Maturity Type : Limit Maturity Maturity Date : 2039-04-17 Maturity Price : 22.32 Evaluated at bid price : 22.60 Bid-YTW : 6.99 % |
| TD.PR.Q | Perpetual-Discount | 2.56 % | YTW SCENARIO Maturity Type : Limit Maturity Maturity Date : 2039-04-17 Maturity Price : 21.96 Evaluated at bid price : 22.05 Bid-YTW : 6.38 % |
| BAM.PR.K | Floater | 2.77 % | YTW SCENARIO Maturity Type : Limit Maturity Maturity Date : 2039-04-17 Maturity Price : 8.53 Evaluated at bid price : 8.53 Bid-YTW : 5.17 % |
| BAM.PR.J | OpRet | 2.86 % | YTW SCENARIO Maturity Type : Soft Maturity Maturity Date : 2018-03-30 Maturity Price : 25.00 Evaluated at bid price : 21.60 Bid-YTW : 7.61 % |
| Volume Highlights | |||
| Issue | Index | Shares Traded |
Notes |
| RY.PR.X | FixedReset | 87,046 | Recent new issue. YTW SCENARIO Maturity Type : Call Maturity Date : 2014-09-23 Maturity Price : 25.00 Evaluated at bid price : 25.86 Bid-YTW : 5.60 % |
| RY.PR.N | FixedReset | 82,200 | TD bought 21,000 from Anonymous at 26.42. The HIMIPref™ calculation of YTW will be controversial, but it is the same situation as has been previously discussed. YTW SCENARIO Maturity Type : Limit Maturity Maturity Date : 2039-04-17 Maturity Price : 23.56 Evaluated at bid price : 26.40 Bid-YTW : 5.25 % |
| RY.PR.D | Perpetual-Discount | 72,465 | TD crossed 15,000 at 18.00. YTW SCENARIO Maturity Type : Limit Maturity Maturity Date : 2039-04-17 Maturity Price : 18.00 Evaluated at bid price : 18.00 Bid-YTW : 6.37 % |
| RY.PR.T | FixedReset | 59,436 | Scotia bought two blocks of 10,000 shares each from National, both at 25.90. YTW SCENARIO Maturity Type : Call Maturity Date : 2014-09-23 Maturity Price : 25.00 Evaluated at bid price : 25.90 Bid-YTW : 5.64 % |
| MFC.PR.D | FixedReset | 55,069 | YTW SCENARIO Maturity Type : Call Maturity Date : 2014-07-19 Maturity Price : 25.00 Evaluated at bid price : 25.70 Bid-YTW : 6.19 % |
| CM.PR.M | FixedReset | 51,520 | Desjardins bought 16,500 from RBC at 25.80. YTW SCENARIO Maturity Type : Call Maturity Date : 2014-08-30 Maturity Price : 25.00 Evaluated at bid price : 25.84 Bid-YTW : 5.95 % |
| There were 43 other index-included issues trading in excess of 10,000 shares. | |||