Accrued Interest reviews the performance of financial bonds vs. financial stocks and arrives at an interesting conclusion:
For financial stocks, the total return in percentage is graphed. What we see is that financials hit a low at -20% on March 17 (the day after the Bear/JP Morgan “merger”). At that point, the bonds of financial companies had fallen 6.5% vs. Treasuries, and high yield had fallen 10.3%. Then of course there was the rebound in April and early May, but let’s put that aside for a moment.
There are two things to notice here. First stocks, high-yield, and financial corporate bonds have all been highly correlated.
…
From May 7 to June 16, the financial corporate index had underperformed Treasury bonds by a whopping 8bps and high yield had actually outperformed by 127. From then until July 24, financial corporates underperformed Treasuries by 397bps and high-yield by 509bps.
Alright so where does this leave us? Looking in total from May 7 to July 24, financial stocks have fallen 23.6% whereas financial bonds have fallen 4.05% vs. government bonds. That’s about a 6-1 ratio. As of March 17, financial stocks had fallen 20% and financial bonds 6.5%, for a 3-1 ratio.
To me that implies that financial bonds remain overvalued vis a vie the equity.
Now, this is an empirical estimate based on not-too-many data points – only the current year-to-date is examined. I would want to see a much longer data sample before putting any credence in such a model; one not so heavily influenced by what must be regarded as one of the most severe modern-developed-market credit crunches ever experienced.
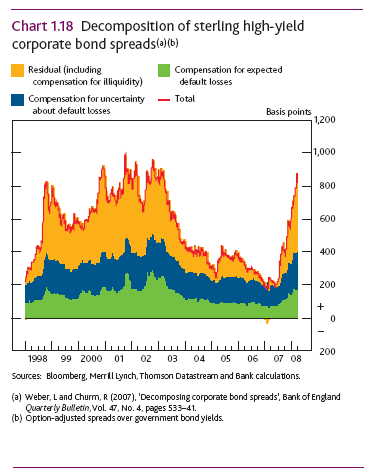
Assiduous Readers will remember my admiration of the Bank of England Financial Stability Report of April ’08 and the Figure 1.18 contained therein:
The methodology on which the charted decomposition depends was discussed in BoE Research: Decomposing Corporate Bond Spreads.
I’m all in favour of empirical analysis – a good chunk of HIMIPref™ is empirical – but such analysis becomes pretty dicey the more dissimilar the two investments being compared. And in the Accrued Interest analysis, the two series analyzed are:
- Stock Return
- Financial Bond return less Government bond return
Clearly, there is a connection; fear of extreme losses by a company will naturally affect – to a greater or lesser extent – market values of any type of investment in that company – but I want a deeper theoretical underpinning of why the two series should be connected with any sort of gearing ratio, with Accrued Interest contending he feels the 3:1 ratio of Dec 31 to March 17 being a better baseline than the 6:1 ratio of May 7 to July 24.
This might be restated as a variant of CAPM, with there being something of a conundrum in the definition of the risk-free rate; but basically, AI is claiming that a Beta of 0.33 for corporate bonds is more appropriate than a Beta of 0.16.
To my mind, I haven’t seen a good discussion of what constitutes the “liquidity” premium in the BoE research. Sure, a big chunk of it is, in fact, liquidity, but that’s kind of a touchy-feely concept used by academics who can’t bear to use the word “irrational” when describing market behaviour. What’s needed is some kind of theory that will describe both stock and bond prices in terms of an overlapping set of factors. Once such a model has been described and parameterized, perhaps we will see that a common factor has been forcing down the prices of both asset classes, perhaps with some kind of ratio attached. If we can show that this factor has a theoretical reason for being – and isn’t just a plug, useful only in describing investments in the financial sector during the period Dec 31, 2007, to July 24, 2008 – then, and only then, will we have something.
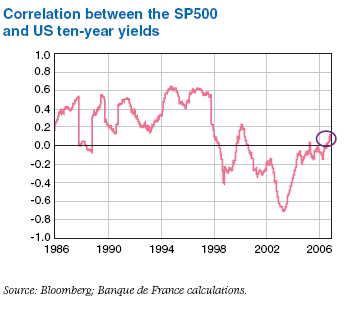
I was unable to quantify the historical relationship between financial bonds and financial stocks over time, but I was able to come up with this:
from the Bank of France Financial Stability Review of December 2006.
I am fully prepared to agree that there is a common factor between the returns of an entity’s stock and its bonds – so much is obvious! Don’t get me wrong; I certainly agree that there will be an element of corellation between financial stocks and financial bonds over time, regardless of whether this element dominates, is swamped or is amplified by other factors; I am also aware that by using the difference between financial bonds and government bonds as the return characteristic of note, AI is focussing on spreads, which will lend a great deal of orthagonalization to the picture … albeit not as much as one might think, because spreads tend to go contrary to rates.
Ortenca Kume of Robert Gordon University notes:
- Strong positive impact of leverage ratios on credit spreads
- Positive impact of the changes in leverage on the changes in credit spreads
- Strong positive relation between company’s stock volatility and credit spreads
- Positive impact of the changes in stock volatility on the changes in credit spreads
- Changes in credit spreads are significantly positively related to changes in the probability of bond prices’ jumps
- negative impact of the issue size on credit spreads
- credit spreads not significantly related to the variables of:
- free-cash flows
- return on equity
I will also note a paper by Campbell & Taksler (full paper republished by Harvard) that points out that in “the late 1990’s the US equity and corporate bond markets behaved very differently … stock prices rose strongly, while at the same time, corporate bonds performed poorly.” There is also an interesting paper by Wesley Phoa Implications of Merton Models for Corporate Bond Investors … but most of the data shows a strong corellation for junk credits. The paper looks at Nextel in detail, but for most of the period Nextel wasn’t just junk, it was distressed. Junk is really just equity dressed up as bonds, and the transition to distressed status simply adds make up to the costume. This paper from 2006 emphasizes volatility over return. And finally – for now – there is a BIS paper by Zhang, Zhou & Zhu, Explaining Credit Default Swap Spreads with Equity Volatility and Jump Risks of Individual Firms:
A structural model with stochastic volatility and jumps implies particular relationships between observed equity returns and credit spreads. This paper explores such effects in the credit default swap (CDS) market. We use a novel approach to identify the realized jumps of individual equity from high frequency data. Our empirical results suggest that volatility risk alone predicts 50% of CDS spread variation, while jump risk alone forecasts 19%. After controlling for credit ratings, macroeconomic conditions, and firms’ balance sheet information, we can explain 77% of the total variation. Moreover, the marginal impacts of volatility and jump measures increase dramatically from investment grade to high-yield entities. The estimated nonlinear effects of volatility and jumps are in line with the model impliedrelationships between equity returns and credit spreads.
Finally, I will refer to Accrued Interest‘s post, A disturbance in the Force, January 4, 2008, in which he published the following graph:
and commented:
From my seat, watching corporate bond spreads widen dramatically over the last 6 months, you’d certainly think recession is on the horizon. In fact, if you draw a horizontal line from where we are now in corporate spreads, you’d see that we’ve rarely been wider than current levels. We are wider than the worst points during the 1991 recession and 2001 recession, although we did touch a bit wider during 2002.
And yet the stock market is very near all-time highs. I did this graph up through 12/31, so the S&P would be a bit lower. But the basic story would be exactly the same: the stock and bond markets don’t agree about where we’re going next.
There are some logical reasons why stocks and bonds can diverge. One is that companies are increasing leverage. So equity returns might increase but bond risk rises. That’s not happening right now. Financial companies have gone into capital preservation mode, and all companies are finding the bond market quite inhospitable.
Expectations of a “gearing factor” that may be used by itself to evaluate financial stocks and bonds as rich/cheap against each other will require a correlation that is large, positive and stable. I find it a little hard to believe and want to see more data! I will also note that, as shown in the very hastily prepared literature survey above, the academics are plumping for volatility rather than performance as the equity characteristic of importance to bond spreads – which makes sense when you think about it terms of individual investors.
For instance, say each investor is characterized on a scale of 1-5, 1 being “raging bull” and 5 being an apocalyptionist. At any time, the universe of investors (dollar weighted!) will be “3”, since if it isn’t then the market level will adjust until they do.
A high volatility environment will result when the distribution of these views is flatter than normal; i.e., there are more 1s and 5s than there are in a normal distribution. The volatility will result from the marginal traders amongst the 1s and 5s temporarily gaining ascendency over their mirrors for a short period of time.
It makes sense that such a high-volatility environment will see increased spreads on corporates: if you’re a raging bull, you’re not going to bother with bonds and if you’re an apocalyptionist you’re going to be buying governments.
Or so goes my mapping of the statistics onto individual behavior, anyway!
For my own part, I suggest that spreads on financials are too wide, not too tight. It takes two to make a market!
Speaking of spreads on financials, PerpetualDiscounts had a good day today, up 0.6031% to yield 6.34%, interest equivalent 8.88%, about 268bp over the long corporates yield of 6.20%. In terms of total return, we are just a little below the closing value of July 9, down 3.67% on the month-to-date, but up 4.81% from the low of July 16. Which gives you a rough idea of just how low the low was!
| Note that these indices are experimental; the absolute and relative daily values are expected to change in the final version. In this version, index values are based at 1,000.0 on 2006-6-30 |
| Index |
Mean Current Yield (at bid) |
Mean YTW |
Mean Average Trading Value |
Mean Mod Dur (YTW) |
Issues |
Day’s Perf. |
Index Value |
| Ratchet |
N/A |
N/A |
N/A |
N/A |
0 |
N/A |
N/A |
| Fixed-Floater |
4.68% |
4.37% |
66,759 |
16.41 |
6 |
+0.3068% |
1,089.1 |
| Floater |
4.12% |
4.15% |
58,100 |
17.10 |
3 |
+0.8437% |
895.4 |
| Op. Retract |
5.00% |
4.49% |
128,465 |
3.05 |
17 |
-0.1067% |
1,039.6 |
| Split-Share |
5.37% |
6.11% |
61,235 |
4.49 |
14 |
+0.2761% |
1,031.1 |
| Interest Bearing |
6.14% |
5.97% |
40,672 |
3.67 |
3 |
+0.0001% |
1,120.7 |
| Perpetual-Premium |
6.12% |
6.08% |
68,994 |
10.65 |
4 |
+0.3508% |
984.8 |
| Perpetual-Discount |
6.28% |
6.34% |
225,468 |
13.43 |
67 |
+0.6031% |
845.0 |
| Major Price Changes |
| Issue |
Index |
Change |
Notes |
| BAM.PR.O |
OpRet |
-1.9149% |
Now with a pre-tax bid-YTW of 7.06% based on a bid of 23.05 and optionCertainty 2013-6-30 at 25.00. Compare with BAM.PR.H (6.50% to 2012-3-30), BAM.PR.I (6.72% to 2013-12-30) and BAM.PR.J (7.03% to 2018-3-30) … and consider the rather odd report in the comments to July 25! |
| POW.PR.C |
PerpetualDiscount |
-1.8014% |
Now with a pre-tax bid-YTW of 6.54% based on a bid of 22.35 and a limitMaturity. |
| ELF.PR.G |
PerpetualDiscount |
-1.4277% |
Now with a pre-tax bid-YTW of 7.25% based on a bid of 16.57 and a limitMaturity. |
| PWF.PR.L |
PerpetualDiscount |
+1.1224% |
Now with a pre-tax bid-YTW of 6.48% based on a bid of 19.82 and a limitMaturity. |
| POW.PR.D |
PerpetualDiscount |
+1.1276% |
Now with a pre-tax bid-YTW of 6.40% based on a bid of 19.73 and a limitMaturity. |
| BCE.PR.R |
FixFloat |
+1.1558% |
|
| CM.PR.E |
PerpetualDiscount |
+1.2432% |
Now with a pre-tax bid-YTW of 6.94% based on a bid of 20.36 and a limitMaturity. |
| BCE.PR.Z |
FixFloat |
+1.2503% |
|
| BNA.PR.C |
SplitShare |
-1.3476% |
Asset coverage of 3.2+:1 as of June 30, according to the company. Now with a pre-tax bid-YTW of 8.76% based on a bid of 17.79 and a hardMaturity 2019-1-10 at 25.00. Compare with BNA.PR.A (6.12% to 2010-9-30) and BNA.PR.B (8.56% to 2016-3-25). |
| SLF.PR.D |
PerpetualDiscount |
+1.2550% |
Now with a pre-tax bid-YTW of 6.35% based on a bid of 27.75 and a limitMaturity. |
| MFC.PR.B |
PerpetualDiscount |
+1.2749% |
Now with a pre-tax bid-YTW of 5.94% based on a bid of 19.86 and a limitMaturity. |
| TCA.PR.X |
PerpetualDiscount |
+1.2876% |
Now with a pre-tax bid-YTW of 5.92% based on a bid of 47.20 and a limitMaturity. |
| BMO.PR.H |
PerpetualDiscount |
+1.3796% |
Now with a pre-tax bid-YTW of 6.35% based on a bid of 21.31 and a limitMaturity. |
| SLF.PR.C |
PerpetualDiscount |
+1.4327% |
Now with a pre-tax bid-YTW of 6.37% based on a bid of 17.70 and a limitMaturity. |
| PWF.PR.E |
PerpetualDiscount |
+1.4412% |
Now with a pre-tax bid-YTW of 6.33% based on a bid of 21.82 and a limitMaturity. |
| HSB.PR.D |
PerpetualDiscount |
+1.4737% |
Now with a pre-tax bid-YTW of 6.57% based on a bid of 19.28 and a limitMaturity. |
| CM.PR.G |
PerpetualDiscount |
+1.6021% |
Now with a pre-tax bid-YTW of 6.93% based on a bid of 19.66 and a limitMaturity. |
| RY.PR.F |
PerpetualDiscount |
+1.6468% |
Now with a pre-tax bid-YTW of 6.23% based on a bid of 17.90 and a limitMaturity. |
| SLF.PR.B |
PerpetualDiscount |
+1.8757% |
Now with a pre-tax bid-YTW of 6.40% based on a bid of 19.01 and a limitMaturity. |
| PWF.PR.H |
PerpetualDiscount |
+1.8826% |
Now with a pre-tax bid-YTW of 6.36% based on a bid of 22.73 and a limitMaturity. |
| PWF.PR.F |
PerpetualDiscount |
+1.9249% |
Now with a pre-tax bid-YTW of 6.09% based on a bid of 21.71 and a limitMaturity. |
| CU.PR.B |
PerpetualPremium |
+2.2032% |
Now with a pre-tax bid-YTW of 6.09% based on a bid of 25.05 and a limitMaturity. |
| BAM.PR.B |
Floater |
+2.3392% |
|
| ELF.PR.F |
PerpetualDiscount |
+2.3517% |
Now with a pre-tax bid-YTW of 7.00% based on a bid of 19.15 and a limitMaturity. |
| CM.PR.D |
PerpetualDiscount |
+2.4878% |
Now with a pre-tax bid-YTW of 6.90% based on a bid of 21.01 and a limitMaturity. |
| IAG.PR.A |
PerpetualDiscount |
+3.2544% |
Now with a pre-tax bid-YTW of 6.68% based on a bid of 17.45 and a limitMaturity. |
| Volume Highlights |
| Issue |
Index |
Volume |
Notes |
| BCE.PR.A |
FixFloat |
253,800 |
Nesbitt crossed two tranches of 100,000 and one block of 50,000, all at 24.45. |
| BMO.PR.L |
PerpetualDiscount |
231,000 |
Nesbitt crossed 200,000 at 23.80. RBC crossed 30,000 at the same price. Now with a pre-tax bid-YTW of 6.28% based on a bid of 23.81 and a limitMaturity. |
| CM.PR.A |
OpRet |
193,950 |
Nesbitt crossed 30,000 & 100,000, both at 25.80; CIBC crossed 55,000 at the same price. Now with a pre-tax bid-YTW of 1.96% based on a bid of 25.78 and a call 2008-11-30 at 25.50. |
| SLF.PR.D |
PerpetualDiscount |
97,784 |
CIBC crossed 87,300 at 17.54. Now with a pre-tax bid-YTW of 6.35% based on a bid of 17.75 and a limitMaturity. |
| BMO.PR.J |
PerpetualDiscount |
74,200 |
Nesbitt crossed blocks of 25,000 and 15,000 at 18.40. CIBC crossed 25,000 at the same price. Now with a pre-tax bid-YTW of 6.28% based on a bid of 18.30 and a limitMaturity. |
There were eightteen other index-included $25-pv-equivalent issues trading over 10,000 shares today.