The Bank for International Settlements has released a paper by Patrick McGuire and Goetz von Peter titled The US dollar shortage in global banking and the international policy response:
Among the policy responses to the global financial crisis, the international provision of US dollars via central bank swap lines stands out. This paper studies the build-up of stresses on banks’ balance sheets that led to this coordinated policy response. Using the BIS international banking statistics, we reconstruct the worldwide consolidated balance sheets of the major national banking systems. This allows us to investigate the structure of banks’ global operations across their offices in various countries, shedding light on how their international asset positions are funded across currencies and counterparties. The analysis first highlights why a country’s “national balance sheet”, a residency-based measure, can be a misleading guide to where the vulnerabilities faced by that country’s national banking system (or residents) lie. It then focuses on banking systems’ consolidated balance sheets, and shows how the growth (since 2000) in European and Japanese banks’ US dollar assets produced structural US dollar funding requirements, setting the stage for the dollar shortage when interbank and swap markets became impaired.
The swap lines arranged by the Fed (reported on PrefBlog on 2008-9-29) have been a topic of great fascination for me as the details have been explained; most recently in the BIS Quarterly Review of March 2009.
We find that, since 2000, the Japanese and the major European banking systems took on increasingly large net (assets minus liabilities) on-balance sheet positions in foreign currencies, particularly in US dollars. While the associated currency exposures were presumably hedged off-balance sheet, the build-up of net foreign currency positions exposed these banks to foreign currency funding risk, or the risk that their funding positions (FX swaps) could not be rolled over.
…
This yields a lower-bound estimate of banks’ US dollar funding gap – the amount of short-term US dollar funding banks require – measured here as the net amount of US dollars channelled to non-banks. By this estimate, European banks’ need for short-term US dollar funding was substantial at the onset of the crisis, at least $1.0–1.2 trillion by mid-2007.
Events during the crisis led to severe disruptions in banks’ sources of short-term funding. Interbank markets seized up, and dislocations in FX swap markets made it even more expensive to obtain US dollars via swaps. Banks’ funding pressures were compounded by instability in non-bank sources of funds as well, notably dollar money market funds and dollar-holding central banks. The market stress meant that the effective maturity of banks’ US dollar funding shortened just as that of their US dollar assets lengthened, since many assets became difficult to sell in illiquid markets.
…
Consider a bank that seeks to diversify internationally, or expand its presence in a specific market abroad. This bank will have to finance a particular portfolio of loans and securities, some of which are denominated in foreign currencies (eg a German bank’s investment in US dollar-denominated structured finance products). The bank can finance these foreign currency positions in several ways:
- 1. The bank can borrow domestic currency, and convert it in a straight FX spot transaction to purchase the foreign asset in that currency.
- 2. It can also use FX swaps to convert its domestic currency liabilities into foreign currency and purchase the foreign assets.
- 3. Alternatively, the bank can borrow foreign currency, either from the interbank market, from non-bank market participants or from central banks.
The first option produces no subsequent foreign currency needs, but exposes the bank to currency risk, as the on-balance sheet mismatch between foreign currency assets and domestic currency liabilities remains unhedged. Our working assumption is that banks employ FX swaps and forwards to hedge any on-balance sheet currency mismatch.
So in other words, it’s just another wrinkle on the same old story: borrow short + lend long = funding risk. But it’s a good wrinkle!
Why is funding risk in foreign currencies of special interest? Banks also face the risks inherent in transforming maturities in their domestic currency market, of course. …However, in a purelydomestic banking context, the central bank can act as lender of last resort and provide sufficient liquidity to eliminate a domestic funding shortage; doing so is both time-honoured practice (Bagehot (1873), Goodhart (1995)) as well as optimal policy (Allen and Gale (1998), Diamond and Rajan (2006)). By contrast, central banks cannot create foreign currencies; their ability to meet banks’ demand for foreign currencies is constrained by the exchange rate regime or limited to available FX reserves (Chang and Velasco (2000, 2001), Obstfeld et al (2009)). Banks’ foreign currency requirements may therefore have to be met from international sources (Fischer (1999), Mishkin (1999)).
It gets better:
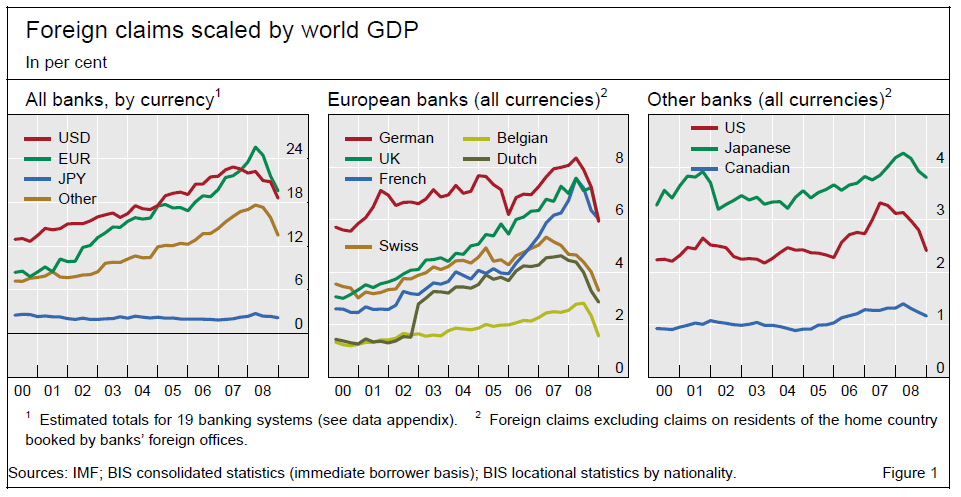
The origins of the US dollar shortage during the crisis are linked to the expansion since 2000 in banks’ international balance sheets. The outstanding stock of banks’ foreign claims grew from $10 trillion at the beginning of 2000 to $34 trillion by end-2007, a significant expansion even when scaled by global economic activity (Figure 1, left panel).…For example, Swiss banks’ foreign claims jumped from roughly five times Swiss nominal GDP in 2000 to more than seven times in mid-2007 (Table 1). Dutch, French, German and UK banks’ foreign claims expanded considerably as well. In contrast, Canadian, Japanese and US banks’ foreign claims grew in absolute terms over the same period, but did not significantly outpace the growth in domestic or world GDP (Figure 1, right Panel).
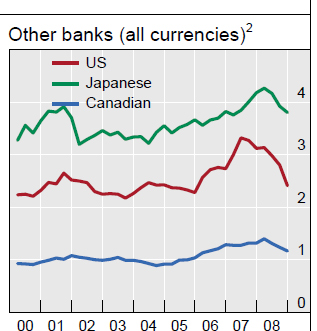 This is the Right Panel.
Click for the whole thingThe lack of foreign funding pressure might be a more precise indication of why Canadian banks were resilient during the crisis.
Then Bad Things happened:
European banks’ funding difficulties were compounded by instability in the non-bank sources of funds as well. Money market funds, facing large redemptions following the failure of Lehman Brothers, withdrew from bank-issued paper, threatening a wholesale run on banks (Baba et al (2009)). Less abruptly, a portion of the US dollar foreign exchange reserves that central banks had placed with commercial banks was withdrawn during the course of the crisis. In particular, some monetary authorities in emerging markets reportedly withdrew placements in support of their own banking systems in need of US dollars.
Market conditions during the crisis have made it difficult for banks to respond to these funding pressures by reducing their US dollar assets. While European banks held a sizeable share of their net US dollar investments as (liquid) US government securities (Figure 5, bottom right panel), other claims on non-bank entities – such as structured finance products – have been harder to sell into illiquid markets without realising large losses. Other factors also hampered deleveraging of US dollar assets: banks brought off-balance sheet vehicles back onto their balance sheets and prearranged credit commitments were drawn.
But … Fed to the rescue!
On 13 October 2008, the swap lines between the Federal Reserve and the Bank of England, the ECB and the Swiss National Bank became unlimited to accommodate any quantity of US dollar funding demanded. The swap lines provided these central banks with ammunition beyond their existing foreign exchange reserves (Obstfeld et al (2009)), which in mid-2007 amounted to $294 billion for the euro area, Switzerland and the United Kingdom combined, an order of magnitude smaller than our lower-bound estimate of the US dollar funding gap.
In providing US dollars on a global scale, the Federal Reserve effectively engaged in international lending of last resort. The swap network can be understood as a mechanism by which the Federal Reserve extends loans, collateralised by foreign currencies, to other central banks, which in turn make these funds available through US dollar auctions in their respective jurisdictions.33 This made US dollar liquidity accessible to commercial banks around the world, including those that have no US subsidiaries or insufficient eligible collateral to borrow directly from the Federal Reserve System.
The authors conclude, in part:
What pushed the system to the brink was not cross-currency funding per se, but rather too many large banks employing funding strategies in the same direction, the funding equivalent of a “crowded trade”. Only when examined at the aggregate level can such vulnerabilities be identified. By quantifying the US dollar overhang on non-US banks’ global balance sheets, this paper contributes to a better understanding of why the extraordinary international policy response was necessary.
and why it took the form of a global network of central bank swap lines.