Index Construction / Reporting

Index Performance: June 2009

Performance of the HIMIPref™ Indices for June, 2009, was:

Total Return
Index Performance
June 2009
Three Months
to
June 30, 2009
Ratchet -8.20% * +36.36% *
FixFloat +1.86% +51.30% **
Floater -8.20% +36.36%
OpRet +1.93% +6.52%
SplitShare +4.02% +15.63%
Interest +2.03% +4.77%
PerpetualPremium +1.66%*** +15.34%***
PerpetualDiscount +1.66% +15.34%
FixedReset +2.70% +11.39%
* The last member of the RatchetRate index was transferred to Scraps at the February, 2009, rebalancing; subsequent performance figures are set equal to the Floater index
** The last member of the FixedFloater index was transferred to Scraps at the February, 2009, rebalancing. Performance figures to 2009-5-29 are set equal to the Floater index. The FixedFloater index acquired a member on 2009-5-29.
*** The last member of the PerpetualPremium index was transferred to PerpetualDiscount at the October, 2008, rebalancing; subsequent performance figures are set equal to the PerpetualDiscount index
Passive Funds (see below for calculations)
CPD +1.38% +12.73%
DPS.UN +2.28% +17.17%
Index
BMO-CM 50 +1.60% +13.49%

The major indices have managed to stagger into the black over the trailing 12-month period. Full speed ahead!


Click for big

And yes, what you see is true: PerpetualDiscounts have outperformed FixedResets over the past twelve months. June 2008, now dropped from the trailing year’s return was a horrible, horrible month for them.

Claymore has published NAV and distribution data (problems with the page in IE8 can be kludged by using compatibility view) for its exchange traded fund (CPD) and I have derived the following table:

CPD Return, 1- & 3-month, to June, 2009
Date NAV Distribution Return for Sub-Period Monthly Return
March 31, 2009 14.28    
April 30 15.27 0.00   +6.93%
May 29, 2009 15.88 0.00   +3.99%
June 25 15.88 0.2100 +1.32% +1.38%
June 30, 2009 15.89   +0.06%
Quarterly Return +12.73%

The DPS.UN NAV for June 24 has been published so we may calculate the June returns (approximately!) for this closed end fund. I am rather annoyed that this calculation will not include the distribution with the June 26 ex-Date!

DPS.UN NAV Return, June-ish 2009
Date NAV Distribution Return for period
May 27, 2009 18.18    
Estimated May Ending Stub -0.19% *
June 24, 2009 18.56   +2.09%
Estimated June Ending Stub** +0.375%
Estimated June Return +2.28%
** CPD had a NAV of $16.04 on June 24, paid $0.21 June 25 with a NAV of 15.88 and a NAV of $15.89 on June 30. The return for the period was therefore +0.375%. This figure is added to the DPS.UN period return to arrive at an estimate for the calendar month.
* CPD had a NAV of $15.85 on May 27 and a NAV of $15.88 on May 29. The return for the period was therefore +0.19%. This figure is subtracted from the DPS.UN period return to arrive at an estimate for the calendar month.
The June return for DPS.UN’s NAV is therefore the product of three period returns, -0.19%, +2.09% and +0.375% to arrive at an estimate for the calendar month of +2.28%

Now, to see the DPS.UN quarterly NAV approximate return, we refer to the calculations for April and May:

DPS.UN NAV Returns, three-month-ish to end-June-ish, 2009
April-ish +7.72%
May-ish +6.35%
June-ish +2.28%
Three-months-ish +17.17%
Market Action

July 2, 2009

Interesting news from Peru today:

IShares, the world’s biggest provider of exchange-traded funds, reached an agreement with Peru’s pension funds that will increase the assets of the first Peruvian exchange traded fund in the U.S., according to Gonzalo Presa, a pension fund manager at Lima-based AFP Horizonte.

The Peruvian pension funds, known as AFPs, will swap shares of local companies in exchange for shares in the iShares MSCI All Peru Capped Index Fund, said Presa. BlackRock Inc. agreed to buy Barclays Plc’s global fund unit, including iShares, for $13.5 billion in June.

“We’ll give Barclays shares to build up this ETF,” Presa, who helps manage $3.4 billion as head of local equities at AFP Horizonte, said in a phone interview. “The idea is to issue $300 million in new shares in two, three weeks.”

Presa said it would be “very difficult” for Barclays to acquire the shares in the local market because of the lack of liquidity.

There’s no information given as to whether the pension funds got a sweetheart deal on fees.

I hadn’t known this in advance, but to my astonishment there was no early close of the bond markets today:

“SIFMA’s Board of Directors and membership reassessed the early close policy, recognizing that additional access to the liquidity provided by our members would benefit all market participants. The interconnected, global nature of the fixed income markets and the significant–and nearly round the clock–access to liquidity that many members provide would be enhanced by this change. Since shortened trading days may limit the liquidity window and create possible market risks which could be mitigated with a full functioning fixed income market on days when liquidity could be normal, we have determined eliminating some of the early closes is a better solution,” said Randy Snook, executive vice president at SIFMA. “This step will allow firms of all sizes around the globe to have access to fixed income liquidity on an almost continuous basis on most trading days of the year.”

Early close recommendations will be eliminated for the following holidays:

· Friday before Martin Luther King, Jr. Day
· Friday before President’s Day
· Day before Independence Day
· Friday before Labor Day
· Day before Columbus Day
· Day before Veterans Day
· Day before Thanksgiving

I’ve heard a rumour that this is TARP-related, which may well be true, but I’m glad of it anyway. Ever since I got into this business, I’ve been amazed that the highest paid profession on earth has had a half-day in advance of long weekends. All the B-School Babies will be whining about having to put in a full day’s work, poor things.

The SEC may be preparing a short-selling cosmetic makeover:

Given the climate in Washington, as well as the running suspicion of Wall Street, new rules seem inevitable, analysts say. Mary L. Schapiro, chairwoman of the S.E.C., has said that considering new rules restricting short-selling is a priority. Members of Congress like Barney Frank, the Massachusetts Democrat who heads the House financial services committee, are calling for quick action.

For the moment, the most likely outcome may be for the S.E.C. to reinstate a rule that the commission itself abolished with a unanimous vote in 2007, under its previous chairman, Christopher S. Cox. Known as the uptick rule, it would bar investors from shorting a stock until its price ticks at least a penny above its previous trading price.

But current and former S.E.C. staff members appear to doubt that reinstating the uptick rule would have much of an effect on trading. Some say the change would be merely cosmetic.

Sally Miller, a spokesman for the A.B.A., said the member banks thought there was clear link between the market turmoil and the rule change. “All of a sudden subsequent to 2007 they can see all their stocks going haywire,” Ms. Miller said. “It’s cause and effect.”

I wonder what Ms. Miller actually said, in context. She surely can’t be claiming that the most important determinant of bank equity price volatility in the 2007-09 period was the removal of the uptick rule!

Still and all, I wonder what BIS thinks of it. Their annual report contains an argument in favour of short sales as a bubble-controller.

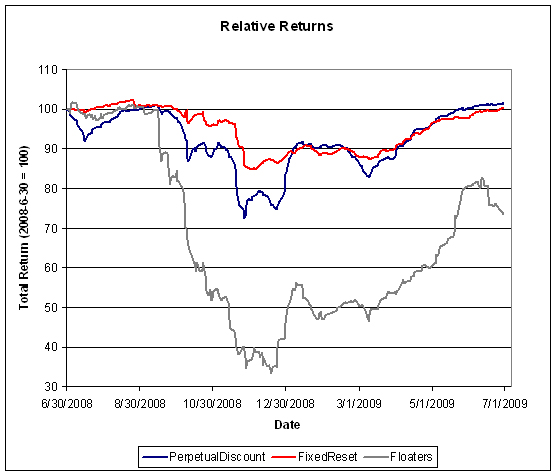
Continued strength in FixedResets brings the yield-to-worst down to 4.55%! Holy smokes, how low can they go?

HIMIPref™ Preferred Indices
These values reflect the December 2008 revision of the HIMIPref™ Indices

Values are provisional and are finalized monthly
Index Mean
Current
Yield
(at bid)
Median
YTW
Median
Average
Trading
Value
Median
Mod Dur
(YTW)
Issues Day’s Perf. Index Value
Ratchet 0.00 % 0.00 % 0 0.00 0 0.6522 % 1,194.5
FixedFloater 7.06 % 5.46 % 35,241 16.37 1 0.3909 % 2,137.7
Floater 3.19 % 3.68 % 82,780 18.15 3 0.6522 % 1,492.2
OpRet 4.98 % 3.41 % 118,629 0.88 15 0.0575 % 2,209.8
SplitShare 5.76 % 6.38 % 69,320 4.19 3 -0.3160 % 1,894.9
Interest-Bearing 0.00 % 0.00 % 0 0.00 0 0.0575 % 2,024.2
Perpetual-Premium 0.00 % 0.00 % 0 0.00 0 -0.0938 % 1,747.3
Perpetual-Discount 6.31 % 6.38 % 161,955 13.40 71 -0.0938 % 1,609.2
FixedReset 5.60 % 4.55 % 483,655 4.34 40 0.3709 % 2,040.4
Performance Highlights
Issue Index Change Notes
W.PR.H Perpetual-Discount -2.22 % YTW SCENARIO
Maturity Type : Limit Maturity
Maturity Date : 2039-07-02
Maturity Price : 20.71
Evaluated at bid price : 20.71
Bid-YTW : 6.68 %
ELF.PR.F Perpetual-Discount -1.52 % YTW SCENARIO
Maturity Type : Limit Maturity
Maturity Date : 2039-07-02
Maturity Price : 18.18
Evaluated at bid price : 18.18
Bid-YTW : 7.33 %
MFC.PR.A OpRet -1.50 % YTW SCENARIO
Maturity Type : Soft Maturity
Maturity Date : 2015-12-18
Maturity Price : 25.00
Evaluated at bid price : 24.98
Bid-YTW : 4.16 %
PWF.PR.F Perpetual-Discount -1.28 % YTW SCENARIO
Maturity Type : Limit Maturity
Maturity Date : 2039-07-02
Maturity Price : 20.06
Evaluated at bid price : 20.06
Bid-YTW : 6.68 %
CM.PR.G Perpetual-Discount -1.13 % YTW SCENARIO
Maturity Type : Limit Maturity
Maturity Date : 2039-07-02
Maturity Price : 20.92
Evaluated at bid price : 20.92
Bid-YTW : 6.47 %
SLF.PR.A Perpetual-Discount -1.12 % YTW SCENARIO
Maturity Type : Limit Maturity
Maturity Date : 2039-07-02
Maturity Price : 17.72
Evaluated at bid price : 17.72
Bid-YTW : 6.76 %
BAM.PR.B Floater -1.01 % YTW SCENARIO
Maturity Type : Limit Maturity
Maturity Date : 2039-07-02
Maturity Price : 10.74
Evaluated at bid price : 10.74
Bid-YTW : 3.68 %
W.PR.J Perpetual-Discount 1.06 % YTW SCENARIO
Maturity Type : Limit Maturity
Maturity Date : 2039-07-02
Maturity Price : 21.76
Evaluated at bid price : 22.01
Bid-YTW : 6.38 %
TD.PR.K FixedReset 1.10 % YTW SCENARIO
Maturity Type : Call
Maturity Date : 2014-08-30
Maturity Price : 25.00
Evaluated at bid price : 27.65
Bid-YTW : 4.33 %
BNS.PR.K Perpetual-Discount 1.15 % YTW SCENARIO
Maturity Type : Limit Maturity
Maturity Date : 2039-07-02
Maturity Price : 20.31
Evaluated at bid price : 20.31
Bid-YTW : 6.03 %
BAM.PR.O OpRet 1.19 % YTW SCENARIO
Maturity Type : Option Certainty
Maturity Date : 2013-06-30
Maturity Price : 25.00
Evaluated at bid price : 23.88
Bid-YTW : 6.34 %
BNS.PR.O Perpetual-Discount 1.36 % YTW SCENARIO
Maturity Type : Limit Maturity
Maturity Date : 2039-07-02
Maturity Price : 23.62
Evaluated at bid price : 23.80
Bid-YTW : 5.99 %
BNS.PR.X FixedReset 1.42 % YTW SCENARIO
Maturity Type : Call
Maturity Date : 2014-05-25
Maturity Price : 25.00
Evaluated at bid price : 27.80
Bid-YTW : 4.02 %
NA.PR.N FixedReset 1.54 % YTW SCENARIO
Maturity Type : Limit Maturity
Maturity Date : 2039-07-02
Maturity Price : 25.62
Evaluated at bid price : 25.67
Bid-YTW : 4.66 %
RY.PR.P FixedReset 1.73 % YTW SCENARIO
Maturity Type : Call
Maturity Date : 2014-03-26
Maturity Price : 25.00
Evaluated at bid price : 27.67
Bid-YTW : 3.96 %
TRI.PR.B Floater 2.98 % YTW SCENARIO
Maturity Type : Limit Maturity
Maturity Date : 2039-07-02
Maturity Price : 15.55
Evaluated at bid price : 15.55
Bid-YTW : 2.54 %
Volume Highlights
Issue Index Shares
Traded
Notes
MFC.PR.E FixedReset 85,595 Recent new issue.
YTW SCENARIO
Maturity Type : Call
Maturity Date : 2014-10-19
Maturity Price : 25.00
Evaluated at bid price : 25.30
Bid-YTW : 5.48 %
BMO.PR.P FixedReset 81,135 Recent new issue.
YTW SCENARIO
Maturity Type : Limit Maturity
Maturity Date : 2039-07-02
Maturity Price : 23.22
Evaluated at bid price : 25.30
Bid-YTW : 4.90 %
SLF.PR.C Perpetual-Discount 67,360 Scotia crossed 63,500 at 16.80.
YTW SCENARIO
Maturity Type : Limit Maturity
Maturity Date : 2039-07-02
Maturity Price : 16.77
Evaluated at bid price : 16.77
Bid-YTW : 6.69 %
RY.PR.G Perpetual-Discount 61,780 YTW SCENARIO
Maturity Type : Limit Maturity
Maturity Date : 2039-07-02
Maturity Price : 18.26
Evaluated at bid price : 18.26
Bid-YTW : 6.26 %
BNS.PR.N Perpetual-Discount 57,359 YTW SCENARIO
Maturity Type : Limit Maturity
Maturity Date : 2039-07-02
Maturity Price : 21.39
Evaluated at bid price : 21.71
Bid-YTW : 6.15 %
MFC.PR.D FixedReset 51,633 National Bank bought two blocks from anonymous, 10,000 and 13,500 shares, both at 27.15.
YTW SCENARIO
Maturity Type : Call
Maturity Date : 2014-07-19
Maturity Price : 25.00
Evaluated at bid price : 27.06
Bid-YTW : 4.85 %
There were 37 other index-included issues trading in excess of 10,000 shares.
MAPF

MAPF Portfolio Composition: June 2009

Trading activity increased in June, with portfolio turnover of about 130%, as the market extended its gains.

Trades were, as ever, triggered by a desire to exploit transient mispricing in the preferred share market (which may the thought of as “selling liquidity”), rather than any particular view being taken on market direction, sectoral performance or credit anticipation.

MAPF Sectoral Analysis 2009-6-30
HIMI Indices Sector Weighting YTW ModDur
Ratchet 0% N/A N/A
FixFloat 0% N/A N/A
Floater 0% N/A N/A
OpRet 0% N/A N/A
SplitShare 10.7% (-0.4) 10.25% 6.99
Interest Rearing 0% N/A N/A
PerpetualPremium 0.0% N/A N/A
PerpetualDiscount 72.2 (+2.4) 6.58% 13.13
Fixed-Reset 11.5% (-1.0) 4.85% 4.28
Scraps (OpRet) 5.6% (-0.6) 11.54% 5.27
Cash +0.1% (-0.5) 0.00% 0.00
Total 100% 7.05% 11.00
Totals and changes will not add precisely due to rounding. Bracketted figures represent change from May month-end. Cash is included in totals with duration and yield both equal to zero.

The “total” reflects the un-leveraged total portfolio (i.e., cash is included in the portfolio calculations and is deemed to have a duration and yield of 0.00.). MAPF will often have relatively large cash balances, both credit and debit, to facilitate trading. Figures presented in the table have been rounded to the indicated precision.

Not much change in the sectoral distribution!

Credit distribution is:

MAPF Credit Analysis 2009-6-30
DBRS Rating Weighting
Pfd-1 0.4% (-40.0)
Pfd-1(low) 67.2% (+43.4)
Pfd-2(high) 13.6% (+4.1)
Pfd-2 0% (0)
Pfd-2(low) 13.2% (-6.5)
Pfd-3(high) 5.6% (-0.6)
Cash +0.1% (-0.5)
Totals will not add precisely due to rounding. Bracketted figures represent change from May month-end.

The dramatic change in reported credit quality is largely due to the DBRS Mass Downgrade of Banks. At month-end, the fund held positions affected by this change summarized as follows:

MAPF Month-End Positions
Affect by DBRS Mass Downgrade
Old
Rating
New
Rating
Fraction of
Portfolio
Pfd-1 Pfd-1(low) 24.4%
Pfd-1 Pfd-2(high) 2.5%

Of the remainder, a significant contributor was a series of trades in the FixedReset sector:

Trades Contributing to
the Shift from Pfd-1 to Pfd-1(low)
June, 2009
Date HSB.PR.E CM.PR.M BMO.PR.O MFC.PR.D
5/29
Bid
26.65 26.68 26.76 26.56
6/3 Sold
26.92
Bought
26.85
   
6/11 Sold
26.93
  Bought
27.02
 
6/25   Sold
26.93
  Bought
26.55
6/30     Sold
27.56
Bought
27.10
6/30
Closing Bid
27.36 27.00 27.44 27.01
Dividends
Ex-Date
0.3762
6/11
0.65445
6/25
   
This is an attempt to show fairly the effect of numerous trades in tabular form. The trades shown are not necessarily precise dollar-for-dollar swaps. Trade details will be released on the main MAPF web page shortly.

The fund does not set any targets for overall credit quality; trades are executed one by one. Variances in overall credit will be constant as opportunistic trades are executed. The overall credit quality of the portfolio is now superior to the credit quality of CPD at August month-end (when adjusted for the downgrades of BCE and the banks).

Claymore provides the following ratings breakdown:

Ratings Breakdown
as of 12/31/08
Pfd-1 61.15%
Pfd-2 23.26%
Pfd-3 15.60%

Two events have occurred since the Dec. 31 calculation date of CPD’s credit quality:

Liquidity Distribution is:

MAPF Liquidity Analysis 2009-6-30
Average Daily Trading Weighting
<$50,000 3.3% (+1.4)
$50,000 – $100,000 22.2% (+3.1)
$100,000 – $200,000 25.9% (-5.7)
$200,000 – $300,000 15.1% (-16.4)
>$300,000 33.5% (+18.0)
Cash +0.1% (-0.5)
Totals will not add precisely due to rounding. Bracketted figures represent change from May month-end.

MAPF is, of course, Malachite Aggressive Preferred Fund, a “unit trust” managed by Hymas Investment Management Inc. Further information and links to performance, audited financials and subscription information are available the fund’s web page. A “unit trust” is like a regular mutual fund, but is sold by offering memorandum rather than prospectus. This is cheaper, but means subscription is restricted to “accredited investors” (as defined by the Ontario Securities Commission) and those who subscribe for $150,000+. Fund past performances are not a guarantee of future performance. You can lose money investing in MAPF or any other fund.

A similar portfolio composition analysis has been performed on The Claymore Preferred Share ETF (symbol CPD) as of August 29. When comparing CPD and MAPF:

  • MAPF credit quality is better
  • MAPF liquidity is similar
  • MAPF Yield is higher
  • Weightings in
    • MAPF is more exposed to PerpetualDiscounts
    • MAPF is much less exposed to Operating Retractibles
    • MAPF is more exposed to SplitShares
    • MAPF is less exposed to FixFloat / Floater / Ratchet
    • MAPF weighting in FixedResets is similar
Issue Comments

Best & Worst Performers: June 2009

These are total returns, with dividends presumed to have been reinvested at the bid price on the ex-date. The list has been restricted to issues in the HIMIPref™ indices.

June 2009
Issue Index DBRS Rating Monthly Performance Notes (“Now” means “June 30”)
TRI.PR.B Floater Pfd-2(low) -10.91% Was the third-best performer in May, with a return of +31.15% last month.
BAM.PR.B Floater Pfd-2(low) -7.01% Was the best performer in May, with a total return of +35.13%
BAM.PR.K Floater Pfd-2(low) -6.29% Was the second-best performer in May, with a return of +34.25% in that month.
CIU.PR.A Perpetual-Discount Pfd-2(high) -4.18% Now with a pre-tax bid-YTW of 6.35% based on a bid of 18.35 and a limitMaturity.
MFC.PR.C Perpetual-Discount Pfd-1(low) -2.52% Now with a pre-tax bid-YTW of 6.52% based on a bid of 17.44 and a limitMaturity.
BAM.PR.I OpRet Pfd-2(low) +5.62% Now with a pre-tax bid-YTW of 5.59% based on a bid of 24.95 and a softMaturity 2013-12-30 at 25.00.
BAM.PR.N PerpetualDiscount Pfd-2(low) +7.69% Now with a pre-tax bid-YTW of 7.68% based on a bid of 15.60 and a limitMaturity.
BAM.PR.M Perpetual-Discount Pfd-2(low) +9.11% Now with a pre-tax bid-YTW of 7.56% based on a bid of 15.86 and a limitMaturity.
IAG.PR.A Perpetual-Discount Pfd-2(high) +9.55% This was the worst performer in May and the best performer in April. Notoriously volatile. Now with a pre-tax bid-YTW of 6.61% based on a bid of 17.55 and a limitMaturity.
BNA.PR.C SplitShare Pfd-2(low) +11.46% Now with a pre-tax bid-YTW of 10.48% based on a bid of 16.05 and a hardMaturity 2019-1-10 at 25.00.

What can I say? The Floaters Index currently has three members. The top three spots in May were occupied by Floaters; the bottom three spots in June were occupied by Floaters.

Issue Comments

RPB.PR.A Edges Closer to Default

Connor Clark has announced:

that Lear Corporation has reached agreement on a consensual debt restructuring under court supervision pursuant to a voluntary bankruptcy filing under Chapter 11 of the United States Bankruptcy Code. This plan is expected to constitute a credit event under the credit linked note (“CLN”) issued by TD Bank to which the Company has exposure.

Given the unprecedented economic downturn and corresponding decline in global automobile production volumes, as well as continued difficult conditions in credit markets generally, Lear’s Board of Directors concluded that this action was the fastest and most effective way to de-lever its capital structure.

The recovery rate for ROC Pref III Corp. is fixed at 40%. As a result, the Lear credit event is expected to reduce the number of additional defaults that ROC Pref III Corp. can sustain before the payment of $25.00 per Preferred Share at maturity is adversely affected by 1.0 to 1.6.

They provide a table:

RPB.PR.A
Additional Reference
Defaults to
2012-3-23
Estimated RPB.PR.A
Maturity Value
1.6 or less $25.00
2.0 $20.09
3.0 $7.99
3.7 Zip Zero Zilch

There are 127 names in the reference portfolio, with 6.0 defaults as of 2009-3-31; on that date there were 17 non-defaulted junk names. The death watch continues.

RPB.PR.A was last mentioned on PrefBlog in connection with December’s credit event for Tribune Corp..

RPB.PR.A is not tracked by HIMIPref™.

Issue Comments

MST.PR.A Delisted, Redeemed in Full at Par

On May 27, Sentry Select announced:

that the units of Select 50 S-1 Income Trust, Sentry Select Focused Growth & Income Trust, Pro-Vest Growth & Income Fund and the capital units and preferred securities of the Multi Select Income Trust (collectively, the “Units”) will be voluntarily delisted from the Toronto Stock Exchange at the close of business on Tuesday, June 2, 2009. The delisting of the Units is being done in preparation for the merger of each of the Funds into Sentry Select Canadian Income Fund (collectively, the “Mergers”), which are expected to occur on or about June 12, 2009.

… and on June 16 announced:

that the mergers of Sentry Select 40 Split Income Trust (“40 Split”), Pro-Vest Growth & Income Trust (“Pro-Vest”), Multi-Select Income Trust (“Multi-Select”), Sentry Select Focused Growth & Income Trust (“Focused Growth”) and Select 50 S-1 Income Trust (“Select 50”) (collectively the “Terminating Funds”) with Sentry Select Canadian Income Fund (the “Continuing Fund”) (the “Mergers”), became effective on June 12, 2009. The Mergers were approved at special meetings of unitholders of the Terminating Funds held concurrently on May 20, 2009.

The Terminating Funds transferred all of their assets to the Continuing Fund in exchange for Series A units of the Continuing Fund and the assumption by the Continuing Fund of all the liabilities of the Terminating Funds. Each unitholder of the Terminating Funds, except unitholders of 40 Split, received Series A units of the Continuing Fund having the same aggregate net asset value as their units of the Terminating Funds as of the close of business on June 11, 2009.

Each unitholder of Multi-Select received 0.3819 Series A units of the Continuing Fund in exchange for each unit of Multi-Select.

DBRS has announced that it:

has today discontinued the rating on the Preferred Securities issued by Multi Select Income Trust (the Trust). On June 12, 2009, the Capital Units issued by the Trust were merged along with units from other funds into the Sentry Select Canadian Income Fund. The Preferred Securities had been scheduled for final redemption on September 30, 2009, but were redeemed at the initial issue price of $10 per security on the date of the merger.

MST.PR.A was tracked by HIMIPref™ and was last mentioned on PrefBlog when it was downgraded to Pfd-3(high) by DBRS. At the time of redemption it was in the “Scraps” index due to credit concerns.

Index Construction / Reporting

HIMIPref™ Index Rebalancing: June 2009

HIMI Index Changes, June 30, 2009
Issue From To Because
STW.PR.A InterestBearing Scraps Volume
ACO.PR.A Scraps OpRet Volume

CU.PR.B continued its teasing ways, closing at precisely 25.00 bid on June 30 … when the bid is exactly 25.00, I do not move the issue between Premium and Discount, regardless of which direction this might be. Maybe next month!

Sadly, the lack of volume in STW.PR.A (which is due to mature soon anyway) means there are no members of the InterestBearing index.

There were the following intra-month changes:

HIMI Index Changes during June 2009
Issue Action Index Because
MFC.PR.E Add FixedReset New issue
BAM.PR.P Add FixedReset New issue
BMO.PR.P Add FixedReset New issue
NTL.PR.F Delete Scraps Suspended / Delisted
NTL.PR.G Delete Scraps Suspended / Delisted
Market Action

June 30, 2009

Sorry, folks! The June 30 closing price data is not yet available from the TSX, so I can’t close off the day.

When I have the data, you’ll get the data!

Update: Continued heavy trading and positive performance closed the month. Preliminary index figures indicate a gain for PerpetualDiscounts of 1.66% on the month, while FixedResets returned +2.70%.

PerpetualDiscounts closed the month yielding 6.36%, equivalent to 8.90% at the standard 1.4x equivalency factor. This compares to Long Corporates at about 6.4%, so the pre-tax interest-equivalent spread is near-as-dammit to 250bp, as declines in PerpetualDiscount yields did not keep pace with the extraordinary strength of the long corporate bonds … they returned +6.14% for the month and are now +17.55% YTD, which ain’t bad!

HIMIPref™ Preferred Indices
These values reflect the December 2008 revision of the HIMIPref™ Indices

Values are provisional and are finalized monthly
Index Mean
Current
Yield
(at bid)
Median
YTW
Median
Average
Trading
Value
Median
Mod Dur
(YTW)
Issues Day’s Perf. Index Value
Ratchet 0.00 % 0.00 % 0 0.00 0 -0.1628 % 1,186.7
FixedFloater 7.08 % 5.49 % 35,110 16.33 1 0.1305 % 2,129.4
Floater 3.21 % 3.63 % 83,213 18.22 3 -0.1628 % 1,482.6
OpRet 4.95 % 3.53 % 120,027 0.89 14 -0.0758 % 2,208.6
SplitShare 5.74 % 6.24 % 69,944 4.20 3 0.0151 % 1,900.9
Interest-Bearing 5.98 % -0.66 % 23,573 0.08 1 0.0998 % 2,023.1
Perpetual-Premium 0.00 % 0.00 % 0 0.00 0 0.2313 % 1,748.9
Perpetual-Discount 6.31 % 6.36 % 161,926 13.44 71 0.2313 % 1,610.8
FixedReset 5.62 % 4.61 % 484,161 4.35 40 0.1825 % 2,032.8
Performance Highlights
Issue Index Change Notes
TD.PR.Q Perpetual-Discount -1.66 % YTW SCENARIO
Maturity Type : Limit Maturity
Maturity Date : 2039-06-30
Maturity Price : 22.96
Evaluated at bid price : 23.11
Bid-YTW : 6.17 %
W.PR.J Perpetual-Discount -1.27 % YTW SCENARIO
Maturity Type : Limit Maturity
Maturity Date : 2039-06-30
Maturity Price : 21.52
Evaluated at bid price : 21.78
Bid-YTW : 6.45 %
CU.PR.A Perpetual-Discount 1.22 % YTW SCENARIO
Maturity Type : Limit Maturity
Maturity Date : 2039-06-30
Maturity Price : 23.69
Evaluated at bid price : 24.00
Bid-YTW : 6.11 %
IAG.PR.C FixedReset 1.34 % YTW SCENARIO
Maturity Type : Call
Maturity Date : 2014-01-30
Maturity Price : 25.00
Evaluated at bid price : 26.51
Bid-YTW : 4.75 %
BMO.PR.H Perpetual-Discount 1.43 % YTW SCENARIO
Maturity Type : Limit Maturity
Maturity Date : 2039-06-30
Maturity Price : 21.74
Evaluated at bid price : 22.05
Bid-YTW : 6.08 %
HSB.PR.D Perpetual-Discount 1.43 % YTW SCENARIO
Maturity Type : Limit Maturity
Maturity Date : 2039-06-30
Maturity Price : 19.80
Evaluated at bid price : 19.80
Bid-YTW : 6.36 %
TD.PR.P Perpetual-Discount 1.47 % YTW SCENARIO
Maturity Type : Limit Maturity
Maturity Date : 2039-06-30
Maturity Price : 22.02
Evaluated at bid price : 22.12
Bid-YTW : 6.04 %
BAM.PR.M Perpetual-Discount 1.54 % YTW SCENARIO
Maturity Type : Limit Maturity
Maturity Date : 2039-06-30
Maturity Price : 15.86
Evaluated at bid price : 15.86
Bid-YTW : 7.56 %
RY.PR.H Perpetual-Discount 1.60 % YTW SCENARIO
Maturity Type : Limit Maturity
Maturity Date : 2039-06-30
Maturity Price : 23.91
Evaluated at bid price : 24.11
Bid-YTW : 5.94 %
GWO.PR.I Perpetual-Discount 2.62 % YTW SCENARIO
Maturity Type : Limit Maturity
Maturity Date : 2039-06-30
Maturity Price : 17.99
Evaluated at bid price : 17.99
Bid-YTW : 6.30 %
Volume Highlights
Issue Index Shares
Traded
Notes
TD.PR.O Perpetual-Discount 191,794 TD bought 25,000 from anonymous at 20.09; then National Bank crossed 122,700 at 20.10.
YTW SCENARIO
Maturity Type : Limit Maturity
Maturity Date : 2039-06-30
Maturity Price : 20.15
Evaluated at bid price : 20.15
Bid-YTW : 6.14 %
GWO.PR.X OpRet 118,532 Nesbitt crossed 10,000 at 26.00; RBC crossed 100,000 at the same price.
YTW SCENARIO
Maturity Type : Call
Maturity Date : 2010-10-30
Maturity Price : 25.67
Evaluated at bid price : 26.00
Bid-YTW : 3.70 %
TD.PR.M OpRet 102,170 RBC crossed 100,000 at 26.20.
YTW SCENARIO
Maturity Type : Call
Maturity Date : 2010-05-30
Maturity Price : 25.75
Evaluated at bid price : 26.17
Bid-YTW : 3.60 %
MFC.PR.E FixedReset 85,935 Recent new issue.
YTW SCENARIO
Maturity Type : Call
Maturity Date : 2014-10-19
Maturity Price : 25.00
Evaluated at bid price : 25.50
Bid-YTW : 5.29 %
TD.PR.S FixedReset 65,322 RBC bought 10,000 from anonymous at 25.00; then another 14,000 at the same price; then bought 10,200 from National at the same price again.
YTW SCENARIO
Maturity Type : Limit Maturity
Maturity Date : 2039-06-30
Maturity Price : 24.90
Evaluated at bid price : 24.95
Bid-YTW : 4.35 %
BMO.PR.P FixedReset 65,257 Recent new issue.
YTW SCENARIO
Maturity Type : Limit Maturity
Maturity Date : 2039-06-30
Maturity Price : 23.22
Evaluated at bid price : 25.30
Bid-YTW : 4.90 %
There were 58 other index-included issues trading in excess of 10,000 shares.
Interesting External Papers

The Optimal Level of Deposit Insurance Coverage

The Boston Fed has released a working paper by Michael Manz, The Optimal Level of Deposit Insurance Coverage, in which a model of depositor behaviour leads to some interesting conclusions:

The model derived in this paper allows for a rigorous analysis of partial deposit insurance. The benefits of insurance involve eliminating inefficient withdrawals and bank runs due to noisy information and coordination failures, whereas the drawbacks consist of suppressing efficient withdrawals and of inducing excessive risk taking. A hitherto hardly noticed conclusion is that a high level of coverage can even be detrimental if bank risk is exogenous, because it undermines the occurrence of efficient bank runs. An extended version of the model shows that systemic risk calls for a higher level of deposit insurance, albeit only for systemically relevant banks from which contagion emanates, and not for the institutions that are potentially affected by contagion.

A vital contribution of the model is to provide comparative statics of the optimal level of coverage. In particular, the results imply that while tightening liquidity requirements is a substitute for deposit insurance, increasing transparency is not. Rather, the optimal coverage increases with the quality of the information available to depositors. Perhaps surprisingly, the degree of deposit insurance should not vary with expectations regarding the development of the real sector. This suggests that countries that in the past turned to increased or even unlimited deposit insurance as a reaction to a crisis, such as Japan, Turkey, or the United States, would do well to pause for thought on whether this is the right measure to strengthen their banking systems. The model also demonstrates why the presence of large creditors with uninsured claims calls for a lower level of insurance and why a high coverage is foremost in the interest of bankers and uninsured lenders. Moreover, it is consistent with small banks being particularly active lobbyists in favor of extending deposit insurance.

Another key advantage of the model is its applicability to various policy issues. In practice, only a small, albeit growing, number of countries maintaining deposit insurance require bank customers to coinsure a proportion of their deposits. According to the model, however, an optimal design of protection should build on coinsurance rather than on setting caps on insured deposits. It further indicates that deposit insurance becomes redundant in combination with full bailouts or optimal lending of last resort. While an unconditional bailout policy is about as inefficient as it can get, an optimal LolR policy combined with perfect public disclosure comes closest to the first best outcome in terms of welfare. Yet such an optimal policy, which requires protection to be contingent on bank solvency, seems far more demanding and hence less realistic in practice than unconditional deposit insurance. If regulators or central banks cannot precisely assess whether a bank is solvent, interventions are likely to be a mixture of the benchmark policies considered. Investigating these cases opens an interesting avenue for future research.

Miscellaneous News

Moody's Contemplates Downgrading Bank Prefs / IT1C / Sub-Debt

Moody’s has announced:

In Canada, proposed changes to the methodology used by Moody’s Investors Service to rate bank subordinated capital (i.e., subordinated debt, preferred shares, and other hybrid securities) could lead to ratings being lowered by an average of two to three notches on $65 billion of rated instruments.
Neither bank financial strength nor deposit ratings would change as a result of implementing Moody’s bank subordinated capital ratings proposal, the rating agency said. “These potential rating actions do not reflect on the underlying financial strength of the Canadian banking system, which Moody’s views as one of the soundest globally,” said Moody’s Senior Vice President, Peter Routledge. “Rather, they would capture the risk that subordinated capital generally does not benefit from systemic support and take into consideration the risk posed by each instrument’s features.”

Before the current financial crisis, Moody’s had assumed that any support provided by national governments and central banks to shore up a troubled bank and restore investor confidence would not just benefit the bank’s senior creditors but, at least to some extent, investors in its subordinated capital.

The rating agency notes that with recent government interventions oustide Canada, investors in certain types of subordinated capital have been left to absorb losses. In some cases, support packages have been contingent upon the banks’ suspension of coupon payments on these instruments as a means to preserve capital.

In other words, this is the same rationale as that used by DBRS when it mass-downgraded bank preferreds and IT1C.