DBRS has announced:
has today downgraded the Preferred Shares issued by AIC Global Financial Split Corp. (the Company) to Pfd-2 (low) from Pfd-2 (high) with a Stable trend. The rating had been placed Under Review with Developing Implications on March 19, 2008.
In 2004, the Company issued 1.6 million Preferred Shares at $10 each and 1.6 million of Class A Shares at $15 each. The initial structure provided downside protection of approximately 58% (net of expenses).
The net proceeds from the offering were invested in a portfolio (the Portfolio) that included common equities selected from leading bank-based, insurance-based and investment management–based financial services companies with strong credit ratings. The Portfolio is actively managed by AIC Investment Services (the Manager) to invest in companies that have at least a US$1 billion market capitalization. The weighted-average credit rating of the Portfolio will be at least equivalent to “A” at all times. To mitigate net asset value (NAV) volatility relating to foreign currency exchange fluctuation, it is expected that a minimum of 90% of all foreign content will be hedged back to the Canadian dollar for the life of the transaction.
Holders of the Preferred Shares receive fixed cumulative quarterly dividends yielding 5.25% per annum. The Company aims to provide holders of the Class A Shares with monthly distributions targeted at 8.0% per annum.
There is an asset coverage test in place that does not permit the Company to make monthly distributions to the Class A Shares if the dividends on the Preferred Shares are in arrears or if the net asset value (NAV) of the Portfolio is less than $15 after giving effect to such distributions. Since the NAV has been greater than $15 since inception, the Class A Shareholders have received a consistent dividend on their investment. As a result, the Company requires greater returns from capital appreciation to maintain the current NAV of the Company.
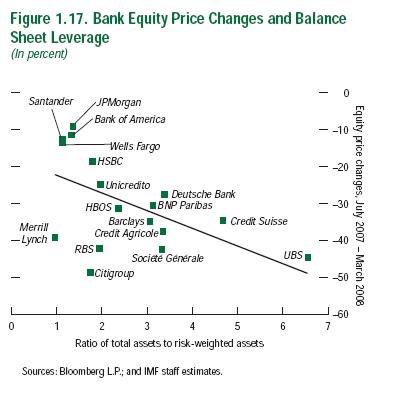
In December 2006, when the Preferred Shares were upgraded to Pfd-2 (high), the NAV was $27.50, providing downside protection of about 64%. Since then, the NAV has declined 33% to $18.45, and the current downside protection available to the Preferred Shares is approximately 46%. The credit quality of the Portfolio is strong and globally diversified, but the NAV of the Portfolio has experienced downward pressure due to its concentration in the financial industry.
The downgrade of the Preferred Shares is based on the reduced asset coverage available to cover repayment of principal.
The redemption date for both classes of shares issued is May 31, 2011.
The mass review of Financial Split-Shares was discussed on Prefblog on March 19. The 2-notch downgrade of this issue – with asset coverage of 1.8+:1 and only 3 years (and a bit) to maturity signals a new get-tough attitude by DBRS.
ASC.PR.A is tracked by HIMIPref™; it was removed from the SplitShares index at the end of April 2007, due to volume concerns. It had been upgraded to Pfd-2(high) in late 2006.