MAPF

MAPF Performance: January 2010

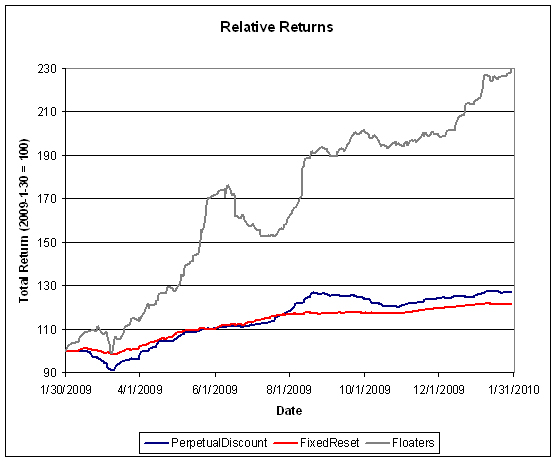
The fund performed well in January, outperforming the indices and the closed end funds by a most satisfactory margin.

The fund’s Net Asset Value per Unit as of the close January 29 was $10.7610.

Returns to January 29, 2010
Period MAPF Index CPD
according to
Claymore
One Month +1.84% +0.61% +%
Three Months +7.27% +5.05% +%
One Year +53.33% +25.22% +%
Two Years (annualized) +26.80% +3.87% +% *
Three Years (annualized) +17.39% +0.71%  
Four Years (annualized) +14.31% +1.58%  
Five Years (annualized) +12.55% +1.96%  
Six Years (annualized) +12.40% +2.39%  
Seven Years (annualized) +14.40% +3.26%  
Eight Years (annualized) +12.88% +3.21%  
The Index is the BMO-CM “50”
MAPF returns assume reinvestment of dividends, and are shown after expenses but before fees.
CPD Returns are for the NAV and are after all fees and expenses. CPD returns to January 29, 2010, are not yet available on the Claymore website.
* CPD does not directly report its two-year returns. The figure shown is the product of the current one-year return and the similar figure reported for January 2009.
Figures for Omega Preferred Equity (which are after all fees and expenses) for 1-, 3- and 12-months are +0.8%, +4.7% and +23.3%, respectively, according to Morningstar after all fees & expenses
Figures for Jov Leon Frazer Preferred Equity Fund Class I Units (which are after all fees and expenses) for 1-, 3- and 12-months are +0.46%, +3.93 & N/A, respectively, according to Morningstar and the Globe and Mail
Figures for AIC Preferred Income Fund (which are after all fees and expenses) for 1-, 3- and 12-months are +-0.1%, +3.1% & N/A, respectively

MAPF returns assume reinvestment of dividends, and are shown after expenses but before fees. Past performance is not a guarantee of future performance. You can lose money investing in Malachite Aggressive Preferred Fund or any other fund. For more information, see the fund’s main page.

I am very pleased with the returns over the past year, but implore Assiduous Readers not to project this level of outperformance for the indefinite future. The year in the preferred share market was filled with episodes of panic and euphoria, together with many new entrants who do not appear to know what they are doing; perfect conditions for a disciplined quantitative approach.

Sometimes everything works … sometimes the trading works, but sectoral shifts overwhelm the increment … sometimes nothing works. The fund seeks to earn incremental return by selling liquidity (that is, taking the other side of trades that other market participants are strongly motivated to execute), which can also be referred to as ‘trading noise’. There have been a lot of strongly motivated market participants in the past year, generating a lot of noise! The conditions of the past year may never be repeated in my lifetime … but the fund will simply attempt to make trades when swaps seem profitable, whether that implies monthly turnover of 10% or 100%.

There’s plenty of room for new money left in the fund. Just don’t expect the current level of outperformance every year, OK? While I will continue to exert utmost efforts to outperform, it should be borne in mind that beating the index by 500bp represents a good year, and there will almost inevitably be periods of underperformance in the future.

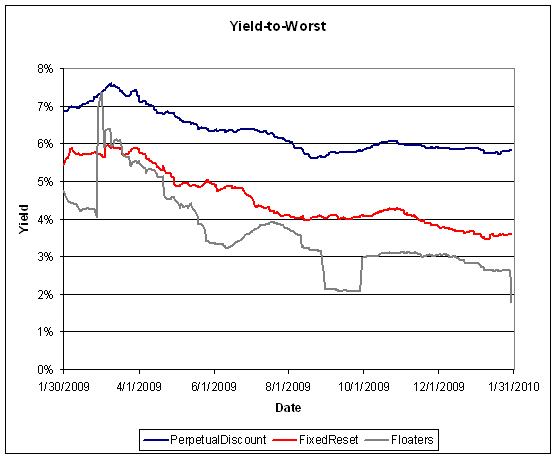
The yields available on high quality preferred shares remain elevated, which is reflected in the current estimate of sustainable income.

Calculation of MAPF Sustainable Income Per Unit
Month NAVPU Portfolio
Average
YTW
Leverage
Divisor
Securities
Average
YTW
Capital
Gains
Multiplier
Sustainable
Income
per
current
Unit
June, 2007 9.3114 5.16% 1.03 5.01% 1.1883 0.3926
September 9.1489 5.35% 0.98 5.46% 1.1883 0.4203
December, 2007 9.0070 5.53% 0.942 5.87% 1.1883 0.4448
March, 2008 8.8512 6.17% 1.047 5.89% 1.1883 0.4389
June 8.3419 6.034% 0.952 6.338% 1.1883 $0.4449
September 8.1886 7.108% 0.969 7.335% 1.1883 $0.5054
December, 2008 8.0464 9.24% 1.008 9.166% 1.1883 $0.6206
March 2009 $8.8317 8.60% 0.995 8.802% 1.1883 $0.6423
June 10.9846 7.05% 0.999 7.057% 1.1883 $0.6524
September 12.3462 6.03% 0.998 6.042% 1.1883 $0.6278
December 2009 10.5662 5.74% 0.981 5.851% 1.0000 $0.6182
January 2010 10.7610 5.81% 1.001 5.804% 1.0000 $0.6246
NAVPU is shown after quarterly distributions of dividend income and annual distribution of capital gains.
Portfolio YTW includes cash (or margin borrowing), with an assumed interest rate of 0.00%
The Leverage Divisor indicates the level of cash in the account: if the portfolio is 1% in cash, the Leverage Divisor will be 0.99
Securities YTW divides “Portfolio YTW” by the “Leverage Divisor” to show the average YTW on the securities held; this assumes that the cash is invested in (or raised from) all securities held, in proportion to their holdings.
The Capital Gains Multiplier adjusts for the effects of Capital Gains Dividends. On 2009-12-31, there was a capital gains distribution of $1.989262 which is assumed for this purpose to have been reinvested at the final price of $10.5662. Thus, a holder of one unit pre-distribution would have held 1.1883 units post-distribution; the CG Multiplier reflects this to make the time-series comparable. Note that Dividend Distributions are not assumed to be reinvested.
Sustainable Income is the resultant estimate of the fund’s dividend income per current unit, before fees and expenses. Note that a “current unit” includes reinvestment of prior capital gains; a unitholder would have had the calculated sustainable income with only, say, 0.9 units in the past which, with reinvestment of capital gains, would become 1.0 current units.

As has been previously discussed, the fund has a position in the high-yielding split-share BNA.PR.C, about half of which was sold in November in a swap for the slightly lower-yielding PerpetualDiscount BAM.PR.N. Additionally, the fund has a position in the high-yielding Operating Retractible YPG.PR.B, about half of which was swapped into the lower-yielding YPG.PR.D in January. Both BNA.PR.C and YPG.PR.B are scheduled to mature (or to be retracted) in the future, hence the sustainability of sustainable yield calculated while incorporating their contribution is somewhat suspect, as discussed in August, 2008.

Significant positions were also held in Fixed-Reset issues on January 29; all of which currently have their yields calculated with the presumption that they will be called by the issuers at par at the first possible opportunity. This presents another complication in the calculation of sustainable yield.

However, if the entire portfolio except for the PerpetualDiscounts were to be sold and reinvested in these issues, the yield of the portfolio would be the 5.89% shown in the MAPF Portfolio Composition: January 2010 analysis(which is in excess of the 5.81% index yield on January 29). Given such reinvestment, the sustainable yield would be $10.7610 * 0.0589 = $0.6338 whereas a similar calculation for December results in $10.5662 * 0.0597 = $0.6308.

Different assumptions lead to different results from the calculation, but the overall positive trend is apparent. I’m very pleased with the results! It will be noted that if there was no trading in the portfolio, one would expect the sustainable yield to be constant (before fees and expenses). The success of the fund’s trading is showing up in

  • the very good performance against the index
  • the long term increases in sustainable income per unit

As has been noted, the fund has maintained a credit quality equal to or better than the index; outperformance is due to constant exploitation of trading anomalies.

Again, there are no predictions for the future! The fund will continue to trade between issues in an attempt to exploit market gaps in liquidity, in an effort to outperform the index and keep the sustainable income per unit – however calculated! – growing.

Market Action

February 2, 2010

Paul Krugman writes an op-ed in the New York Times, Good and Boring, lauding the resilience of Canadian banks:

Canada has an independent Financial Consumer Agency, and it has sharply restricted subprime-type lending.

Above all, Canada’s experience seems to support those who say that the way to keep banking safe is to keep it boring — that is, to limit the extent to which banks can take on risk.

More specifically, Canada has been much stricter about limiting banks’ leverage, the extent to which they can rely on borrowed funds. It has also limited the process of securitization, in which banks package and resell claims on their loans outstanding — a process that was supposed to help banks reduce their risk by spreading it, but has turned out in practice to be a way for banks to make ever-bigger wagers with other people’s money.

Actually, the financial reform bill that the House of Representatives passed in December would significantly Canadianize the U.S. system. It would create an independent Consumer Financial Protection Agency, it would establish limits on leverage, and it would limit securitization by requiring that lenders hold on to some of their loans.

I suggest that Dr. Krugman has selected features of Canada’s system to further his domestic political arguments. The IMF has published suggestions that a critical factor is the stable deposit base of Canadian banks – which, I believe, is related to their national scope and oligopolistic position. Another major factor has been the banks’ control over the mortgage market – limited competition (no GSE’s here in Canada!) has allowed them to extract rents from hapless Canadian mortgagees, leaving much less necessity of reaching for yield. The sole Canadian bank that did fail during the crisis, Dundee Bank, failed because its lack of mortgage distribution channels encouraged it to go out on a limb provided by ABCP.

Paul Volcker testified to the Senate banking committee today:

Given strong legislative direction, bank supervisors should be able to appraise the nature of those trading activities and contain excesses. An analysis of volume relative to customer relationships and of the relative volatility of gains and losses would go a long way toward informing such judgments. For instance, patterns of exceptionally large gains and losses over a period of time in the “trading book” should raise an examiner’s eyebrows. Persisting over time, the result should be not just raised eyebrows but substantially raised capital requirements.

This is much more in line with my thinking than a flat prohibition, which will be subject to interpretation.

More generally, proprietary trading activity should not be able to profit from knowledge of customer trades.

That’s what the SEC’s supposed to be worrying about.

Mr. Volcker also noted that he had attached an essay to his official testimony, but I can’t find it!

A relatively directionless day for Canadian preferred shares, with PerpetualDiscounts losing 5bp and FixedResets gaining 1bp on moderate volume.

HIMIPref™ Preferred Indices
These values reflect the December 2008 revision of the HIMIPref™ Indices

Values are provisional and are finalized monthly
Index Mean
Current
Yield
(at bid)
Median
YTW
Median
Average
Trading
Value
Median
Mod Dur
(YTW)
Issues Day’s Perf. Index Value
Ratchet 3.13 % 3.83 % 28,844 20.03 1 2.0869 % 1,766.8
FixedFloater 5.62 % 3.69 % 35,458 19.36 1 0.5714 % 2,814.6
Floater 2.10 % 1.76 % 39,883 23.13 4 0.6847 % 2,189.2
OpRet 4.84 % -4.75 % 105,842 0.09 13 0.0797 % 2,322.0
SplitShare 6.34 % 3.81 % 146,621 0.08 2 -0.3917 % 2,120.4
Interest-Bearing 0.00 % 0.00 % 0 0.00 0 0.0797 % 2,123.3
Perpetual-Premium 5.74 % 5.57 % 74,172 2.21 7 0.0564 % 1,892.1
Perpetual-Discount 5.79 % 5.82 % 170,031 14.16 69 -0.0541 % 1,822.4
FixedReset 5.43 % 3.63 % 317,616 3.80 42 0.0122 % 2,178.2
Performance Highlights
Issue Index Change Notes
BMO.PR.H Perpetual-Discount -1.27 % YTW SCENARIO
Maturity Type : Limit Maturity
Maturity Date : 2040-02-02
Maturity Price : 22.59
Evaluated at bid price : 23.28
Bid-YTW : 5.67 %
CIU.PR.A Perpetual-Discount -1.27 % YTW SCENARIO
Maturity Type : Limit Maturity
Maturity Date : 2040-02-02
Maturity Price : 20.99
Evaluated at bid price : 20.99
Bid-YTW : 5.58 %
RY.PR.A Perpetual-Discount -1.04 % YTW SCENARIO
Maturity Type : Limit Maturity
Maturity Date : 2040-02-02
Maturity Price : 20.02
Evaluated at bid price : 20.02
Bid-YTW : 5.57 %
TRI.PR.B Floater 1.15 % YTW SCENARIO
Maturity Type : Limit Maturity
Maturity Date : 2040-02-02
Maturity Price : 21.82
Evaluated at bid price : 22.06
Bid-YTW : 1.76 %
BAM.PR.B Floater 1.29 % YTW SCENARIO
Maturity Type : Limit Maturity
Maturity Date : 2040-02-02
Maturity Price : 15.70
Evaluated at bid price : 15.70
Bid-YTW : 2.52 %
BAM.PR.E Ratchet 2.09 % YTW SCENARIO
Maturity Type : Limit Maturity
Maturity Date : 2040-02-02
Maturity Price : 25.00
Evaluated at bid price : 18.10
Bid-YTW : 3.83 %
Volume Highlights
Issue Index Shares
Traded
Notes
GWO.PR.E OpRet 199,230 Nesbitt crossed blocks of 170,000 and 25,000 shares, both at 25.61.
YTW SCENARIO
Maturity Type : Call
Maturity Date : 2010-04-30
Maturity Price : 25.25
Evaluated at bid price : 25.65
Bid-YTW : -0.21 %
PWF.PR.I Perpetual-Discount 113,800 RBC crossed 60,100 at 24.93, then Desjardins crossed 50,000 at 24.95.
YTW SCENARIO
Maturity Type : Limit Maturity
Maturity Date : 2040-02-02
Maturity Price : 24.51
Evaluated at bid price : 24.85
Bid-YTW : 6.07 %
RY.PR.A Perpetual-Discount 61,901 Nesbitt crossed 34,000 at 20.24.
YTW SCENARIO
Maturity Type : Limit Maturity
Maturity Date : 2040-02-02
Maturity Price : 20.02
Evaluated at bid price : 20.02
Bid-YTW : 5.57 %
RY.PR.T FixedReset 49,200 RBC crossed 18,000 at 27.70.
YTW SCENARIO
Maturity Type : Call
Maturity Date : 2014-09-23
Maturity Price : 25.00
Evaluated at bid price : 27.71
Bid-YTW : 3.64 %
PWF.PR.H Perpetual-Discount 48,514 Nesbitt crossed 25,000 at 24.10 and bought 22,100 from Desjardins at the same price.
YTW SCENARIO
Maturity Type : Limit Maturity
Maturity Date : 2040-02-02
Maturity Price : 23.77
Evaluated at bid price : 24.07
Bid-YTW : 6.00 %
TRP.PR.A FixedReset 33,352 Nesbitt crossed 17,000 at 26.02.
YTW SCENARIO
Maturity Type : Call
Maturity Date : 2015-01-30
Maturity Price : 25.00
Evaluated at bid price : 26.02
Bid-YTW : 3.79 %
There were 35 other index-included issues trading in excess of 10,000 shares.
MAPF

MAPF Portfolio Composition: January 2010

Turnover stayed constant in January at about 40%. This is yet another indication that things are slowly returning to normal – although I still think that spreads to bonds are elevated!

Trades were, as ever, triggered by a desire to exploit transient mispricing in the preferred share market (which may the thought of as “selling liquidity”), rather than any particular view being taken on market direction, sectoral performance or credit anticipation.

MAPF Sectoral Analysis 2010-1-29
HIMI Indices Sector Weighting YTW ModDur
Ratchet 0% N/A N/A
FixFloat 0% N/A N/A
Floater 0% N/A N/A
OpRet 0% N/A N/A
SplitShare 4.2% (0) 8.09% 6.99
Interest Rearing 0% N/A N/A
PerpetualPremium 0.0% (-0.5) N/A N/A
PerpetualDiscount 76.7% (+4.0) 5.89% 14.07
Fixed-Reset 14.4% (-2.2) 3.83% 3.88
Scraps (OpRet) 2.4% (-2.2) 9.64% 5.85
Scraps (FixedReset) 2.5% (+2.5) 7.22% 12.03
Cash -0.1% (-2.0) 0.00% 0.00
Total 100% 5.81% 12.08
Totals and changes will not add precisely due to rounding. Bracketted figures represent change from December month-end. Cash is included in totals with duration and yield both equal to zero.

The “total” reflects the un-leveraged total portfolio (i.e., cash is included in the portfolio calculations and is deemed to have a duration and yield of 0.00.). MAPF will often have relatively large cash balances, both credit and debit, to facilitate trading. Figures presented in the table have been rounded to the indicated precision.

Credit distribution is:

MAPF Credit Analysis 2010-1-29
DBRS Rating Weighting
Pfd-1 0 (0)
Pfd-1(low) 75.7% (-6.8)
Pfd-2(high) 9.8% (+9.7)
Pfd-2 0 (-1.1)
Pfd-2(low) 9.8% (+0.1)
Pfd-3(high) 4.9% (+0.3)
Cash -0.1% (-2.0)
Totals will not add precisely due to rounding. Bracketted figures represent change from December month-end.

The increase in holdings of issues rated Pfd-2(high) was due largely to the purchase of HSB.PR.E, a reversal of last month’s highlighted trading.:

MAPF & HSB.PR.E & RY.PR.X
Date HSB.PR.E RY.PR.X
12/23 Sold
28.05
Bot
27.95
12/31
Bid
28.10 28.06
1/14 Bot
28.02
Sold
28.23
1/29
Bid
27.96 27.75
Dividends   1/22
Missed
0.390625
This table attempts to present fairly the larger elements of a series of trades. Full disclosure of the 1H10 trades will be made at the time the unaudited 1H10 Financials are published.

Liquidity Distribution is:

MAPF Liquidity Analysis 2010-1-29
Average Daily Trading Weighting
<$50,000 0.0% (0)
$50,000 – $100,000 0.0% (0)
$100,000 – $200,000 26.6% (+7.7)
$200,000 – $300,000 31.0% (-14.1)
>$300,000 42.5% (+8.5)
Cash -0.1% (-2.0)
Totals will not add precisely due to rounding. Bracketted figures represent change from December month-end.

MAPF is, of course, Malachite Aggressive Preferred Fund, a “unit trust” managed by Hymas Investment Management Inc. Further information and links to performance, audited financials and subscription information are available the fund’s web page. A “unit trust” is like a regular mutual fund, but is sold by offering memorandum rather than prospectus. This is cheaper, but means subscription is restricted to “accredited investors” (as defined by the Ontario Securities Commission) and those who subscribe for $150,000+. Fund past performances are not a guarantee of future performance. You can lose money investing in MAPF or any other fund.

A similar portfolio composition analysis has been performed on the Claymore Preferred Share ETF (symbol CPD) as of August 17 and published in the September PrefLetter. When comparing CPD and MAPF:

  • MAPF credit quality is better
  • MAPF liquidity is a little better
  • MAPF Yield is higher
  • Weightings in
    • MAPF is much more exposed to PerpetualDiscounts
    • MAPF is much less exposed to Operating Retractibles
    • MAPF is more exposed to SplitShares
    • MAPF is less exposed to FixFloat / Floater / Ratchet
    • MAPF weighting in FixedResets is much lower
Index Construction / Reporting

Index Performance: January, 2010

Performance of the HIMIPref™ Indices for January, 2010, was:

Total Return
Index Performance
January 2010
Three Months
to
January 29, 2010
Ratchet +6.60%* +17.61%*
FixFloat +2.65% +17.96%
Floater +6.60% +17.61%
OpRet -0.63% +1.30%
SplitShare +1.02% +2.51%
Interest -0.63%**** +1.30%****
PerpetualPremium -0.17% +1.89%
PerpetualDiscount +1.19% +5.49%
FixedReset 0.00% +3.32%
* The last member of the RatchetRate index was transferred to Scraps at the February, 2009, rebalancing; subsequent performance figures are set equal to the Floater index
**** The last member of the InterestBearing index was transferred to Scraps at the June, 2009, rebalancing; subsequent performance figures are set equal to the OperatingRetractible index
Passive Funds (see below for calculations)
CPD -0.53% +3.66%
DPS.UN +1.39% +6.38%
Index
BMO-CM 50 +0.61% +5.05%
TXPR Total Return -0.29% +4.03%

The pre-tax interest equivalent spread of PerpetualDiscounts over Long Corporates (which I also refer to as the Seniority Spread) closed the year at 220bp, a slight tightening from the 225bp at November month-end.

The relative returns on Floaters over the past year continues to impress:


Click for big

But one must remember how they got there:


Click for big

FixedReset volume ticked up mid-month with the burst of issuance, but has resumed its downward trend. Volume may be under-reported due to the influence of Alternative Trading Systems (as discussed in the November PrefLetter), but I am biding my time before incorporating ATS volumes into the calculations, to see if the effect is transient or not. The average volume of FixedResets continues to decline, which may be due to a number of factors:

  • The calculation is an exponential moving average with dampening applied to spikes. While this procedure has worked very well in the past (it is used to estimate the maximum size of potential trades when performing simulations) there are no guarantees that it works well this particular time
  • Other than the January burst, there hasn’t been much issuance of investment-grade FixedResets recently, which will decrease the liquidity of the whole group, both for technical and real reasons
  • The issues are becoming seasoned, as the shares gradually find their way into the accounts of buy-and-hold investors

Click for big

And the yield-to-worst on FixedResets seems to have found a bottom:


Click for big

As discussed last month, the impressive returns of the past year cannot continue indefinately. The long term return on a fixed income instrument is its yield – 5.8% for a PerpetualDiscount, and about 3.6% to the call date for a FixedReset.

Compositions of the passive funds were discussed in the September edition of PrefLetter.

Claymore has published NAV and distribution data (problems with the page in IE8 can be kludged by using compatibility view) for its exchange traded fund (CPD) and I have derived the following table:

CPD Return, 1- & 3-month, to January 29, 2010
Date NAV Distribution Return for Sub-Period Monthly Return
October 30 16.41      
November 30, 2009 16.77     +2.19%
December 24 16.76 0.21 +1.19% +1.98%
December 31, 2009 16.89 0.00 +0.78%
January 29, 2010 16.80     -0.53%
Quarterly Return +3.66%

It is of interest to note that the January total return for CPD’s benchmark, TXPR, was -0.29% and the trailing three-month return was +4.03%; tracking error is therefore -0.24% and -0.37%, of which about 0.04% and 0.11%, respectively, is MER. Their efforts at rebalancing cost unitholders a lot of money! The MER may be only 45bp, but the first 2010 semiannual rebalancing alone cost about 20bp.

Claymore currently holds $397,666,518 (advisor & common combined) in CPD assets, up about $26-million from the $373,729,364 reported last month.

The DPS.UN NAV for December 30 has been published so we may calculate the approximate December returns.

DPS.UN NAV Return, January-ish 2010
Date NAV Distribution Return for sub-period Return for period
December 30, 2009 19.91      
January 27, 2009 20.26     +1.76%
Estimated December Ending Stub -0.36% *
Estimated January Ending Stub +0.00% **
Estimated January Return +1.39% ***
*CPD had a NAVPU of 16.89 on December 31 and 16.83 on December 30, hence the total return for the period for CPD was +0.36%. The return for DPS.UN in this period is presumed to be equal.
**CPD had a NAVPU of 16.80 on January 27 and 16.80 on January 29, hence the total return for the period for CPD was 0.00%. The return for DPS.UN in this period is presumed to be equal.
*** The estimated December return for DPS.UN’s NAV is therefore the product of three period returns, +1.76%, -0.36% and 0.00% to arrive at an estimate for the calendar month of +1.39%

Now, to see the DPS.UN quarterly NAV approximate return, we refer to the calculations for November and December:

DPS.UN NAV Returns, three-month-ish to end-January-ish, 2010
November-ish +3.09%
December-ish +1.78%
January-ish +1.39%
Three-months-ish +6.38%
Market Action

February 1, 2010

Comrade Peace-Prize wants to make the Build America programme permanent:

Obama will propose expanding the eligibility of the bonds to include original financing for capital projects when he submits his 2011 budget to Congress tomorrow, according to the official, who requested anonymity.

Under the Build America program, part of the economic stimulus package Obama signed into law last February, the federal government provides a 35 percent rebate on issuers’ interest costs. That would go down to 28 percent under the proposal in the president’s budget, according to a Treasury Department official who spoke on condition of anonymity.

Build America Bonds “were successful in helping to repair a severely damaged municipal finance market, making much needed credit available at lower borrowing costs for infrastructure projects that create jobs,” Treasury Secretary Timothy Geithner said in an e-mailed statement released by his office. “By making Build America Bonds a permanent and expanded financing tool for state and local governments, we’re investing in our country’s long term economic growth in a cost-effective way.”

The ever-opportunistic CC&L group is establishing a mutual fund that will invest in these securities:

As at December 14, 2009, securities in the Indicative Portfolio had a weighted average Investment Grade credit rating of ‘‘AA’’
by S&P (or equivalent) and average Effective Duration of 11.1 years.

The Fund will have a term of approximately five years, terminating on or about February  , 2015, and the Fund’s investments will be liquidated prior to such termination at the then prevailing market prices.

‘‘Effective Duration’’ is a measure of the estimated percentage change in price for a 100 basis point change in interest rates and takes into consideration changes in cash flows and values that can occur in bonds with embedded options such as call and put provisions.

“Yep”, says Granny Oakum, “I’m going to invest in long bonds, but it’s safe because the find winds up in five years!”

What I consider fascinating about the whole thing is the indication that municipalities’ financing needs can no longer be met in the US domestic tax-exempt market. Sic transit gloria mundi.

However, there is still a place for derivatives:

Investment bankers in the US have begun using equity derivatives to convert restricted shares paid as bonuses into cash, side-stepping new guidelines on remuneration which were designed to prevent bankers cashing out for at least three years, according to a headhunter.

The bankers are using over-the-counter equity derivatives strategies such as call options, put options and collars to monetise their shares now, albeit at a discount to what they would receive if they waited for the restrictions to lift.

Politicians reaffirmed their total committment to the idea that bank managers should embrace long-term thinking:

“We have to show short-term results,” French Finance Minister Christine Lagarde said in an interview at the conference shortly after chairing a private meeting between bankers, politicians and regulators.

U.K. Chancellor of the Exchequer Alistair Darling, White House economic adviser Lawrence Summers and U.S. House Financial Services Committee Chairman Barney Frank, who were all in Davos, also expressed frustration.

“We simply don’t have years to sort the problem out,” Darling told reporters in Davos on Jan. 29. “There needs to be a sense of urgency.”

Quck! How many years did it take to negotiate Basel II?:

However, despite its contributions, the [Basel I] accord was quickly perceived to be inadequate and since the early 1990s there began an on-going process of updating and reforming the accord to match changing realities in the world of banking, and the preferences and concerns of major players in the system. A series of adjustments were made to the accord in the early to mid-nineties before the inevitable realisation set in that a replacement accord was needed rather than piecemeal reform. In June 1999 the Basel Committee announced that it would begin negotiations on a new capital accord to replace the 1988 agreement.

Of particular interest in this story is the continued dominance of the United States over European regulatory authorities. At several moments in the discussions the US has presented its European counterparts with a fait accompli in the content of the new accord, and has been willing only to discuss changes to the wording, not substance. Most damning, in spring 2003 after having gained most of the concessions it sought from fellow Basel members, the US announced that it would likely apply the accord to only a handful of banks, thus greatly weakening the potential impact of the accord and calling into question its validity.

My favourite corporate spokesman – ever – is Goldman Sachs’ Lucas Van Praag.

Not the greatest of days for the Canadian preferred share market, as PerpetualDiscounts lost 17bp while FixedResets gaoing 2bp, on moderate volume.

HIMIPref™ Preferred Indices
These values reflect the December 2008 revision of the HIMIPref™ Indices

Values are provisional and are finalized monthly
Index Mean
Current
Yield
(at bid)
Median
YTW
Median
Average
Trading
Value
Median
Mod Dur
(YTW)
Issues Day’s Perf. Index Value
Ratchet 3.19 % 3.94 % 27,516 19.91 1 -0.1689 % 1,730.7
FixedFloater 5.65 % 3.74 % 35,267 19.34 1 -0.3623 % 2,798.6
Floater 2.11 % 1.78 % 41,251 23.06 4 0.3908 % 2,174.3
OpRet 4.84 % -3.49 % 109,610 0.09 13 0.0472 % 2,320.2
SplitShare 6.31 % 1.24 % 146,727 0.08 2 0.4152 % 2,128.7
Interest-Bearing 0.00 % 0.00 % 0 0.00 0 0.0472 % 2,121.6
Perpetual-Premium 5.75 % 5.56 % 74,631 2.21 7 0.1639 % 1,891.0
Perpetual-Discount 5.78 % 5.81 % 175,710 14.17 69 -0.1734 % 1,823.4
FixedReset 5.43 % 3.62 % 318,733 3.81 42 0.0175 % 2,177.9
Performance Highlights
Issue Index Change Notes
HSB.PR.C Perpetual-Discount -1.47 % YTW SCENARIO
Maturity Type : Limit Maturity
Maturity Date : 2040-02-01
Maturity Price : 22.60
Evaluated at bid price : 22.78
Bid-YTW : 5.66 %
RY.PR.D Perpetual-Discount -1.02 % YTW SCENARIO
Maturity Type : Limit Maturity
Maturity Date : 2040-02-01
Maturity Price : 20.39
Evaluated at bid price : 20.39
Bid-YTW : 5.53 %
TD.PR.P Perpetual-Discount -1.01 % YTW SCENARIO
Maturity Type : Limit Maturity
Maturity Date : 2040-02-01
Maturity Price : 23.42
Evaluated at bid price : 23.61
Bid-YTW : 5.59 %
BNA.PR.C SplitShare 1.03 % YTW SCENARIO
Maturity Type : Hard Maturity
Maturity Date : 2019-01-10
Maturity Price : 25.00
Evaluated at bid price : 19.55
Bid-YTW : 7.95 %
CIU.PR.A Perpetual-Discount 1.19 % YTW SCENARIO
Maturity Type : Limit Maturity
Maturity Date : 2040-02-01
Maturity Price : 21.26
Evaluated at bid price : 21.26
Bid-YTW : 5.51 %
BAM.PR.K Floater 1.27 % YTW SCENARIO
Maturity Type : Limit Maturity
Maturity Date : 2040-02-01
Maturity Price : 15.18
Evaluated at bid price : 15.18
Bid-YTW : 2.61 %
BAM.PR.B Floater 1.97 % YTW SCENARIO
Maturity Type : Limit Maturity
Maturity Date : 2040-02-01
Maturity Price : 15.50
Evaluated at bid price : 15.50
Bid-YTW : 2.55 %
IAG.PR.C FixedReset 1.99 % YTW SCENARIO
Maturity Type : Call
Maturity Date : 2014-01-30
Maturity Price : 25.00
Evaluated at bid price : 27.19
Bid-YTW : 3.95 %
Volume Highlights
Issue Index Shares
Traded
Notes
PWF.PR.J OpRet 303,035 RBC crossed 244,600 at 26.08. TD crossed 50,000 at the same price.
YTW SCENARIO
Maturity Type : Call
Maturity Date : 2010-03-03
Maturity Price : 25.75
Evaluated at bid price : 25.91
Bid-YTW : -2.96 %
MFC.PR.D FixedReset 131,789 RBC crossed two blocks of 25,000 at 28.09 and 28.10, followed by 49,000 at 28.15.
YTW SCENARIO
Maturity Type : Call
Maturity Date : 2014-07-19
Maturity Price : 25.00
Evaluated at bid price : 28.06
Bid-YTW : 3.83 %
TD.PR.M OpRet 79,800 Desjardins crossed 75,000 at 26.25.
YTW SCENARIO
Maturity Type : Call
Maturity Date : 2010-03-03
Maturity Price : 26.00
Evaluated at bid price : 26.25
Bid-YTW : -7.01 %
SLF.PR.D Perpetual-Discount 57,951 RBC crossed two blocks of 23,200 at 19.29 and 19.30.
YTW SCENARIO
Maturity Type : Limit Maturity
Maturity Date : 2040-02-01
Maturity Price : 19.20
Evaluated at bid price : 19.20
Bid-YTW : 5.87 %
TRP.PR.A FixedReset 35,154 YTW SCENARIO
Maturity Type : Call
Maturity Date : 2015-01-30
Maturity Price : 25.00
Evaluated at bid price : 26.00
Bid-YTW : 3.81 %
HSB.PR.E FixedReset 32,613 RBC crossed 25,000 at 28.00.
YTW SCENARIO
Maturity Type : Call
Maturity Date : 2014-07-30
Maturity Price : 25.00
Evaluated at bid price : 28.00
Bid-YTW : 3.87 %
There were 29 other index-included issues trading in excess of 10,000 shares.
Issue Comments

FFH.PR.E: Fair Facts of First Day's Trading

Fairfax Financial Holdings has announced that it:

has completed its previously announced public offering of Cumulative 5-Year Rate Reset Preferred Shares, Series E in Canada. Fairfax issued 8 million Series E Preferred Shares for net proceeds, after commissions and expenses, of approximately $194 million.

The Series E Preferred Shares were sold through a syndicate of Canadian underwriters led by BMO Capital Markets that included CIBC World Markets, RBC Capital Markets, Scotia Capital, TD Securities, National Bank Financial, GMP Securities, Cormark Securities, Desjardins Securities and HSBC Securities.

The issue suffered through a rather poor first day, trading 117,310 shares in a range of 24.00-50 before closing at 24.10-19, 5×14. I suspect a good chunk is still on the underwriters’ books.

Vital Statistics are:

FFH.PR.E FixedReset YTW SCENARIO
Maturity Type : Limit Maturity
Maturity Date : 2040-02-01
Maturity Price : 24.06
Evaluated at bid price : 24.10
Bid-YTW : 4.75 %

The FixedReset 4.75%+216 issue was announced January 21. FFH.PR.E is tracked by HIMIPref™, but is relegated to the Scraps subindex on credit concerns.

Issue Comments

Best & Worst Performers: January 2010

These are total returns, with dividends presumed to have been reinvested at the bid price on the ex-date. The list has been restricted to issues in the HIMIPref™ indices.

January 2010
Issue Index DBRS Rating Monthly Performance Notes (“Now” means “January 29”)
BAM.PR.J OpRet Pfd-2(low) -4.30% Now with a pre-tax bid-YTW of 4.88% based on a bid of 26.02 and a softMaturity 2018-3-30 at 25.00.
W.PR.J PerpetualDiscount Pfd-2(low) -3.71% Now with a pre-tax bid-YTW of 6.18% based on a bid of 22.84 and a limitMaturity.
BAM.PR.O OpRet Pfd-2(low) -3.09% Now with a pre-tax bid-YTW of 4.29% based on a bid of 25.68 and a optionCertainty 2013-6-30 at 25.00.
IAG.PR.C FixedReset Pfd-2(high) -3.09% Now with a pre-tax bid-YTW of 4.51% based on a bid of 26.66 and a call 2014-1-30 at 25.00.
W.PR.H PerpetualDiscount Pfd-2(low) -3.05% Now with a pre-tax bid-YTW of 6.14% based on a bid of 22.56 and a limitMaturity.
ELF.PR.G PerpetualDiscount Pfd-2(low) +4.57% Now with a pre-tax bid-YTW of 6.40% based on a bid of 18.75 and a limitMaturity.
ELF.PR.F PerpetualDiscount Pfd-2(low) +4.94% The fifth-worst performer in December, so this is a bounce-back. Now with a pre-tax bid-YTW of 6.50% based on a bid of 20.60 and a limitMaturity.
CIU.PR.A PerpetualDiscount Pfd-2(high) +6.70% The third-worst performer in December, so this is largely a bounce-back. Now with a pre-tax bid-YTW of 5.57% based on a bid of 21.01 and a limitMaturity.
BAM.PR.K Floater Pfd-2(low) +8.62% The fourth best performer in December.
BAM.PR.B Floater Pfd-2(low) +9.20% The second-best performer in December. Momentum rules!
Index Construction / Reporting

HIMIPref™ Index Rebalancing: January 2010

HIMI Index Changes, January 29, 2009
Issue From To Because
BMO.PR.L PerpetualPremium PerpetualDiscount Price
IAG.PR.E PerpetualPremium PerpetualDiscount Price
NA.PR.K PerpetualPremium PerpetualDiscount Price
PWF.PR.I PerpetualPremium PerpetualDiscount Price
TD.PR.Q PerpetualPremium PerpetualDiscount Price
TD.PR.R PerpetualPremium PerpetualDiscount Price
PWF.PR.A Scraps Floater Volume
BAM.PR.E Scraps Ratchet Volume
GWL.PR.O Scraps PerpetualPremium Volume

There were the following intra-month changes:

HIMI Index Changes during January 2010
Issue Action Index Because
GWO.PR.X Delete OpRet Called
IGM.PR.A Delete OpRet Called
BAM.PR.R Add FixedReset New Issue
BPO.PR.N Add Scraps New Issue
AER.PR.A Add Scraps New Issue
FTS.PR.H Add Scraps New Issue
Issue Comments

SPL.A Rating Discontinued by DBRS

Dominion Bond Rating Service has announced that it:

has today discontinued its rating on the Class A Shares issued by Mulvihill Pro-AMS RSP Split Share Corp. at the request of Mulvihill Capital Management Inc. (the Promoter).

The fund’s 1H09 Financials noted:

No distributions were made to Class A and Class B shareholders.

In October 2008, the Managed Portfolio funded additional amounts for the Class A Share Forward Agreement to a future value of $10.00 per Class A Share. The Managed Portfolio was reduced significantly in size with this funding. The Class A Shares have residual risk now, since the decrease in the size of the Managed Portfolio may mean that the Class A Shareholders will be expected to cover expenses of the Fund in future years. As a result, the expected redemption value of the Class A Shares to be received in December of 2013 is less than $10.00 per Class A Share.

SPL.A was last mentioned on PrefBlog when it was downgraded to D by DBRS. SPL.A is tracked by HIMIPref™ but is relegated to the Scraps subindex on credit concerns.

Market Action

January 29, 2010

That’s a wrap!

The Canadian preferred share market closed the month on a sour note, with PerpetualDiscounts down 13bp and FixedResets losing 6bp on a well-behaved day with only one entry in the performance highlights – POW.PR.B, oddly enough, which I have used as a gauge of the market impact of the stupid trading in POW.PR.C. Volume was subdued and dominated by FixedResets.

PerpetualDiscounts closed the month yielding 5.81%, equivalent to 8.13% interest at the standard equivalency factor of 1.4x. Long Corporates returned 4.02% on the month to close with a yield of about 5.8%, so the pre-tax interest-equivalent spread (also called the Seniority Spread) is now about 235bp, a little wider than the 230bp reported on January 27.

HIMIPref™ Preferred Indices
These values reflect the December 2008 revision of the HIMIPref™ Indices

Values are provisional and are finalized monthly
Index Mean
Current
Yield
(at bid)
Median
YTW
Median
Average
Trading
Value
Median
Mod Dur
(YTW)
Issues Day’s Perf. Index Value
Ratchet 0.00 % 0.00 % 0 0.00 0 0.6556 % 1,733.6
FixedFloater 5.63 % 3.72 % 36,675 19.36 1 -0.9231 % 2,808.8
Floater 2.26 % 2.60 % 113,138 20.75 3 0.6556 % 2,165.8
OpRet 4.84 % -3.92 % 110,558 0.09 13 -0.0118 % 2,319.1
SplitShare 6.34 % 0.08 % 148,734 0.08 2 0.3069 % 2,119.9
Interest-Bearing 0.00 % 0.00 % 0 0.00 0 -0.0118 % 2,120.6
Perpetual-Premium 5.82 % 5.67 % 151,594 13.74 12 -0.0498 % 1,887.9
Perpetual-Discount 5.76 % 5.81 % 172,362 14.17 63 -0.1285 % 1,826.6
FixedReset 5.43 % 3.61 % 321,361 3.81 42 -0.0568 % 2,177.5
Performance Highlights
Issue Index Change Notes
POW.PR.B Perpetual-Discount -1.50 % YTW SCENARIO
Maturity Type : Limit Maturity
Maturity Date : 2040-01-29
Maturity Price : 21.93
Evaluated at bid price : 22.26
Bid-YTW : 6.05 %
Volume Highlights
Issue Index Shares
Traded
Notes
BAM.PR.B Floater 70,951 Nesbitt crossed 50,000 at 15.05.
YTW SCENARIO
Maturity Type : Limit Maturity
Maturity Date : 2040-01-29
Maturity Price : 15.20
Evaluated at bid price : 15.20
Bid-YTW : 2.60 %
TD.PR.K FixedReset 69,750 RBC crossed 12,000 at 27.80, then three blocks at 27.82: two of 10,000 and one of 30,000 shares.
YTW SCENARIO
Maturity Type : Call
Maturity Date : 2014-08-30
Maturity Price : 25.00
Evaluated at bid price : 27.81
Bid-YTW : 3.61 %
RY.PR.T FixedReset 49,658 Desjardins crosse 15,000 at 27.70, then Nesbitt crossed 25,000 at 27.65.
YTW SCENARIO
Maturity Type : Call
Maturity Date : 2014-09-23
Maturity Price : 25.00
Evaluated at bid price : 27.64
Bid-YTW : 3.70 %
TD.PR.G FixedReset 48,220 RBC crossed blocks of 10,000 and 30,000 shares, both at 27.85.
YTW SCENARIO
Maturity Type : Call
Maturity Date : 2014-05-30
Maturity Price : 25.00
Evaluated at bid price : 27.83
Bid-YTW : 3.46 %
BNS.PR.T FixedReset 37,725 Nesbitt crossed 20,000 at 27.89.
YTW SCENARIO
Maturity Type : Call
Maturity Date : 2014-05-25
Maturity Price : 25.00
Evaluated at bid price : 27.79
Bid-YTW : 3.49 %
RY.PR.X FixedReset 37,474 RBC bought 11,900 from anonymous at 27.80.
YTW SCENARIO
Maturity Type : Call
Maturity Date : 2014-09-23
Maturity Price : 25.00
Evaluated at bid price : 27.75
Bid-YTW : 3.61 %
There were 26 other index-included issues trading in excess of 10,000 shares.