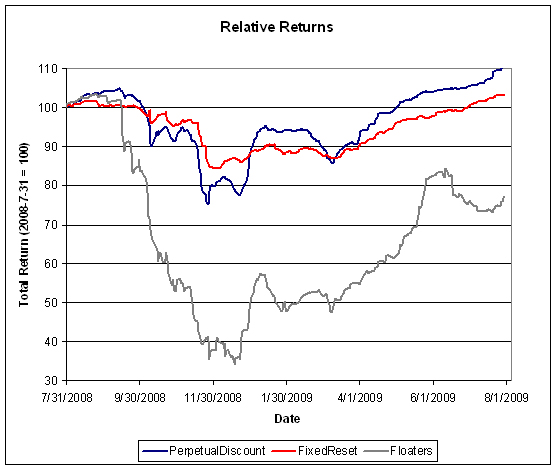
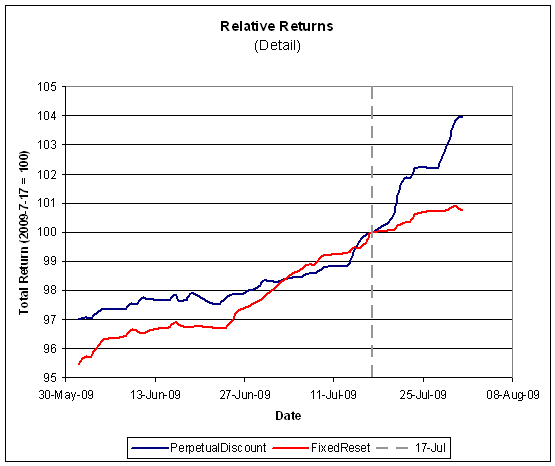
I am pleased to announce that the Seminar on PerpetualDiscounts has been accredited for four hours of IDA Continuing Education – Professional Development.
The Undesirable Effects of Banning Short Sales
Dr. Abraham Lioui of EDHEC has released a paper on the effectiveness of the much-ballyhooed short sales ban:
An in-depth study of the short-selling market calls into question both the reasons for the decision to ban short selling and the prejudices that weigh on those who short. According to recently published data (for the United States in particular), a large majority of short sellers are market makers who are hedging their bets on the options markets. They were not affected by the ban, which means that those who were using options to take synthetic short positions continued to do so. The others involved in short selling are mainly hedge funds. The average return over the last ten years for hedge funds that used short-sale, convertible arbitrage and long/short strategies was 3%, 4.75% and 7.00% respectively (Le Sourd 2009). One can hardly argue that they were over-informed and that they earned abnormal returns.
As a result, short sellers perhaps did not really merit the punishment that, by simply banning the shorting of the shares of financial institutions, the market authorities recently meted out. It also seems (and this study confirms it) that the shares that were the object of the ban were relatively unaffected by it. All the same, this drastic measure cast the market authorities in a particularly negative light. After all, the reasons for this measure are unclear, a lack of clarity that adds to the bewilderment of the market. The market, of course, reacted accordingly. The ban on short selling was followed by a sharp rise in the volatility of the markets, and on the stock markets concerned the impact of the ban was systematic; the impact on volatility was greater than that of the financial crisis. In general, the risk/return possibilities of investors worsened.
And although it is hard to substantiate the impact on the volatility of the shares, the rise in the volatility of these shares, which is undeniable, is a result of the rise in idiosyncratic risk and thus of the noise in the markets. As a consequence, share prices deviate yet more from their fundamental value. Finally, the desired effect on market trends has not been achieved (no reduction of the negative skewness of returns is being observed) and there is no evidence of the possible impact of this measure on extreme market movements. What is clear is that stock market indices now have components that are subject to different rules, differences that make them even less representative and relevant.
Broadly, the market seems to have reacted negatively to this ban; it views it as indicative of a deviation of the market authorities from their primary mission. It seems that these authorities are unable to manage the over-the-counter short sale market. The message for small investors is pessimistic as well. Finally, rather than opting for this facile response, greater efforts to democratise this market and to increase its transparency should perhaps have been made.
A lot of this is beside the point. The purpose of the short-selling ban was to demonstrate that regulators were Doing Something and Taking Decisive Action and Providing Adult Supervision. It succeeded admirably; no regulator has yet lost his job for not doing any of those things and public opprobrium is concentrated on Evil Bankers.
The IIROC report on the short-selling ban has been previously discussed on PrefBlog.
One Week Until Seminar on Floating Rate Preferreds
I just want to remind all Assiduous Readers about the next seminar in the the series on the theory and practice of preferred share investing.
These seminars are aimed at active and potential preferred share investors who wish to review relative valuation techniques in preferred share analysis.
All seminars will be presented by James Hymas, who has written extensively on the subject of preferred share investment and has been referred to as a "top expert" on the subject.
Questions are encouraged throughout the seminars, as well as in informal discussion at the end of the session.
Each seminar is two hours in length; coffee and tea will be served. The cost of attendance is $100, but a discount of $50 will be given to participants who have an annual subscription to PrefLetter with at least one issue remaining at the time of the seminar.
All seminars will be video-recorded for future distribution.
Thursday, April 30
Floating Rate Issues: Theory & Practice
"Floating Rate Issues" are popular with investors who:
- wish to obtain tax-advantaged income
- want protection against future inflation
These issues are characterized by:
- Issued by Operating companies
- Extant issues are non-financial
- Dividends are paid by reference to Canada Prime
- An exchange option may exist to lock in a rate for five years on a given date
- Issues are Perpetual
This seminar will review the theory of Floating Rate Preferred evaluation, including:
- Credit Quality
- Embedded calls
- Exchange Options
- The importance of ex-Dividend dates
- Investment characteristics relative to
- money market instruments
- other perpetual instruments
Examples of relative valuation in current markets will be supplied and discussed. Note that Floating Rate issues include the HIMIPref™ Indices:
- Ratchet
- FixedFloater
- Floater
. "FixedReset" issues will not be discussed as part of this seminar.
Attendence is limited; a reservation will avoid disappointment.
Location: Days Hotel & Conference Center, (at Carlton & College, downtown Toronto) Yorkville Room (see map).
Time: April 30, 2009, 6pm-8pm.
Reservations: Please visit the PrefLetter Seminar Page.
Prior Seminars on Video: The video and resource materials for the seminar on PerpetualDiscounts is available via the PrefLetter Video Seminar Page.
April 23, 2009
The Fed has released its financial statements and Bloomberg notes:
its most detailed breakdown to date on the types of assets it accepted from Bear Stearns Cos. a year ago and the cause of losses on the portfolio.
…
The biggest losses in the $25.7 billion portfolio of Bear Stearns assets as of the end of last year came from commercial and residential mortgages.
…
The Fed wrote down the value of commercial mortgage holdings by 28 percent to $5.6 billion and residential loans by 38 percent to $937 million as of Dec. 31, the central bank said in a report today.
The Fed refers to table 4 in the the current H.4.1 report:
| Account name | Apr 15, 2009 |
| Portfolio holdings of Maiden Lane LLC (1) | 26,439 |
| Outstanding principal amount of loan extended by the Federal Reserve Bank of New York (2) | 28,820 |
| Accrued interest payable to the Federal Reserve Bank of New York (2) | 309 |
| Outstanding principal amount and accrued interest on loan payable to JPMorgan Chase & Co. (3) | 1,205 |
| 1. Fair value. Fair value reflects an estimate of the price that would be received upon selling an asset if the transaction were to be conducted in an orderly market on the measurement date. Revalued quarterly. This table reflects valuations as of December 31, 2008. Any assets purchased after this valuation date are initially recorded at cost until their estimated fair value as of the purchase date becomes available.
2. Book value. This amount was eliminated when preparing the Federal Reserve Bank of New York’s statement of condition consistent with consolidation under generally accepted accounting principles. Refer to the note on consolidation accompanying table 10. 3. Book value. The fair value of these obligations is included in other liabilities and capital in table 1 and in other liabilities and accrued dividends in table 9 and table 10. |
|
The unconsolidated financials of Maiden Lane have been published. The losses have been divided up as: $3.4-billion Fed; $1.2-billion JPM. That wipes out JPM’s subordinated loan to Maiden Lane, assuming there is no recovery.
PerpetualDiscounts fell slightly today, but FixedResets continued to impress on a day reduced, but still rather good, volume. The former now yield an average of 6.84%, equivalent to 9.58% interest at the standard equivalency factor of 1.4x, while long corporates now yield 7.4%; thus, the pre-tax interest-equivalent spread is 218bp; in what we may call the “Credit-Crisis-but-not-Apocalyptic-Panic” zone.
| HIMIPref™ Preferred Indices These values reflect the December 2008 revision of the HIMIPref™ Indices Values are provisional and are finalized monthly |
|||||||
| Index | Mean Current Yield (at bid) |
Median YTW |
Median Average Trading Value |
Median Mod Dur (YTW) |
Issues | Day’s Perf. | Index Value |
| Ratchet | 0.00 % | 0.00 % | 0 | 0.00 | 0 | 2.5176 % | 976.2 |
| FixedFloater | 0.00 % | 0.00 % | 0 | 0.00 | 0 | 2.5176 % | 1,578.7 |
| Floater | 4.50 % | 4.53 % | 69,119 | 16.36 | 2 | 2.5176 % | 1,219.5 |
| OpRet | 5.09 % | 4.08 % | 145,028 | 3.86 | 15 | 0.2141 % | 2,138.8 |
| SplitShare | 6.65 % | 8.41 % | 47,344 | 5.63 | 3 | 0.0171 % | 1,738.3 |
| Interest-Bearing | 6.12 % | 9.17 % | 26,412 | 0.66 | 1 | 0.0000 % | 1,949.5 |
| Perpetual-Premium | 0.00 % | 0.00 % | 0 | 0.00 | 0 | -0.1585 % | 1,630.9 |
| Perpetual-Discount | 6.70 % | 6.84 % | 145,283 | 12.79 | 71 | -0.1585 % | 1,502.0 |
| FixedReset | 5.91 % | 5.22 % | 662,652 | 4.56 | 35 | 0.3743 % | 1,910.6 |
| Performance Highlights | |||
| Issue | Index | Change | Notes |
| SLF.PR.E | Perpetual-Discount | -1.79 % | YTW SCENARIO Maturity Type : Limit Maturity Maturity Date : 2039-04-23 Maturity Price : 15.91 Evaluated at bid price : 15.91 Bid-YTW : 7.17 % |
| CM.PR.I | Perpetual-Discount | -1.72 % | YTW SCENARIO Maturity Type : Limit Maturity Maturity Date : 2039-04-23 Maturity Price : 17.15 Evaluated at bid price : 17.15 Bid-YTW : 6.90 % |
| HSB.PR.C | Perpetual-Discount | -1.42 % | YTW SCENARIO Maturity Type : Limit Maturity Maturity Date : 2039-04-23 Maturity Price : 18.78 Evaluated at bid price : 18.78 Bid-YTW : 6.88 % |
| RY.PR.B | Perpetual-Discount | -1.38 % | YTW SCENARIO Maturity Type : Limit Maturity Maturity Date : 2039-04-23 Maturity Price : 18.55 Evaluated at bid price : 18.55 Bid-YTW : 6.35 % |
| CIU.PR.A | Perpetual-Discount | -1.31 % | YTW SCENARIO Maturity Type : Limit Maturity Maturity Date : 2039-04-23 Maturity Price : 18.02 Evaluated at bid price : 18.02 Bid-YTW : 6.50 % |
| BMO.PR.J | Perpetual-Discount | -1.31 % | YTW SCENARIO Maturity Type : Limit Maturity Maturity Date : 2039-04-23 Maturity Price : 18.03 Evaluated at bid price : 18.03 Bid-YTW : 6.36 % |
| MFC.PR.C | Perpetual-Discount | -1.13 % | YTW SCENARIO Maturity Type : Limit Maturity Maturity Date : 2039-04-23 Maturity Price : 16.61 Evaluated at bid price : 16.61 Bid-YTW : 6.88 % |
| HSB.PR.D | Perpetual-Discount | -1.07 % | YTW SCENARIO Maturity Type : Limit Maturity Maturity Date : 2039-04-23 Maturity Price : 17.61 Evaluated at bid price : 17.61 Bid-YTW : 7.20 % |
| CM.PR.P | Perpetual-Discount | -1.04 % | YTW SCENARIO Maturity Type : Limit Maturity Maturity Date : 2039-04-23 Maturity Price : 19.98 Evaluated at bid price : 19.98 Bid-YTW : 6.93 % |
| W.PR.H | Perpetual-Discount | -1.04 % | YTW SCENARIO Maturity Type : Limit Maturity Maturity Date : 2039-04-23 Maturity Price : 20.06 Evaluated at bid price : 20.06 Bid-YTW : 6.93 % |
| BNA.PR.C | SplitShare | -1.00 % | Asset coverage of 1.7+:1 as of March 31 according to the company. YTW SCENARIO Maturity Type : Hard Maturity Maturity Date : 2019-01-10 Maturity Price : 25.00 Evaluated at bid price : 12.85 Bid-YTW : 13.74 % |
| CM.PR.L | FixedReset | 1.01 % | YTW SCENARIO Maturity Type : Call Maturity Date : 2014-05-30 Maturity Price : 25.00 Evaluated at bid price : 26.11 Bid-YTW : 5.50 % |
| CM.PR.K | FixedReset | 1.11 % | YTW SCENARIO Maturity Type : Limit Maturity Maturity Date : 2039-04-23 Maturity Price : 23.72 Evaluated at bid price : 23.76 Bid-YTW : 4.58 % |
| RY.PR.P | FixedReset | 1.16 % | YTW SCENARIO Maturity Type : Call Maturity Date : 2014-03-26 Maturity Price : 25.00 Evaluated at bid price : 26.06 Bid-YTW : 5.17 % |
| RY.PR.I | FixedReset | 1.23 % | YTW SCENARIO Maturity Type : Limit Maturity Maturity Date : 2039-04-23 Maturity Price : 23.92 Evaluated at bid price : 23.96 Bid-YTW : 4.18 % |
| BAM.PR.O | OpRet | 1.24 % | YTW SCENARIO Maturity Type : Option Certainty Maturity Date : 2013-06-30 Maturity Price : 25.00 Evaluated at bid price : 23.60 Bid-YTW : 6.68 % |
| POW.PR.C | Perpetual-Discount | 1.27 % | YTW SCENARIO Maturity Type : Limit Maturity Maturity Date : 2039-04-23 Maturity Price : 20.76 Evaluated at bid price : 20.76 Bid-YTW : 7.06 % |
| POW.PR.B | Perpetual-Discount | 1.28 % | YTW SCENARIO Maturity Type : Limit Maturity Maturity Date : 2039-04-23 Maturity Price : 19.06 Evaluated at bid price : 19.06 Bid-YTW : 7.09 % |
| TD.PR.Y | FixedReset | 1.30 % | YTW SCENARIO Maturity Type : Limit Maturity Maturity Date : 2039-04-23 Maturity Price : 23.24 Evaluated at bid price : 23.30 Bid-YTW : 4.12 % |
| BAM.PR.J | OpRet | 1.67 % | YTW SCENARIO Maturity Type : Soft Maturity Maturity Date : 2018-03-30 Maturity Price : 25.00 Evaluated at bid price : 21.35 Bid-YTW : 7.80 % |
| W.PR.J | Perpetual-Discount | 1.73 % | YTW SCENARIO Maturity Type : Limit Maturity Maturity Date : 2039-04-23 Maturity Price : 20.57 Evaluated at bid price : 20.57 Bid-YTW : 6.88 % |
| BAM.PR.B | Floater | 2.22 % | YTW SCENARIO Maturity Type : Limit Maturity Maturity Date : 2039-04-23 Maturity Price : 8.75 Evaluated at bid price : 8.75 Bid-YTW : 4.54 % |
| BAM.PR.K | Floater | 2.82 % | YTW SCENARIO Maturity Type : Limit Maturity Maturity Date : 2039-04-23 Maturity Price : 8.76 Evaluated at bid price : 8.76 Bid-YTW : 4.53 % |
| Volume Highlights | |||
| Issue | Index | Shares Traded |
Notes |
| MFC.PR.D | FixedReset | 42,568 | YTW SCENARIO Maturity Type : Call Maturity Date : 2014-07-19 Maturity Price : 25.00 Evaluated at bid price : 25.76 Bid-YTW : 6.15 % |
| GWO.PR.I | Perpetual-Discount | 30,850 | TD crossed 10,000 at 16.10, then another 13,900 at the same price. YTW SCENARIO Maturity Type : Limit Maturity Maturity Date : 2039-04-23 Maturity Price : 16.05 Evaluated at bid price : 16.05 Bid-YTW : 7.11 % |
| TD.PR.K | FixedReset | 28,975 | Recent new issue. YTW SCENARIO Maturity Type : Call Maturity Date : 2014-08-30 Maturity Price : 25.00 Evaluated at bid price : 25.90 Bid-YTW : 5.57 % |
| TD.PR.E | FixedReset | 25,130 | YTW SCENARIO Maturity Type : Call Maturity Date : 2014-05-30 Maturity Price : 25.00 Evaluated at bid price : 26.15 Bid-YTW : 5.22 % |
| RY.PR.X | FixedReset | 24,124 | Recent new issue. YTW SCENARIO Maturity Type : Call Maturity Date : 2014-09-23 Maturity Price : 25.00 Evaluated at bid price : 25.85 Bid-YTW : 5.63 % |
| GWO.PR.G | Perpetual-Discount | 22,854 | YTW SCENARIO Maturity Type : Limit Maturity Maturity Date : 2039-04-23 Maturity Price : 18.54 Evaluated at bid price : 18.54 Bid-YTW : 7.11 % |
| There were 27 other index-included issues trading in excess of 10,000 shares. | |||
Research: Some Preferreds to Float Your Boat
The March edition of Canadian Moneysaver contained my recent review of the performance of Floating Rate Preferreds over the past few years and my observations on contemporary pricing.
Look for the research link!
Bank of Canada Releases Monetary Policy Report
The Bank of Canada has announced the release of its April 2009 Monetary Policy Report:
In the January Update, the Bank projected a sharp recession in Canada, followed by a relatively muted recovery starting in the third quarter of this year. As a result of the more severe, synchronized nature of the global downturn, the recession in Canada is even deeper than anticipated. As well, the Bank now expects the recovery to be delayed until the fourth quarter of 2009 and to be more gradual than projected in January. Nonetheless, the Bank is still projecting a rebound to above-potential growth in 2010, albeit with a lower estimate of potential output growth. As explained in January, the recovery should be supported by a number of factors, including the timeliness and scale of the Bank’s monetary policy response; our relatively well-functioning financial system and the gradual improvement in financial conditions in Canada; the past depreciation of the Canadian dollar; stimulative fiscal policy measures; the gradual rebound in external demand; the strength of Canadian household, business, and bank balance sheets; and the end of the stock adjustments in Canadian and U.S. residential housing.
Inflation remains under control:

and they note that:

There was also a backgrounder on fan charts; these were recommended as a means of Central Bank communication by Michael Woodford of Columbia, as discussed on PrefBlog on January 17, 2008. These are used to indicate the degree of uncertainty in predictions:

Cleveland Fed Publishes April '09 Econotrends
The Cleveland Fed has released their Economic Trends, April 2009, with a variety of data and statistics.
Items of note are:
- February Price Statistics
- Financial Markets, Money, and Monetary Policy
- The Yield Curve, March 2009
- New Policy Moves and the Term Asset-Backed Securities Loan Facility
- International Markets
- China, SDRs, and the Dollar
- Economic Activity and Labor Markets
- U.S. Real Estate: Looking for Progress in Price Stability and Financing
- Real GDP: Fourth Quarter 2008 Final Estimate
- March Employment Situation
- An Overview of the Healthcare System
There were some good charts in the article on the TALF:
The TALF is designed to support the issuance of asset-backed securities (ABS) collateralized by student loans, auto loans, credit card loans, and loans guaranteed by the Small Business Administration.
…
Since the beginning of the financial crisis, however, those ABS markets have been under strain. With the strain accelerating in the third quarter of 2008, the market came to a near-complete halt—the chart below shows the dramatic drop in the issuance of new consumer ABSs.

Under the TALF, the Federal Reserve Bank of New York will provide nonrecourse funding to any eligible borrower owning eligible collateral. On a fixed day each month, borrowers will be able to request one or more three-year TALF loans. As the loan is nonrecourse, if the borrower does not repay the loan, the New York Fed will enforce its rights to the collateral.
Th ree requirements are intended to protect the Fed from the risk of losses. First, the ABS must have the highest investment-grade rating category from two or more major nationally recognized statistical rating organizations. Th is requirement should reduce the risk that the ABSs accepted will fall dramatically in value. Second, borrowers will pay a risk premium set to a margin above the Libor (usually 1 percent). Th ird, “haircuts” ranging from 5 percent to 15 percent will be fi gured into the loans. Th at is, the amount the TALF will extend a loan for can be only as high as the par or market value of the ABS minus the haircut. Th is requirement means that if the borrower defaults on the loan and the Fed seizes the collateral, the Fed loses nothing unless the value of the collateral has fallen more than the haircut.

April 22, 2009
Sorry, folks! This is a busy time, so there’s no commentary.
| HIMIPref™ Preferred Indices These values reflect the December 2008 revision of the HIMIPref™ Indices Values are provisional and are finalized monthly |
|||||||
| Index | Mean Current Yield (at bid) |
Median YTW |
Median Average Trading Value |
Median Mod Dur (YTW) |
Issues | Day’s Perf. | Index Value |
| Ratchet | 0.00 % | 0.00 % | 0 | 0.00 | 0 | -0.2919 % | 952.2 |
| FixedFloater | 0.00 % | 0.00 % | 0 | 0.00 | 0 | -0.2919 % | 1,539.9 |
| Floater | 4.61 % | 4.64 % | 71,000 | 16.16 | 2 | -0.2919 % | 1,189.6 |
| OpRet | 5.10 % | 4.35 % | 145,720 | 3.71 | 15 | -0.0080 % | 2,134.2 |
| SplitShare | 6.65 % | 8.83 % | 47,374 | 5.63 | 3 | 0.2745 % | 1,738.0 |
| Interest-Bearing | 6.12 % | 9.13 % | 26,737 | 0.67 | 1 | 0.5123 % | 1,949.5 |
| Perpetual-Premium | 0.00 % | 0.00 % | 0 | 0.00 | 0 | 0.1676 % | 1,633.5 |
| Perpetual-Discount | 6.69 % | 6.80 % | 146,221 | 12.82 | 71 | 0.1676 % | 1,504.4 |
| FixedReset | 5.94 % | 5.30 % | 666,363 | 4.57 | 35 | 0.3941 % | 1,903.5 |
| Performance Highlights | |||
| Issue | Index | Change | Notes |
| MFC.PR.B | Perpetual-Discount | -2.42 % | YTW SCENARIO Maturity Type : Limit Maturity Maturity Date : 2039-04-22 Maturity Price : 17.32 Evaluated at bid price : 17.32 Bid-YTW : 6.82 % |
| CM.PR.A | OpRet | -1.84 % | YTW SCENARIO Maturity Type : Call Maturity Date : 2009-05-22 Maturity Price : 25.50 Evaluated at bid price : 25.56 Bid-YTW : 0.94 % |
| BMO.PR.M | FixedReset | -1.73 % | YTW SCENARIO Maturity Type : Limit Maturity Maturity Date : 2039-04-22 Maturity Price : 23.76 Evaluated at bid price : 23.83 Bid-YTW : 3.99 % |
| BAM.PR.J | OpRet | -1.18 % | YTW SCENARIO Maturity Type : Soft Maturity Maturity Date : 2018-03-30 Maturity Price : 25.00 Evaluated at bid price : 21.00 Bid-YTW : 8.05 % |
| NA.PR.N | FixedReset | -1.14 % | YTW SCENARIO Maturity Type : Limit Maturity Maturity Date : 2039-04-22 Maturity Price : 24.16 Evaluated at bid price : 24.23 Bid-YTW : 4.27 % |
| CM.PR.D | Perpetual-Discount | -1.11 % | YTW SCENARIO Maturity Type : Limit Maturity Maturity Date : 2039-04-22 Maturity Price : 20.58 Evaluated at bid price : 20.58 Bid-YTW : 7.03 % |
| BNA.PR.C | SplitShare | 1.25 % | Asset coverage of 1.7+:1 as of March 31, according to the company. YTW SCENARIO Maturity Type : Hard Maturity Maturity Date : 2019-01-10 Maturity Price : 25.00 Evaluated at bid price : 12.98 Bid-YTW : 13.58 % |
| BMO.PR.K | Perpetual-Discount | 1.27 % | YTW SCENARIO Maturity Type : Limit Maturity Maturity Date : 2039-04-22 Maturity Price : 20.00 Evaluated at bid price : 20.00 Bid-YTW : 6.70 % |
| BMO.PR.O | FixedReset | 1.27 % | YTW SCENARIO Maturity Type : Call Maturity Date : 2014-06-24 Maturity Price : 25.00 Evaluated at bid price : 26.29 Bid-YTW : 5.51 % |
| CIU.PR.A | Perpetual-Discount | 1.28 % | YTW SCENARIO Maturity Type : Limit Maturity Maturity Date : 2039-04-22 Maturity Price : 18.26 Evaluated at bid price : 18.26 Bid-YTW : 6.41 % |
| TD.PR.Y | FixedReset | 1.32 % | YTW SCENARIO Maturity Type : Limit Maturity Maturity Date : 2039-04-22 Maturity Price : 22.94 Evaluated at bid price : 23.00 Bid-YTW : 4.17 % |
| TD.PR.E | FixedReset | 1.36 % | YTW SCENARIO Maturity Type : Call Maturity Date : 2014-05-30 Maturity Price : 25.00 Evaluated at bid price : 26.05 Bid-YTW : 5.31 % |
| RY.PR.L | FixedReset | 1.40 % | YTW SCENARIO Maturity Type : Limit Maturity Maturity Date : 2039-04-22 Maturity Price : 24.55 Evaluated at bid price : 24.60 Bid-YTW : 4.81 % |
| MFC.PR.C | Perpetual-Discount | 1.57 % | YTW SCENARIO Maturity Type : Limit Maturity Maturity Date : 2039-04-22 Maturity Price : 16.80 Evaluated at bid price : 16.80 Bid-YTW : 6.80 % |
| TD.PR.G | FixedReset | 1.60 % | YTW SCENARIO Maturity Type : Call Maturity Date : 2014-05-30 Maturity Price : 25.00 Evaluated at bid price : 26.03 Bid-YTW : 5.32 % |
| IAG.PR.A | Perpetual-Discount | 1.85 % | YTW SCENARIO Maturity Type : Limit Maturity Maturity Date : 2039-04-22 Maturity Price : 16.00 Evaluated at bid price : 16.00 Bid-YTW : 7.29 % |
| TD.PR.A | FixedReset | 1.85 % | YTW SCENARIO Maturity Type : Limit Maturity Maturity Date : 2039-04-22 Maturity Price : 23.66 Evaluated at bid price : 23.70 Bid-YTW : 4.27 % |
| TD.PR.S | FixedReset | 2.00 % | YTW SCENARIO Maturity Type : Limit Maturity Maturity Date : 2039-04-22 Maturity Price : 22.92 Evaluated at bid price : 23.00 Bid-YTW : 4.05 % |
| BAM.PR.O | OpRet | 2.42 % | YTW SCENARIO Maturity Type : Option Certainty Maturity Date : 2013-06-30 Maturity Price : 25.00 Evaluated at bid price : 23.31 Bid-YTW : 7.01 % |
| CU.PR.A | Perpetual-Discount | 3.31 % | YTW SCENARIO Maturity Type : Limit Maturity Maturity Date : 2039-04-22 Maturity Price : 23.73 Evaluated at bid price : 24.03 Bid-YTW : 6.13 % |
| Volume Highlights | |||
| Issue | Index | Shares Traded |
Notes |
| BAM.PR.N | Perpetual-Discount | 84,625 | RBC crossed 25,000 at 14.38; Scotia crossed the same amount at the same price. YTW SCENARIO Maturity Type : Limit Maturity Maturity Date : 2039-04-22 Maturity Price : 14.29 Evaluated at bid price : 14.29 Bid-YTW : 8.44 % |
| RY.PR.X | FixedReset | 62,739 | Recent new issue. YTW SCENARIO Maturity Type : Call Maturity Date : 2014-09-23 Maturity Price : 25.00 Evaluated at bid price : 25.81 Bid-YTW : 5.66 % |
| BNS.PR.Q | FixedReset | 60,481 | Nesbitt bought 15,000 from anonymous at 23.98; anonymous crossed (? not necessarily the same anonymous) 18,000 at 22.70. The massive discrepency in prices appears legitimate; today’s range according to tmxmoney.com was 22.55-24.05. Closing quote 22.75-88, 21×8. YTW SCENARIO Maturity Type : Limit Maturity Maturity Date : 2039-04-22 Maturity Price : 22.69 Evaluated at bid price : 22.75 Bid-YTW : 4.19 % |
| HSB.PR.E | FixedReset | 51,841 | Recent new issue. YTW SCENARIO Maturity Type : Call Maturity Date : 2014-07-30 Maturity Price : 25.00 Evaluated at bid price : 25.55 Bid-YTW : 6.25 % |
| RY.PR.T | FixedReset | 36,630 | YTW SCENARIO Maturity Type : Limit Maturity Maturity Date : 2039-04-22 Maturity Price : 23.36 Evaluated at bid price : 25.75 Bid-YTW : 5.74 % |
| BNS.PR.M | Perpetual-Discount | 35,071 | RBC bought 12,000 from Nesbitt at 17.74. YTW SCENARIO Maturity Type : Limit Maturity Maturity Date : 2039-04-22 Maturity Price : 17.63 Evaluated at bid price : 17.63 Bid-YTW : 6.42 % |
| There were 36 other index-included issues trading in excess of 10,000 shares. | |||
FDIC Releases 4Q08 Banking Profile
The Federal Deposit Insurance Corporation has announced the release of the 4Q08 Banking Profile, containing two feature articles:
The guts of the full report is the report of banking system statistical information, which begins with the cheery sentence:
FDIC-insured institutions reported a net loss of $32.1 billion in the fourth quarter of 2008, a decline of $32.7 billion from the $575 million that the industry earned in the fourth quarter of 2007 and the first quarterly loss since 1990. Rising loan loss provisions, large writedowns of goodwill and other assets, and sizable losses in trading accounts all contributed to the industry’s net loss. More than two-thirds of all insured institutions were profitable in the fourth quarter, but their earnings were outweighed by large losses at a number of big banks.

Chart 2 looks like it was prepared by a graphic artist who didn’t really know what the data meant, but the important information can be puzzled out:

Assiduous Readers will remember I have taken a certain amount of glee in pointing out that the story so far is still not as bad as the Recession of 1990 (you young whipper-snappers) … but we’re getting there, at least in the States:

… with the result that those who blithely assumed refinancing risk are feeling a little nervous:

Note that the release of the statistical data has been previously discussed on PrefBlog.
IMF Presents Model of Corporate Bond Spreads
The IMF has released its Global Financial Stability Report for April 09 (hat tip: Menzie Chinn of Econbrowser), in which they highlight some work by Sergei Antoshin on corporate bond spreads.
Box 1.5 on page 51 of the PDF is hardly a full academic treatise, but we can take things as they come:
This study attempts to model corporate bond spreads based on a cash-flows approach to explain the underlying key drivers. The equilibrium spreads are ultimately determined by cash flows or internal funds available to bond issuers and bond buyers. The study identifies factors affecting the cash flows from operating, investing, and financing activities across the major classes of bond issuers and bond holders. The drivers are intended to represent expected profitability, uncertainty, and liquidity constraints. The model displays linkages among financial strains in major sectors of the economy, asset returns, financial and economic risks, macroeconomic activity, and losses in the system.
Previous studies of corporate spreads have found it difficult to explain the sharp increase in spreads during the recent crisis. The conventional approach is to regress spreads on a broad range of macroeconomic and financial variables. Large residuals arising from these models are attributed to an unexplained component driven by illiquidity premia. In this study, spreads are modeled by explicitly accounting for illiquidity premia and funding strains.
…
The capital flows framework developed in this study allows one to capture explicitly the effects of stress in various economic sectors on corporate spreads. The analysis suggests that corporate spreads can be largely explained by the fundamentals and risks related to both uncertainty and financing constraints. Policy implications should be drawn with caution, since, as with any regression analysis, the equations display measures of correlation rather than causality. For example, if the LIBOR-OIS spread were to decline by 50 basis points—possibly as a result of some policy action—it would be associated with a roughly 100 basis point decline in corporate spreads. This provides some perspective on the scale of challenges and potential benefits for policymakers contemplating intervention in the market for corporate finance.
I’m suspicious of the high degree of parameterization and the relatively short period shown in the graph; there’s not really a lot of meat given in the box to determine whether the author’s genuinely on to something or not.

