There’s some disinflationary news from India:
Reserve Bank of India Governor Raghuram Rajan cut interest rates in an unscheduled review to revive growth in Asia’s third-largest economy after inflation eased. Stocks, bonds and the rupee surged.
Rajan lowered the benchmark repurchase rate to 7.75 percent from 8 percent, he said in a statement today, the first reduction since May 2013. Consumer-price inflation will probably be below the central bank’s target of 6 percent by January 2016, he said.
…
Rajan has focused on quelling inflation since taking office in September 2013, and today’s move signals confidence that price pressures will remain under control. It sets India on a different path from Brazil and Russia, which raised rates in December to tame inflation and support their currencies.
And here’s a new twist to currency wars:
At 9:30 a.m. today, trading floors across the City of London erupted.
Outbursts of obscenities and confusion followed the Swiss central bank’s surprise decision to abolish its three-year-old policy of capping the Swiss franc against the euro, according to traders in London’s financial district. The U-turn sent the franc as much as 41 percent up against the euro, the biggest gain on record, a move that one trader estimated may cause billions of dollars of losses for banks and their customers.
…
As the franc spiked, investors said they found themselves unable to trade it amid a lack of price quotes.“There was a good hour when euro-swiss was untradeable,” said Chris Morrison, London-based head of strategy at Omni Macro Fund, a hedge fund which oversees $550 million. “Clearly there was no liquidity.”
Forex.com, a currency-trading website, said it halted services briefly “until we get confirmation from our liquidity providers that we can get Swissie liquidity.” Dealing resumed at about 10:30 a.m. London time.
…
Anthony Peters, a broker at Swiss Investment Corp., said firms that were selling options tied to the Swiss franc may be among today’s losers. They would have lost money as volatility surged.“Selling puts or vol on the franc was deemed to be SNB guaranteed money for old rope,” he wrote in a note to clients today. “There will be some very red faces around as it begins to transpire who should not have been playing that game.”
Sometimes we have to leave Never-Never Land:
“The decision has been a surprise for markets — you can’t do it in any other way,” SNB President Jordan told reporters in Zurich today. “We came to conclusion that it’s not a sustainable policy.”
The change comes just one week before ECB policy makers meet to discuss new stimulus, including quantitative easing, a move that may add to pressure on the franc against the euro.
The SNB spent billions defending the cap after introducing it in September 2011. Jordan said today it may intervene again.
“The SNB doesn’t see any future any more for their floor with the strong U.S. dollar and the QE ahead at the ECB,” said Alessandro Bee, strategist at Bank J Safra Sarasin AG in Zurich.
I tip my hat to those who followed the example of George Soros and decided that the CHF/EUR rate was unsustainable. Sometimes the politicians and bureaucrats just need to be TOLD!
It looks like Canada is off Target:
Target Corp. (TGT) will walk away from Canada less than two years after opening stores there, putting an end to a mismanaged expansion that racked up billions in losses.
The Canadian division, which employs 17,600 people, is seeking court approval to begin liquidation, the Minneapolis-based retailer said today in a statement. Dismantling operations north of the border will lead to a $5.4 billion writedown this quarter, though it will boost profit by next year, Target said.
Fixing the Canada unit, which had amassed more than $2 billion in operating losses since 2011, has been a top priority for Chief Executive Officer Brian Cornell. After taking the reins in August, he spent a portion of his early days at the company touring operations in the country. The woes plaguing the chain’s 133 stores there ranged from empty shelves to prices being higher than at locations in the U.S.
“We were unable to find a realistic scenario that would get Target Canada to profitability until at least 2021,” Cornell said today. “This was a very difficult decision, but it was the right decision for our company.”
DBRS therefore believes that Target’s decision to wind down its Canadian business is more reflective of the Company’s inability to achieve its own strategic, operational and financial milestones within this market rather than any indication of broader weakening of the Canadian retail sector.
…
This event, however, has no effect on ratings in the retail sector at the present time because DBRS believes that the business risk profile of the overall sector should remain within its current bandwidth over the near to medium term. This outlook is based on DBRS’s:
— view that new competition will emerge (including the impact of growing online retailing) and that the trend toward equilibrium in the sector will continue after this temporary reduction in competition;
— and concern about Canadian consumers becoming more challenged because of high debt levels as well as potentially higher interest rates and lower residential real estate prices in the future.
It was a mixed day for the Canadian preferred share market, with PerpetualDiscounts up 23bp, FixedResets off 12bp and DeemedRetractibles gaining 4bp. The Performance Highlights table is lengthy yet again, dominated by low-spread FixedReset losers as the Canada 5-Year yield dropped to an incredible 1.02%. Will we go below 1%? Place yer bets, gents, place yer bets! Volume was low.
For as long as the FixedReset market is so violently unsettled, I’ll keep publishing updates of the more interesting and meaningful series of FixedResets’ Implied Volatilities. This doesn’t include Enbridge because although Enbridge has a large number of issues outstanding, all of which are quite liquid, the range of Issue Reset Spreads is too small for decent conclusions. The low is 212bp (ENB.PR.H; second-lowest is ENB.PR.D at 237bp) and the high is a mere 268 for ENB.PF.G.
Remember that all rich /cheap assessments are:
- based on Implied Volatility Theory only
- are relative only to other FixedResets from the same issuer
- assume constant GOC-5 yield
- assume constant Implied Volatility
- assume constant spread
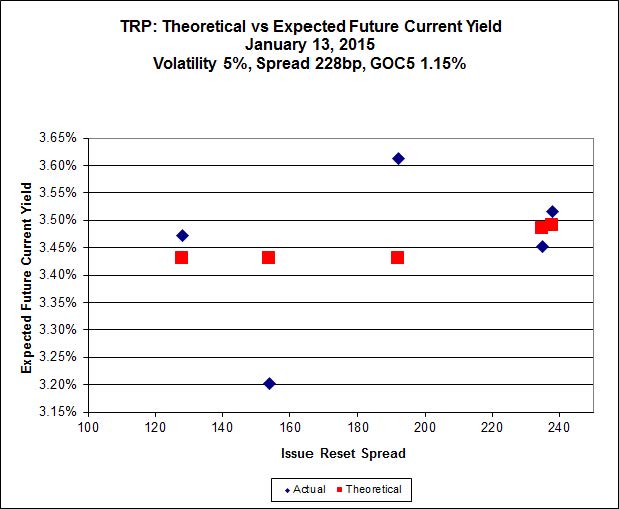
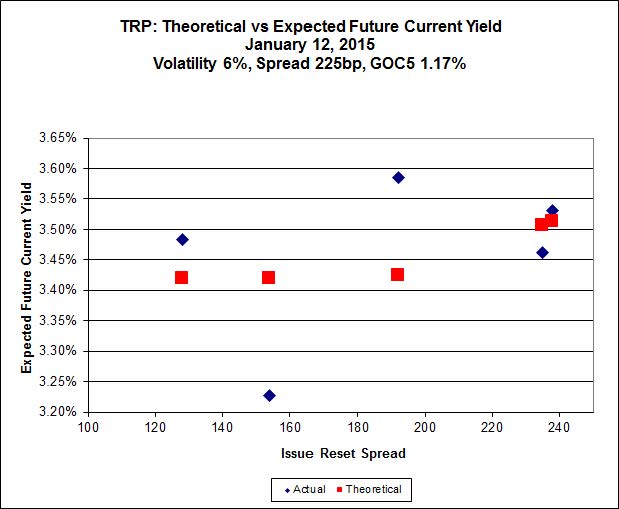
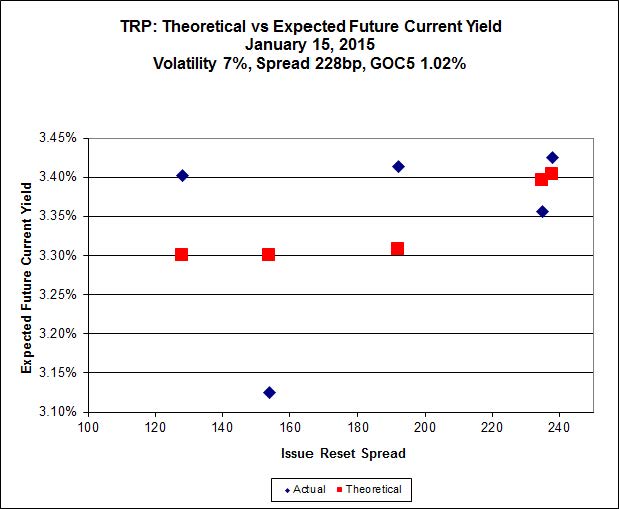
Here’s TRP:
Click for Big
So according to this, TRP.PR.A, bid at 21.53, is $0.69 cheap, but it has already reset (at +192). TRP.PR.C, bid at 20.48 and resetting at +154bp on 2016-1-30 is $1.09 rich.
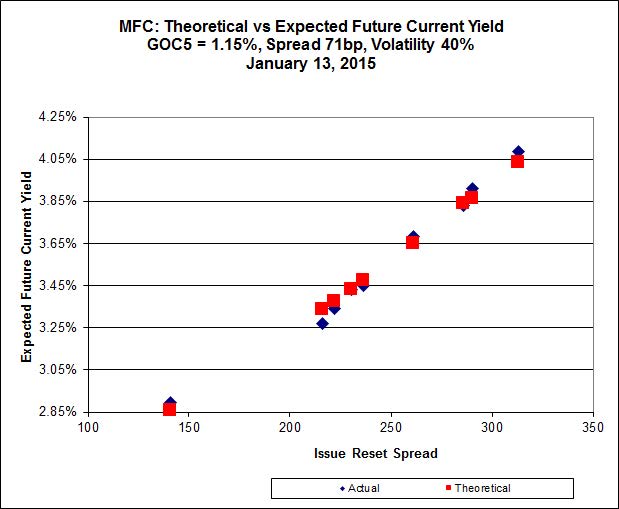
Click for Big
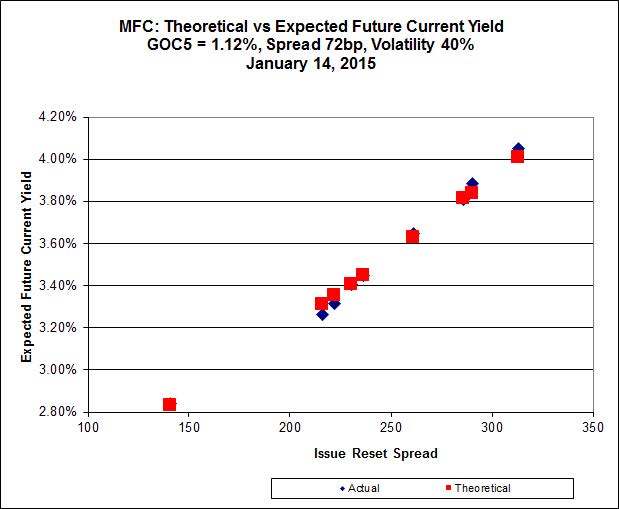
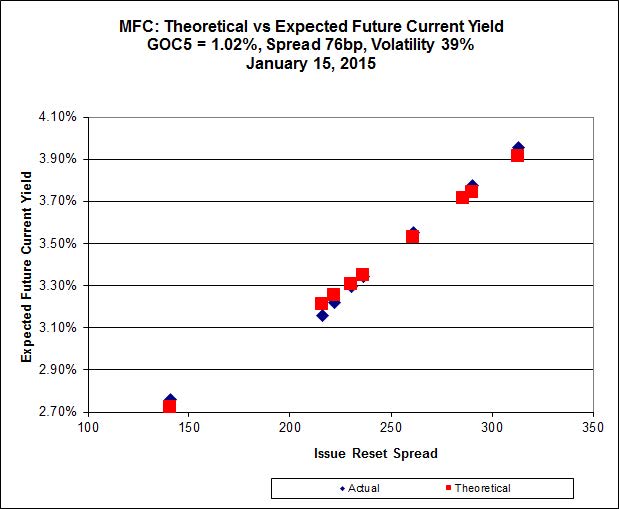
MFC.PR.F continues to be on the line defined by its peers. Implied Volatility continues to be a conundrum. It is far too high if we consider that NVCC rules will never apply to these issues; it is still too low if we consider them to be NVCC non-compliant issues (and therefore with Deemed Maturities in the call schedule).
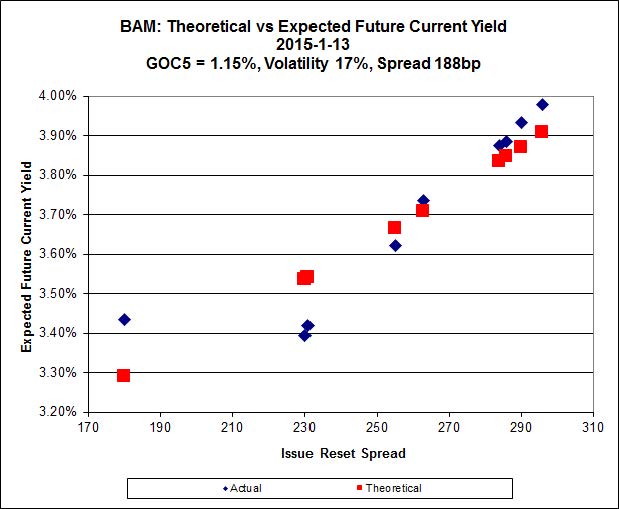
Click for Big
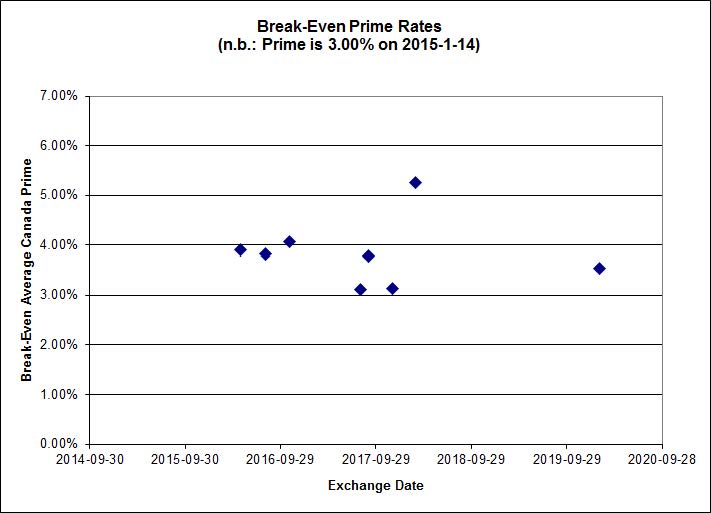
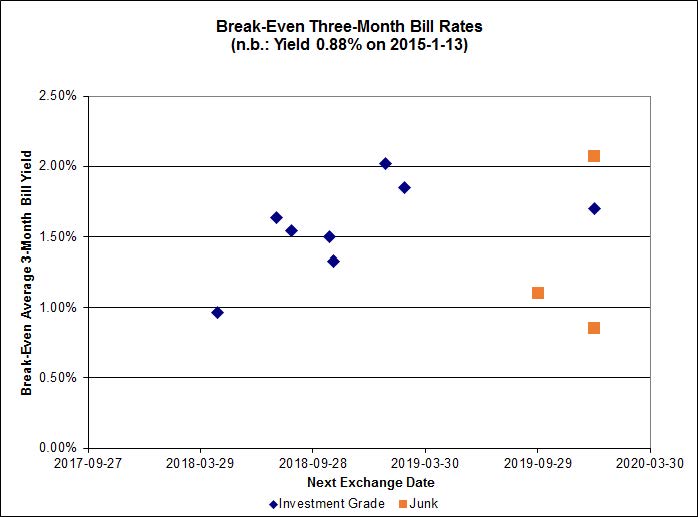
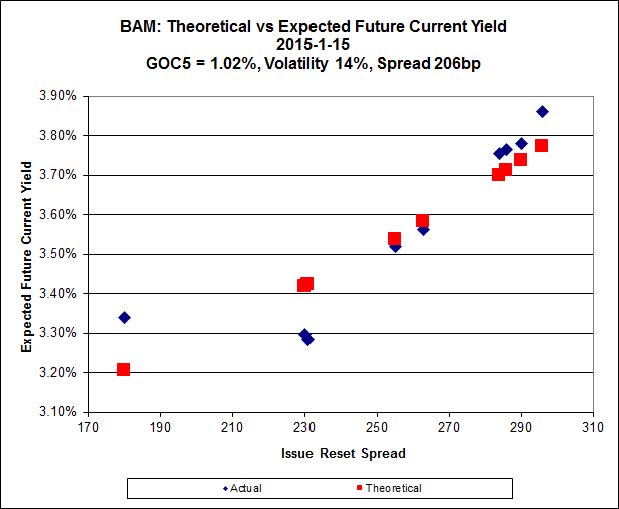
There continues to be cheapness in the lowest-spread issue, BAM.PR.X, resetting at +180bp on 2017-6-30, which is bid at 21.12 and appears to be $0.87 cheap, while BAM.PR.R, resetting at +230bp 2016-6-30 is bid at 25.18 and appears to be $0.89 rich.
It seems clear that the higher-spread issues define a curve with significantly more Implied Volatility than is calculated when the low-spread outlier is included.

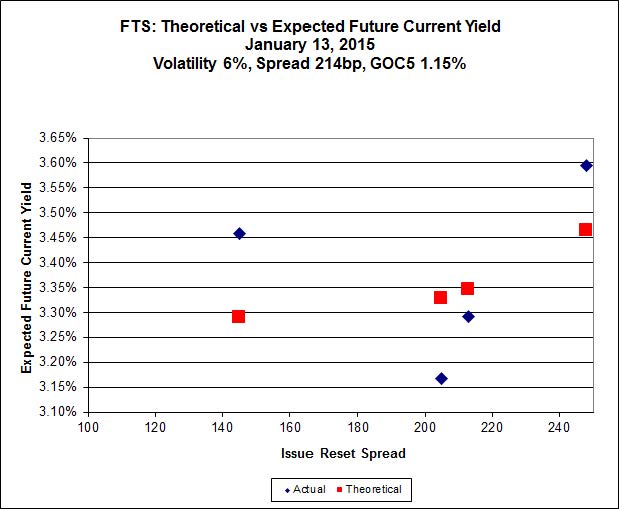
Click for Big
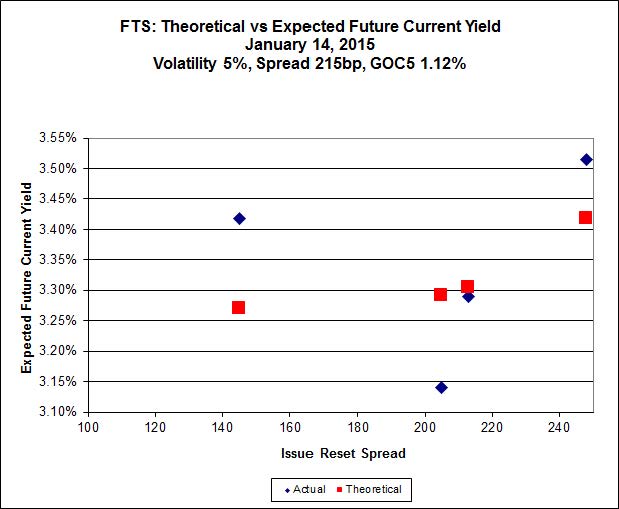
This is just weird because the middle is expensive and the ends are cheap but anyway … FTS.PR.H, with a spread of +145bp, and bid at 18.75, looks $0.79 cheap and resets 2015-6-1. FTS.PR.K, with a spread of +205bp, and bid at 25.20, looks $1.08 expensive and resets 2019-3-1
Click for Big
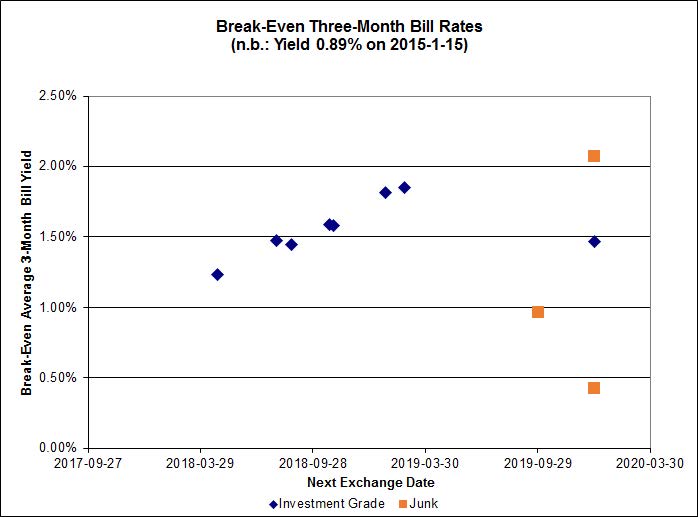
Pairs equivalence is all over the map.
And, yeah, Bell is still having network problems, and I am still using my ‘phone as a Wi-Fi hotspot. But don’t worry! Our beloved government will continue to protect us from the evils of American competition, so nobody will lose his job over this fiasco.
I’m spending $25 a day on cell phone data charges. I wonder if Bell will give me a refund.
| HIMIPref™ Preferred Indices These values reflect the December 2008 revision of the HIMIPref™ Indices Values are provisional and are finalized monthly |
|||||||
| Index | Mean Current Yield (at bid) |
Median YTW |
Median Average Trading Value |
Median Mod Dur (YTW) |
Issues | Day’s Perf. | Index Value |
| Ratchet | 0.00 % | 0.00 % | 0 | 0.00 | 0 | -0.7486 % | 2,534.5 |
| FixedFloater | 4.43 % | 3.61 % | 20,589 | 18.28 | 1 | -0.2325 % | 3,992.6 |
| Floater | 2.99 % | 3.11 % | 55,505 | 19.46 | 4 | -0.7486 % | 2,694.3 |
| OpRet | 4.04 % | 1.35 % | 95,742 | 0.42 | 1 | 0.0394 % | 2,756.4 |
| SplitShare | 4.26 % | 4.03 % | 36,072 | 3.63 | 5 | -0.1576 % | 3,206.2 |
| Interest-Bearing | 0.00 % | 0.00 % | 0 | 0.00 | 0 | 0.0394 % | 2,520.4 |
| Perpetual-Premium | 5.44 % | -6.20 % | 57,563 | 0.08 | 19 | -0.0165 % | 2,499.2 |
| Perpetual-Discount | 5.15 % | 5.00 % | 99,777 | 15.39 | 16 | 0.2325 % | 2,694.3 |
| FixedReset | 4.21 % | 3.48 % | 203,528 | 16.68 | 77 | -0.1153 % | 2,540.7 |
| Deemed-Retractible | 4.95 % | 1.11 % | 98,567 | 0.20 | 39 | 0.0356 % | 2,620.5 |
| FloatingReset | 2.70 % | 2.05 % | 61,774 | 3.43 | 7 | 0.0404 % | 2,480.2 |
| Performance Highlights | |||
| Issue | Index | Change | Notes |
| IFC.PR.A | FixedReset | -3.60 % | YTW SCENARIO Maturity Type : Hard Maturity Maturity Date : 2025-01-31 Maturity Price : 25.00 Evaluated at bid price : 21.45 Bid-YTW : 5.23 % |
| TRP.PR.B | FixedReset | -2.65 % | YTW SCENARIO Maturity Type : Limit Maturity Maturity Date : 2045-01-15 Maturity Price : 16.90 Evaluated at bid price : 16.90 Bid-YTW : 3.76 % |
| SLF.PR.G | FixedReset | -2.21 % | YTW SCENARIO Maturity Type : Hard Maturity Maturity Date : 2025-01-31 Maturity Price : 25.00 Evaluated at bid price : 20.34 Bid-YTW : 5.12 % |
| BAM.PR.X | FixedReset | -1.90 % | YTW SCENARIO Maturity Type : Limit Maturity Maturity Date : 2045-01-15 Maturity Price : 21.12 Evaluated at bid price : 21.12 Bid-YTW : 3.83 % |
| HSE.PR.A | FixedReset | -1.77 % | YTW SCENARIO Maturity Type : Limit Maturity Maturity Date : 2045-01-15 Maturity Price : 20.50 Evaluated at bid price : 20.50 Bid-YTW : 3.72 % |
| GWO.PR.N | FixedReset | -1.69 % | YTW SCENARIO Maturity Type : Hard Maturity Maturity Date : 2025-01-31 Maturity Price : 25.00 Evaluated at bid price : 20.40 Bid-YTW : 5.02 % |
| BAM.PR.B | Floater | -1.57 % | YTW SCENARIO Maturity Type : Limit Maturity Maturity Date : 2045-01-15 Maturity Price : 16.93 Evaluated at bid price : 16.93 Bid-YTW : 3.12 % |
| GWO.PR.I | Deemed-Retractible | -1.46 % | YTW SCENARIO Maturity Type : Hard Maturity Maturity Date : 2025-01-31 Maturity Price : 25.00 Evaluated at bid price : 23.02 Bid-YTW : 5.60 % |
| MFC.PR.F | FixedReset | -1.08 % | YTW SCENARIO Maturity Type : Hard Maturity Maturity Date : 2025-01-31 Maturity Price : 25.00 Evaluated at bid price : 22.01 Bid-YTW : 4.41 % |
| BAM.PR.K | Floater | -1.06 % | YTW SCENARIO Maturity Type : Limit Maturity Maturity Date : 2045-01-15 Maturity Price : 16.88 Evaluated at bid price : 16.88 Bid-YTW : 3.13 % |
| TRP.PR.A | FixedReset | 1.41 % | YTW SCENARIO Maturity Type : Limit Maturity Maturity Date : 2045-01-15 Maturity Price : 21.53 Evaluated at bid price : 21.53 Bid-YTW : 3.71 % |
| NA.PR.Q | FixedReset | 1.56 % | YTW SCENARIO Maturity Type : Call Maturity Date : 2017-11-15 Maturity Price : 25.00 Evaluated at bid price : 26.03 Bid-YTW : 2.19 % |
| Volume Highlights | |||
| Issue | Index | Shares Traded |
Notes |
| BAM.PF.G | FixedReset | 182,691 | RBC crossed 98,200 at 25.76; TD crossed 65,300 at 25.85. YTW SCENARIO Maturity Type : Limit Maturity Maturity Date : 2045-01-15 Maturity Price : 23.35 Evaluated at bid price : 25.70 Bid-YTW : 3.93 % |
| BNS.PR.R | FixedReset | 178,218 | Nesbitt crossed blocks of 124,900 and 50,000, both at 25.60. YTW SCENARIO Maturity Type : Hard Maturity Maturity Date : 2022-01-31 Maturity Price : 25.00 Evaluated at bid price : 25.56 Bid-YTW : 3.17 % |
| GWO.PR.M | Deemed-Retractible | 150,240 | Scotia crossed blocks of 100,000 and 50,000, both at 26.30. YTW SCENARIO Maturity Type : Call Maturity Date : 2015-03-31 Maturity Price : 26.00 Evaluated at bid price : 26.30 Bid-YTW : 1.06 % |
| TD.PF.C | FixedReset | 113,328 | Recent new issue. YTW SCENARIO Maturity Type : Limit Maturity Maturity Date : 2045-01-15 Maturity Price : 23.18 Evaluated at bid price : 25.06 Bid-YTW : 3.42 % |
| W.PR.H | Perpetual-Premium | 109,820 | RBC crossed 109,000 at 25.05. YTW SCENARIO Maturity Type : Call Maturity Date : 2015-02-14 Maturity Price : 25.00 Evaluated at bid price : 25.06 Bid-YTW : 2.59 % |
| MFC.PR.N | FixedReset | 106,242 | RBC crossed 25,000 at 25.16; TD crossed 56,700 at 25.25. YTW SCENARIO Maturity Type : Hard Maturity Maturity Date : 2025-01-31 Maturity Price : 25.00 Evaluated at bid price : 25.18 Bid-YTW : 3.66 % |
| NA.PR.W | FixedReset | 105,800 | Scotia crossed 60,000 at 25.08; TD crossed 35,000 at 25.07. YTW SCENARIO Maturity Type : Limit Maturity Maturity Date : 2045-01-15 Maturity Price : 23.18 Evaluated at bid price : 25.06 Bid-YTW : 3.42 % |
| There were 21 other index-included issues trading in excess of 10,000 shares. | |||
| Wide Spread Highlights | ||
| Issue | Index | Quote Data and Yield Notes |
| TRP.PR.B | FixedReset | Quote: 16.90 – 17.65 Spot Rate : 0.7500 Average : 0.5061 YTW SCENARIO |
| GWO.PR.N | FixedReset | Quote: 20.40 – 21.00 Spot Rate : 0.6000 Average : 0.3894 YTW SCENARIO |
| MFC.PR.A | OpRet | Quote: 25.37 – 25.78 Spot Rate : 0.4100 Average : 0.2249 YTW SCENARIO |
| GWO.PR.I | Deemed-Retractible | Quote: 23.02 – 23.63 Spot Rate : 0.6100 Average : 0.4315 YTW SCENARIO |
| SLF.PR.E | Deemed-Retractible | Quote: 23.31 – 23.73 Spot Rate : 0.4200 Average : 0.2795 YTW SCENARIO |
| GWO.PR.S | Deemed-Retractible | Quote: 25.82 – 26.22 Spot Rate : 0.4000 Average : 0.2742 YTW SCENARIO |