Stop me if you’ve heard this one before:
Denmark’s central bank sold a record amount of kroner last month to weaken the currency and preserve its peg to the euro as speculators test policy makers’ resolve.
The bank, which cut rates three times in January to fight back capital flows, has delivered an unprecedented package of measures to defend its currency regime. It sold 106.3 billion kroner ($16.3 billion) last month, bringing foreign reserves to a record 564.1 billion kroner. Its benchmark deposit rate is now minus 0.5 percent.
…
The krone amount sold by the central bank in January was almost three times the previous record of 38.5 billion kroner, set in May 2010. Denmark’s foreign currency reserves now equal about 29 percent of the country’s gross domestic product, Nykredit Markets said in a note. Switzerland’s foreign reserves were 80 percent of GDP before the country dropped its cap Jan. 15, according to Nykredit.
…
Record-low rates have already pushed a number of mortgage banks to say they’re looking into issuing 30-year fixed-rated loans at 1.5 percent, the lowest ever for that maturity.Yields on Danish government bonds all traded at record lows this week. Danske Bank estimates the yield on the 10-year benchmark bond may even drop below zero. It traded at about 0.2 percent today. Danish five-year yields have been negative for much of this year while two-year yields dropped below zero in December.
Short the Euro to buy oil?
Oil prices rose on Tuesday, headed for the biggest four-day advance since January 2009 as a tumbling dollar sent commodities rallying.
Despite signs that U.S. crude supplies had registered another heavy build last week, investors were growing more confident that oil prices have hit a bottom after a seven-month rout. Traders said oil bulls were encouraged by BP’s plan to cut capital expenditure by 13 per cent to $20-billion (U.S.) in 2015, which came after reductions announced by other major energy companies.
…
On Tuesday, the dollar dropped more than 1 per cent against a basket of currencies, heading for its biggest daily drop since July 2013 and boosting the value of commodities priced in the currency.
But cutting rates is becoming alarmingly popular:
As central banks outside of the United States race to the bottom on interest rates, the flight to the U.S. dollar on the promise of rising rates by the Federal Reserve is creating a new risk: That the healthy American economy could catch cold from the global rate-cutting frenzy.
Australia added to the fast-growing list of countries easing their monetary policy, cutting its key rate to 2.25 per cent from 2.5 per cent Tuesday.
…
As the rate-cutting snowballed in recent weeks, market watchers say “competitive devaluation” is playing a growing role. Countries appear to be lowering rates at least in part to discourage investors from buying their currency, as they jockey for position with trading partners doing the same.
Rob Carrick of the Globe writes a piece titled Value the dividend in your beaten down preferred shares:
One of the more shocking investing stories of this year has to be the carnage in the preferred share market.
Some preferreds were hammered during that brief hiccup in the summer of 2013 when interest rates appeared to be set for a sustained rise, and others have been brutal in early 2015, as interest rates slide. Investors who own preferred shares have to be reeling at this point. Will these popular bond alternatives ever find favour again?
…
Rate reset preferreds are designed to protect investors against rising interest rates; in a falling rate environment, they’re dead weight in the eyes of some investors.In fact, it’s rate resets that are producing particularly bad results for investors right now. The S&P/TSX preferred share index was down 4.9 per cent for the year through Feb. 3, while the BMO S&P/TSX Laddered Preferred Share Index ETF (ZPR-T), an ETF that holds rate reset preferreds, fell 7.6 per cent.
…
It’s worth noting that ZPR’s yield has reached 4.7 per cent. In a non-registered account, that yield looks even better on an after-tax basis thanks to the dividend tax credit.
I am appalled at that last paragraph. The CURRENT YIELD on ZPR may well be 4.7%, but since when is Current Yield worth any consideration at all? Particulary in an article that emphasizes the influence of a “falling rate environment”?
It was another mixed day for the Canadian preferred share market, with PerpetualDiscounts down 10bp, FixedResets up 35bp and DeemedRetractibles gaining 4bp. The Performance Highlights table is its usual incredible length, and still with a high proportion of FixedResets on the bad side … but at least this time there is a large contingent of FixedReset winners! Volume was very high.
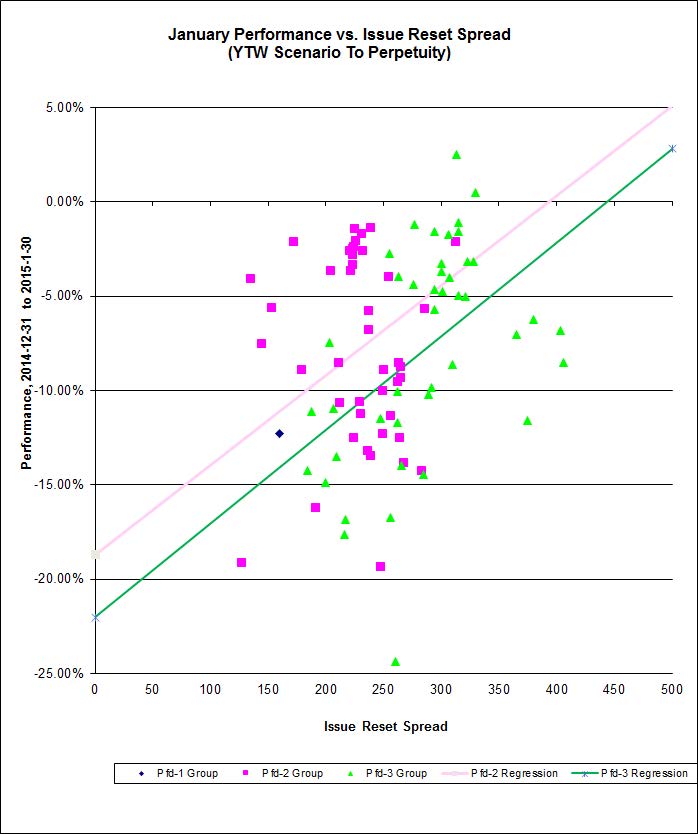
For as long as the FixedReset market is so violently unsettled, I’ll keep publishing updates of the more interesting and meaningful series of FixedResets’ Implied Volatilities. This doesn’t include Enbridge because although Enbridge has a large number of issues outstanding, all of which are quite liquid, the range of Issue Reset Spreads is too small for decent conclusions. The low is 212bp (ENB.PR.H; second-lowest is ENB.PR.D at 237bp) and the high is a mere 268 for ENB.PF.G.
Remember that all rich /cheap assessments are:
» based on Implied Volatility Theory only
» are relative only to other FixedResets from the same issuer
» assume constant GOC-5 yield
» assume constant Implied Volatility
» assume constant spread
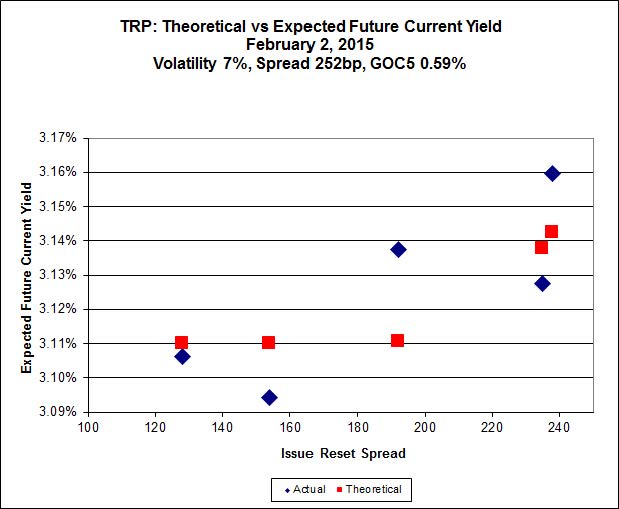
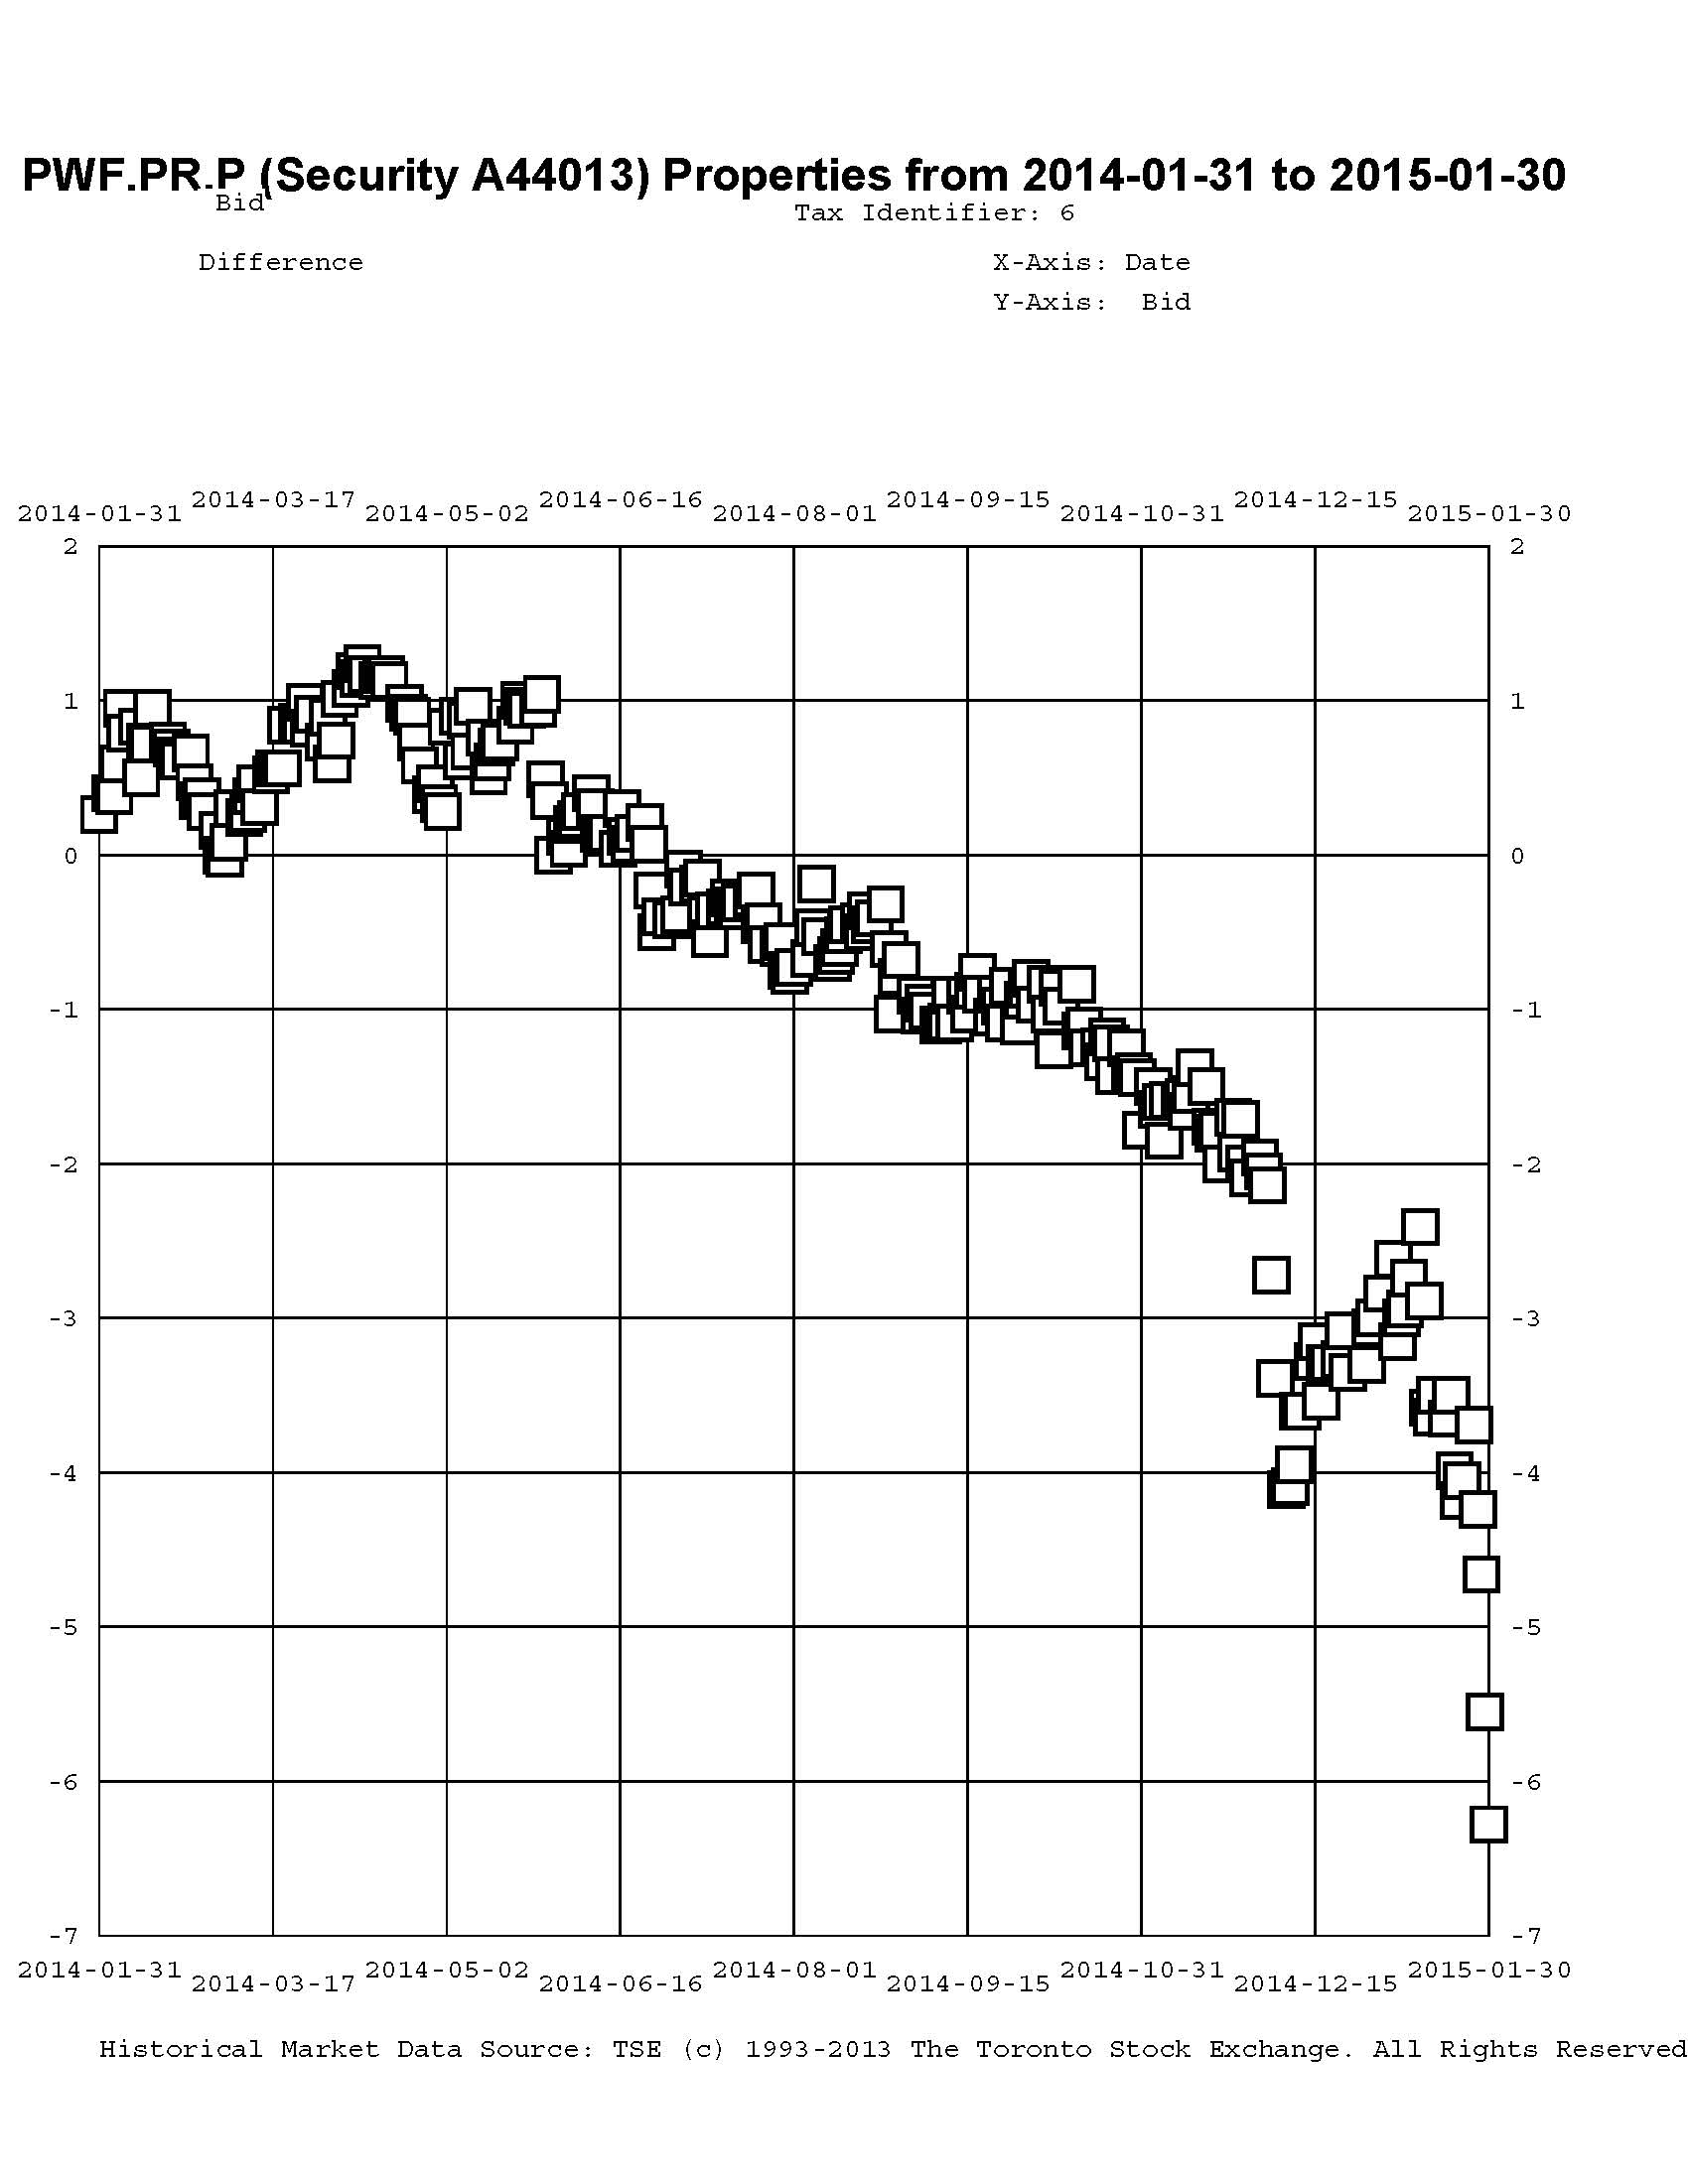
Here’s TRP:

Click for Big
Still a very good fit for the TRP FixedResets; the maximum error is for TRP.PR.B, which resets 2015-6-30 at +128, bid at 14.71 to be $0.27 cheap.

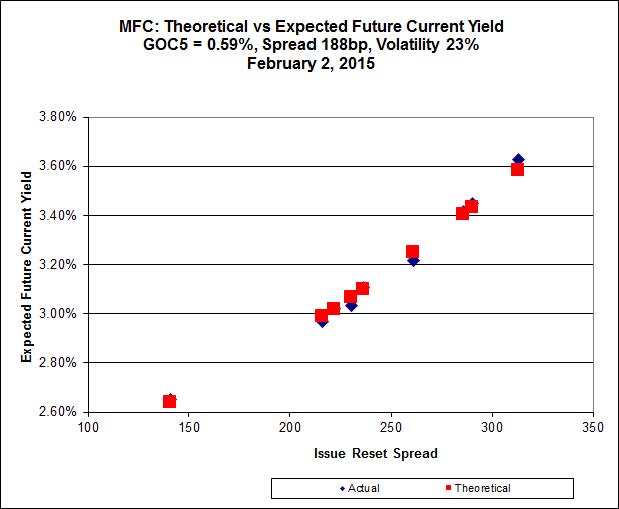
Click for Big
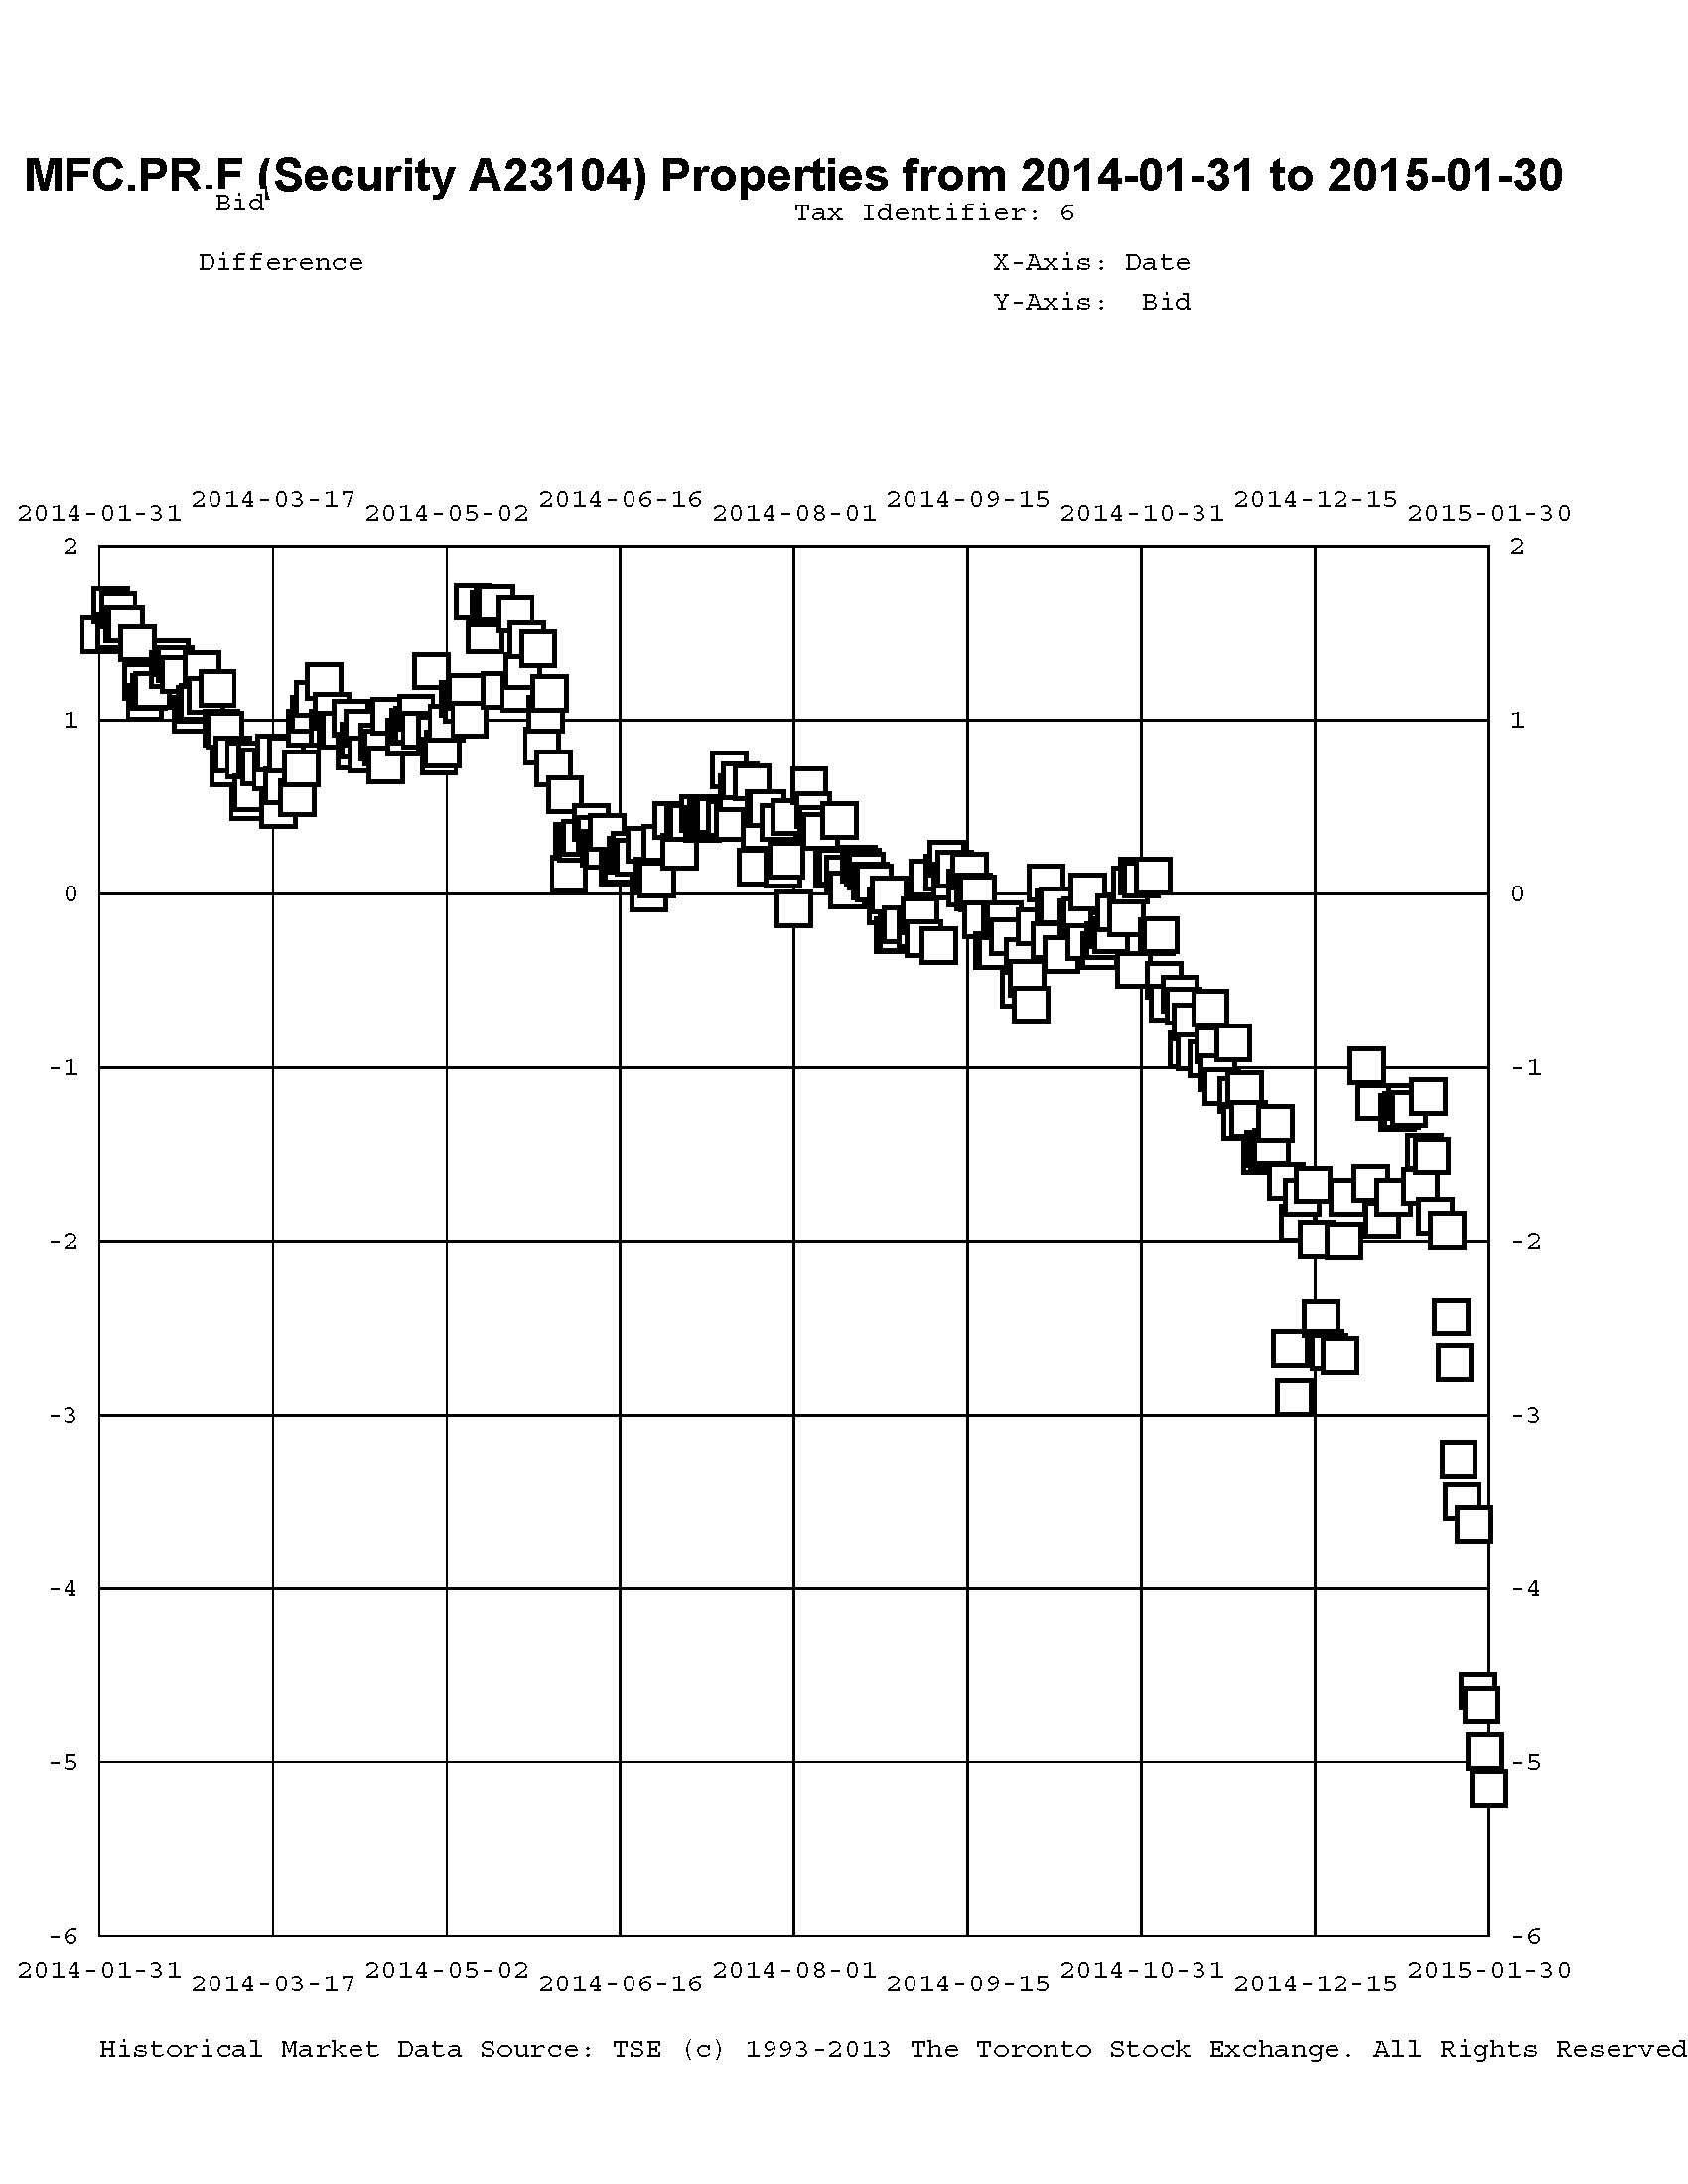
Another excellent fit, but this time the numbers are more perplexing. Implied Volatility for MFC continues to be a conundrum. It is still too high if we consider that NVCC rules will never apply to these issues; it is still too low if we consider them to be NVCC non-compliant issues (and therefore with Deemed Maturities in the call schedule).
Most expensive is MFC.PR.L, resetting at +216 on 2019-6-19, bid at 23.85 to be $0.57 rich, while MFC.PR.F, resetting at +141 on 2016-6-19, and MFC.PR.H, resetting at +313 on 2017-3-19, are bid at 19.05 and 25.86 respectively to be $0.28 cheap.

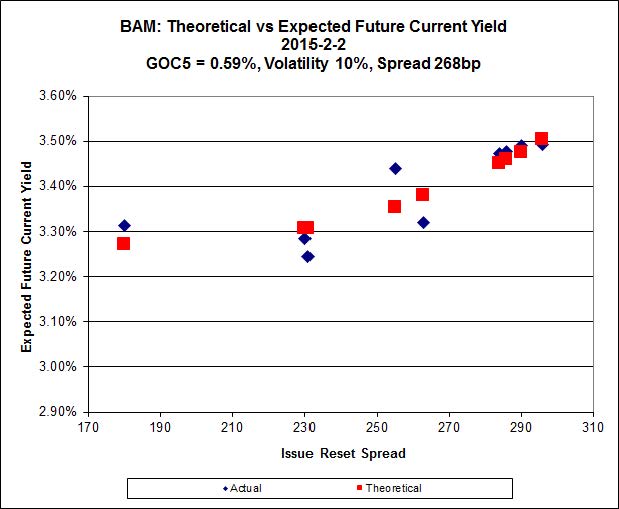
Click for Big
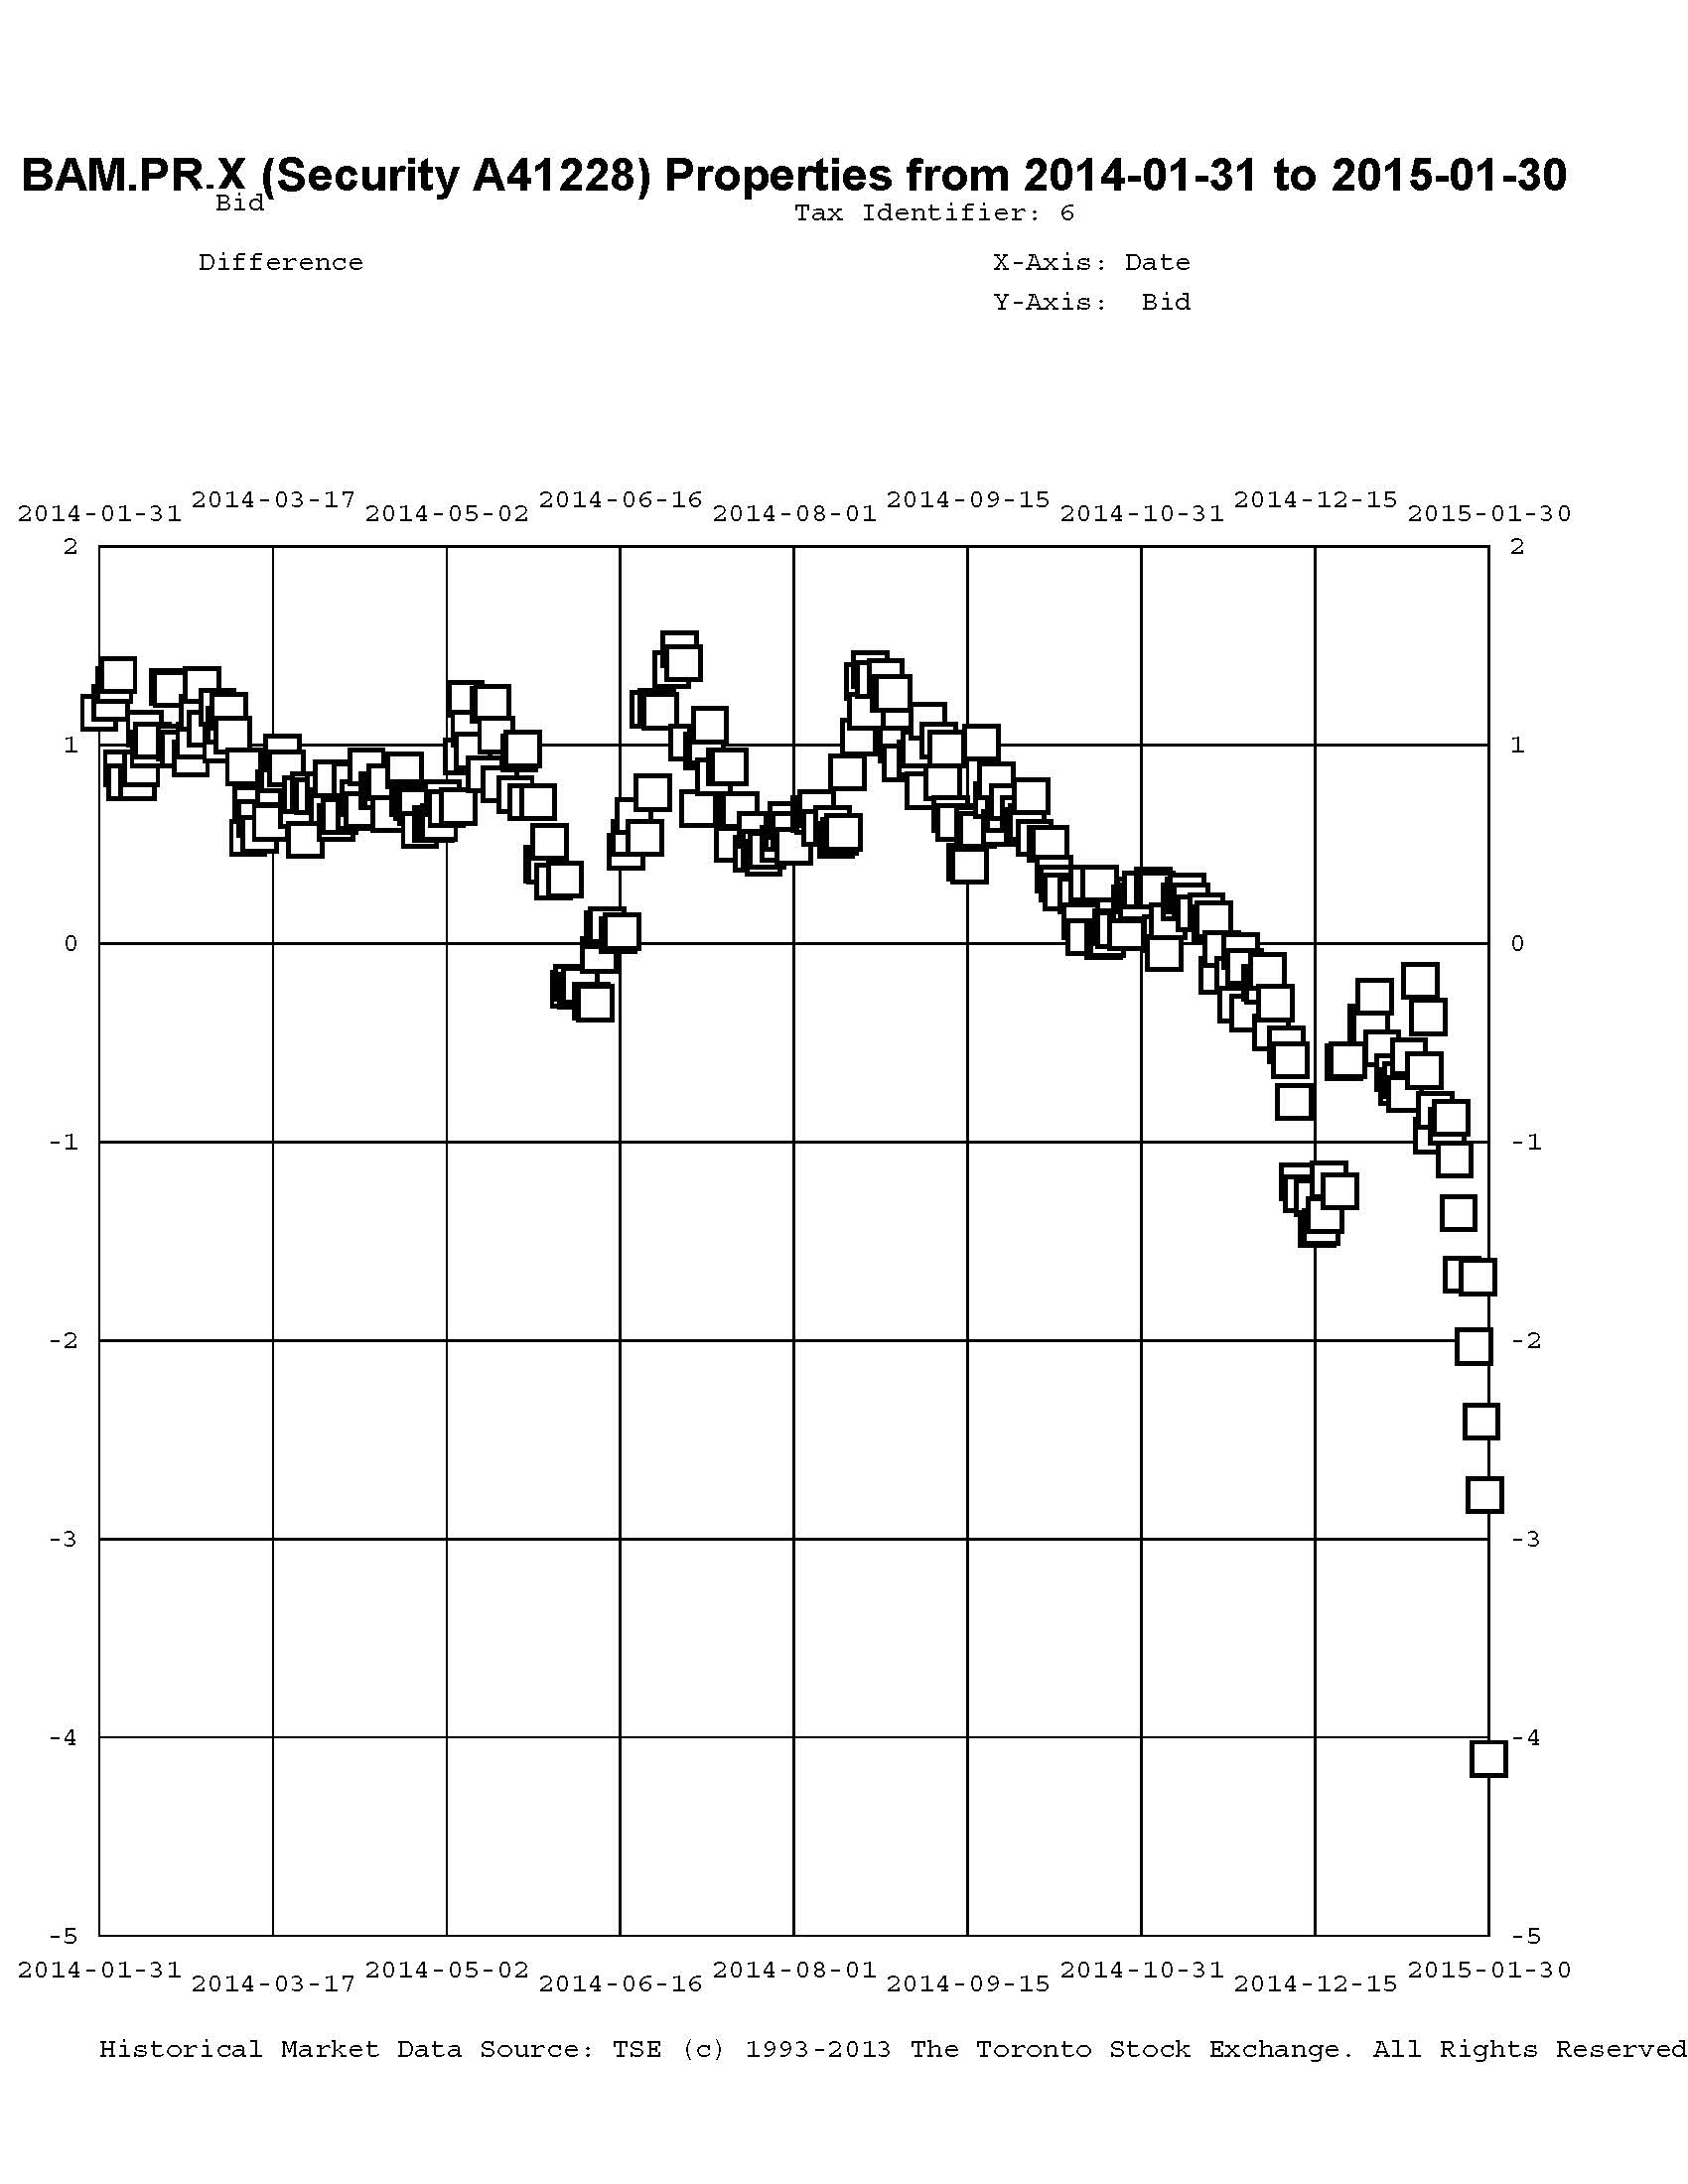
Here’s another good fit to reasonable numbers. I hope this market doesn’t start making sense, or I’ll be out of work!
The cheapest issue relative to its peers is now BAM.PR.X, resetting at +180bp on 2017-6-30, bid at 17.96 to be $0.32 cheap. BAM.PF.B, resetting at +263bp 2019-3-31 is bid at 24.30 and appears to be $0.43 rich.

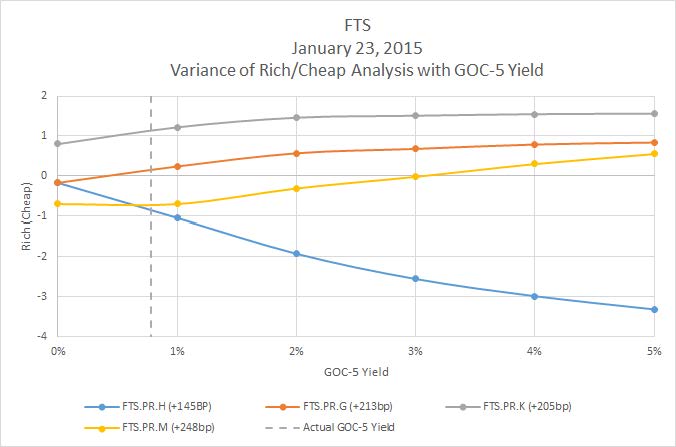
Click for Big
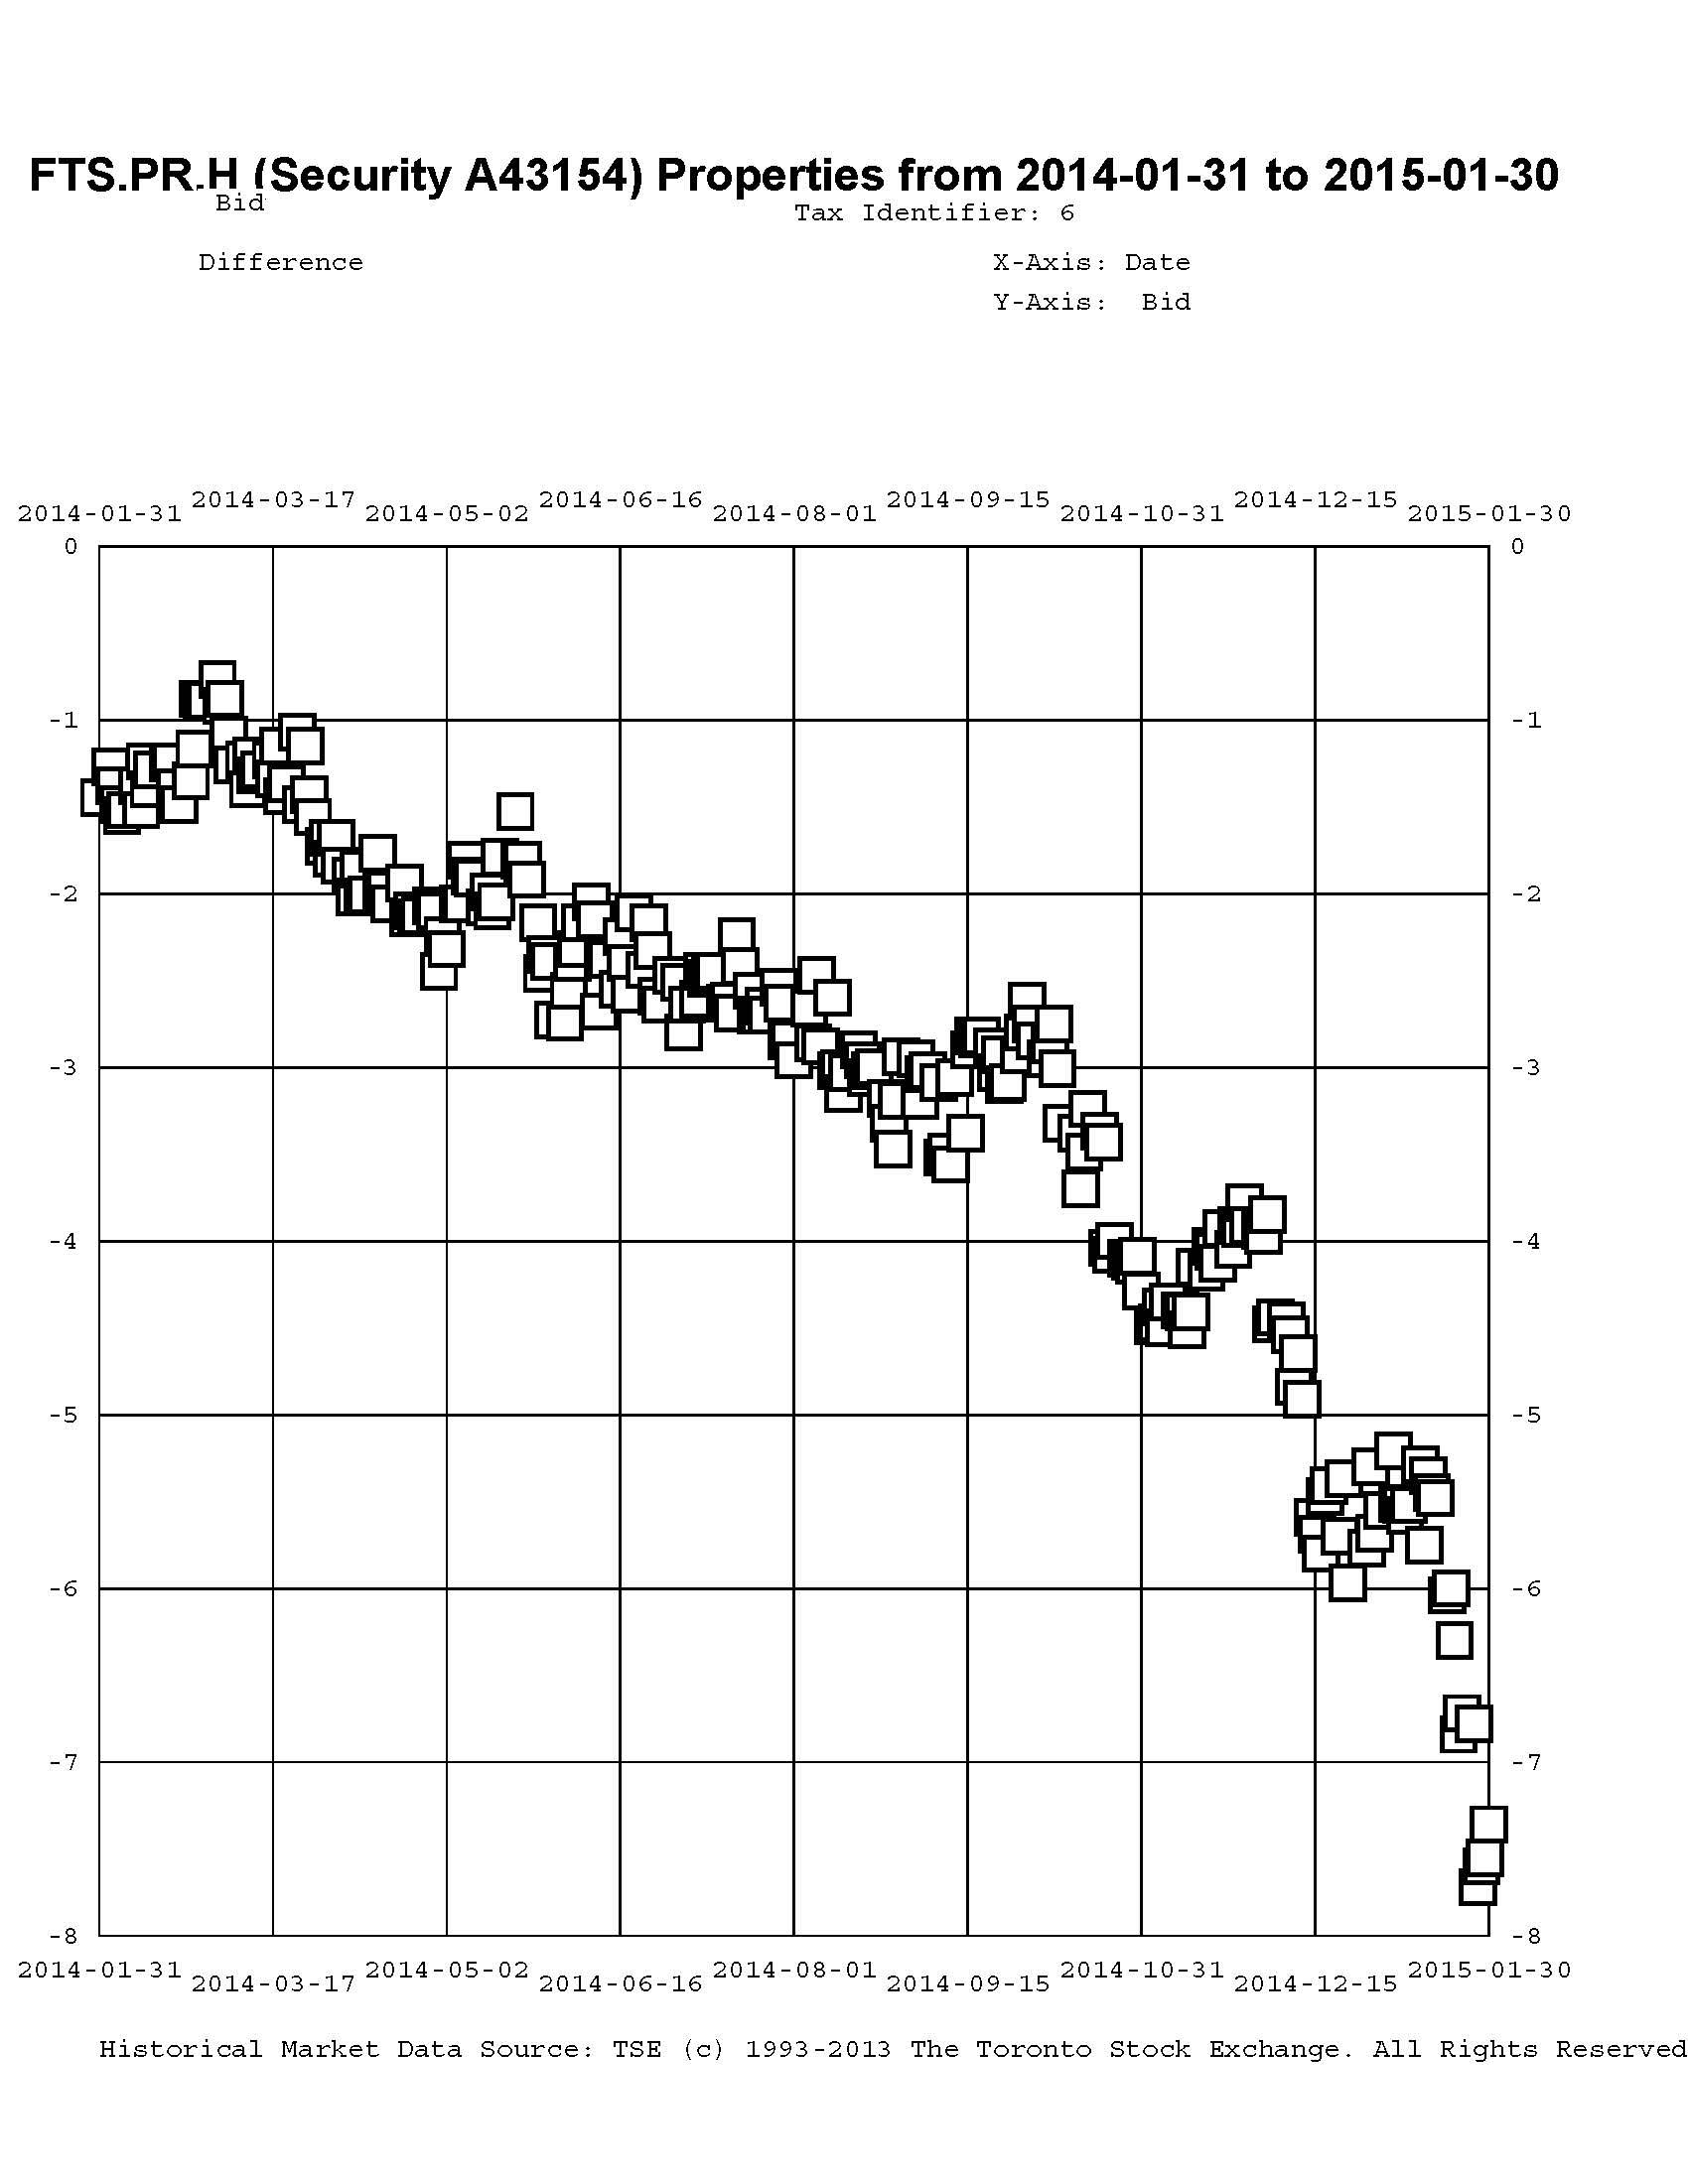
This is just weird because the middle is expensive and the ends are cheap but anyway … FTS.PR.H, with a spread of +145bp, and bid at 16.70, looks $0.80 cheap and resets 2015-6-1. FTS.PR.K, with a spread of +205bp and resetting 2019-3-1, bid at 23.15, and i $0.74 rich.

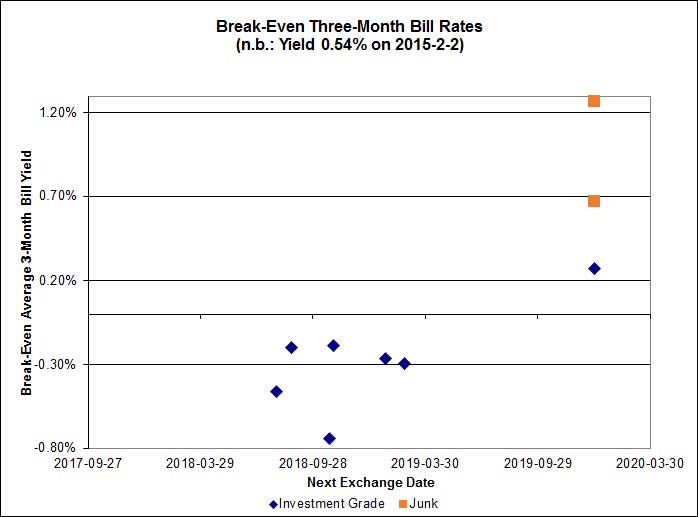
Click for Big
What can I say? Every single Investment Grade FixedReset/FloatingReset pair is now showing a negative break-even average three month bill rate until interconversion.
On the other hand, the market’s distaste for product linked to Money Market rates does not extend to prime, as shown by the FixedFloater/RatchetRate pairs:

Click for Big
Shall we just say that this exhibits a high level of confidence in the continued rapacity of Canadian banks?
| HIMIPref™ Preferred Indices These values reflect the December 2008 revision of the HIMIPref™ Indices Values are provisional and are finalized monthly |
|||||||
| Index | Mean Current Yield (at bid) |
Median YTW |
Median Average Trading Value |
Median Mod Dur (YTW) |
Issues | Day’s Perf. | Index Value |
| Ratchet | 0.00 % | 0.00 % | 0 | 0.00 | 0 | -1.2723 % | 2,159.2 |
| FixedFloater | 4.38 % | 3.55 % | 21,014 | 18.33 | 1 | -0.0922 % | 4,033.5 |
| Floater | 3.34 % | 3.53 % | 58,485 | 18.44 | 4 | -1.2723 % | 2,295.4 |
| OpRet | 4.05 % | 2.08 % | 97,195 | 0.37 | 1 | 0.0000 % | 2,750.9 |
| SplitShare | 4.28 % | 4.18 % | 33,351 | 3.98 | 5 | 0.0626 % | 3,195.9 |
| Interest-Bearing | 0.00 % | 0.00 % | 0 | 0.00 | 0 | 0.0000 % | 2,515.4 |
| Perpetual-Premium | 5.32 % | -2.45 % | 57,741 | 0.08 | 24 | 0.2177 % | 2,515.7 |
| Perpetual-Discount | 4.99 % | 4.97 % | 124,365 | 15.46 | 10 | -0.0954 % | 2,767.3 |
| FixedReset | 4.44 % | 3.42 % | 217,824 | 17.09 | 79 | 0.3459 % | 2,404.1 |
| Deemed-Retractible | 4.93 % | 1.56 % | 105,917 | 0.23 | 39 | 0.0446 % | 2,637.0 |
| FloatingReset | 2.55 % | 3.24 % | 78,385 | 6.42 | 7 | -0.0815 % | 2,279.6 |
| Performance Highlights | |||
| Issue | Index | Change | Notes |
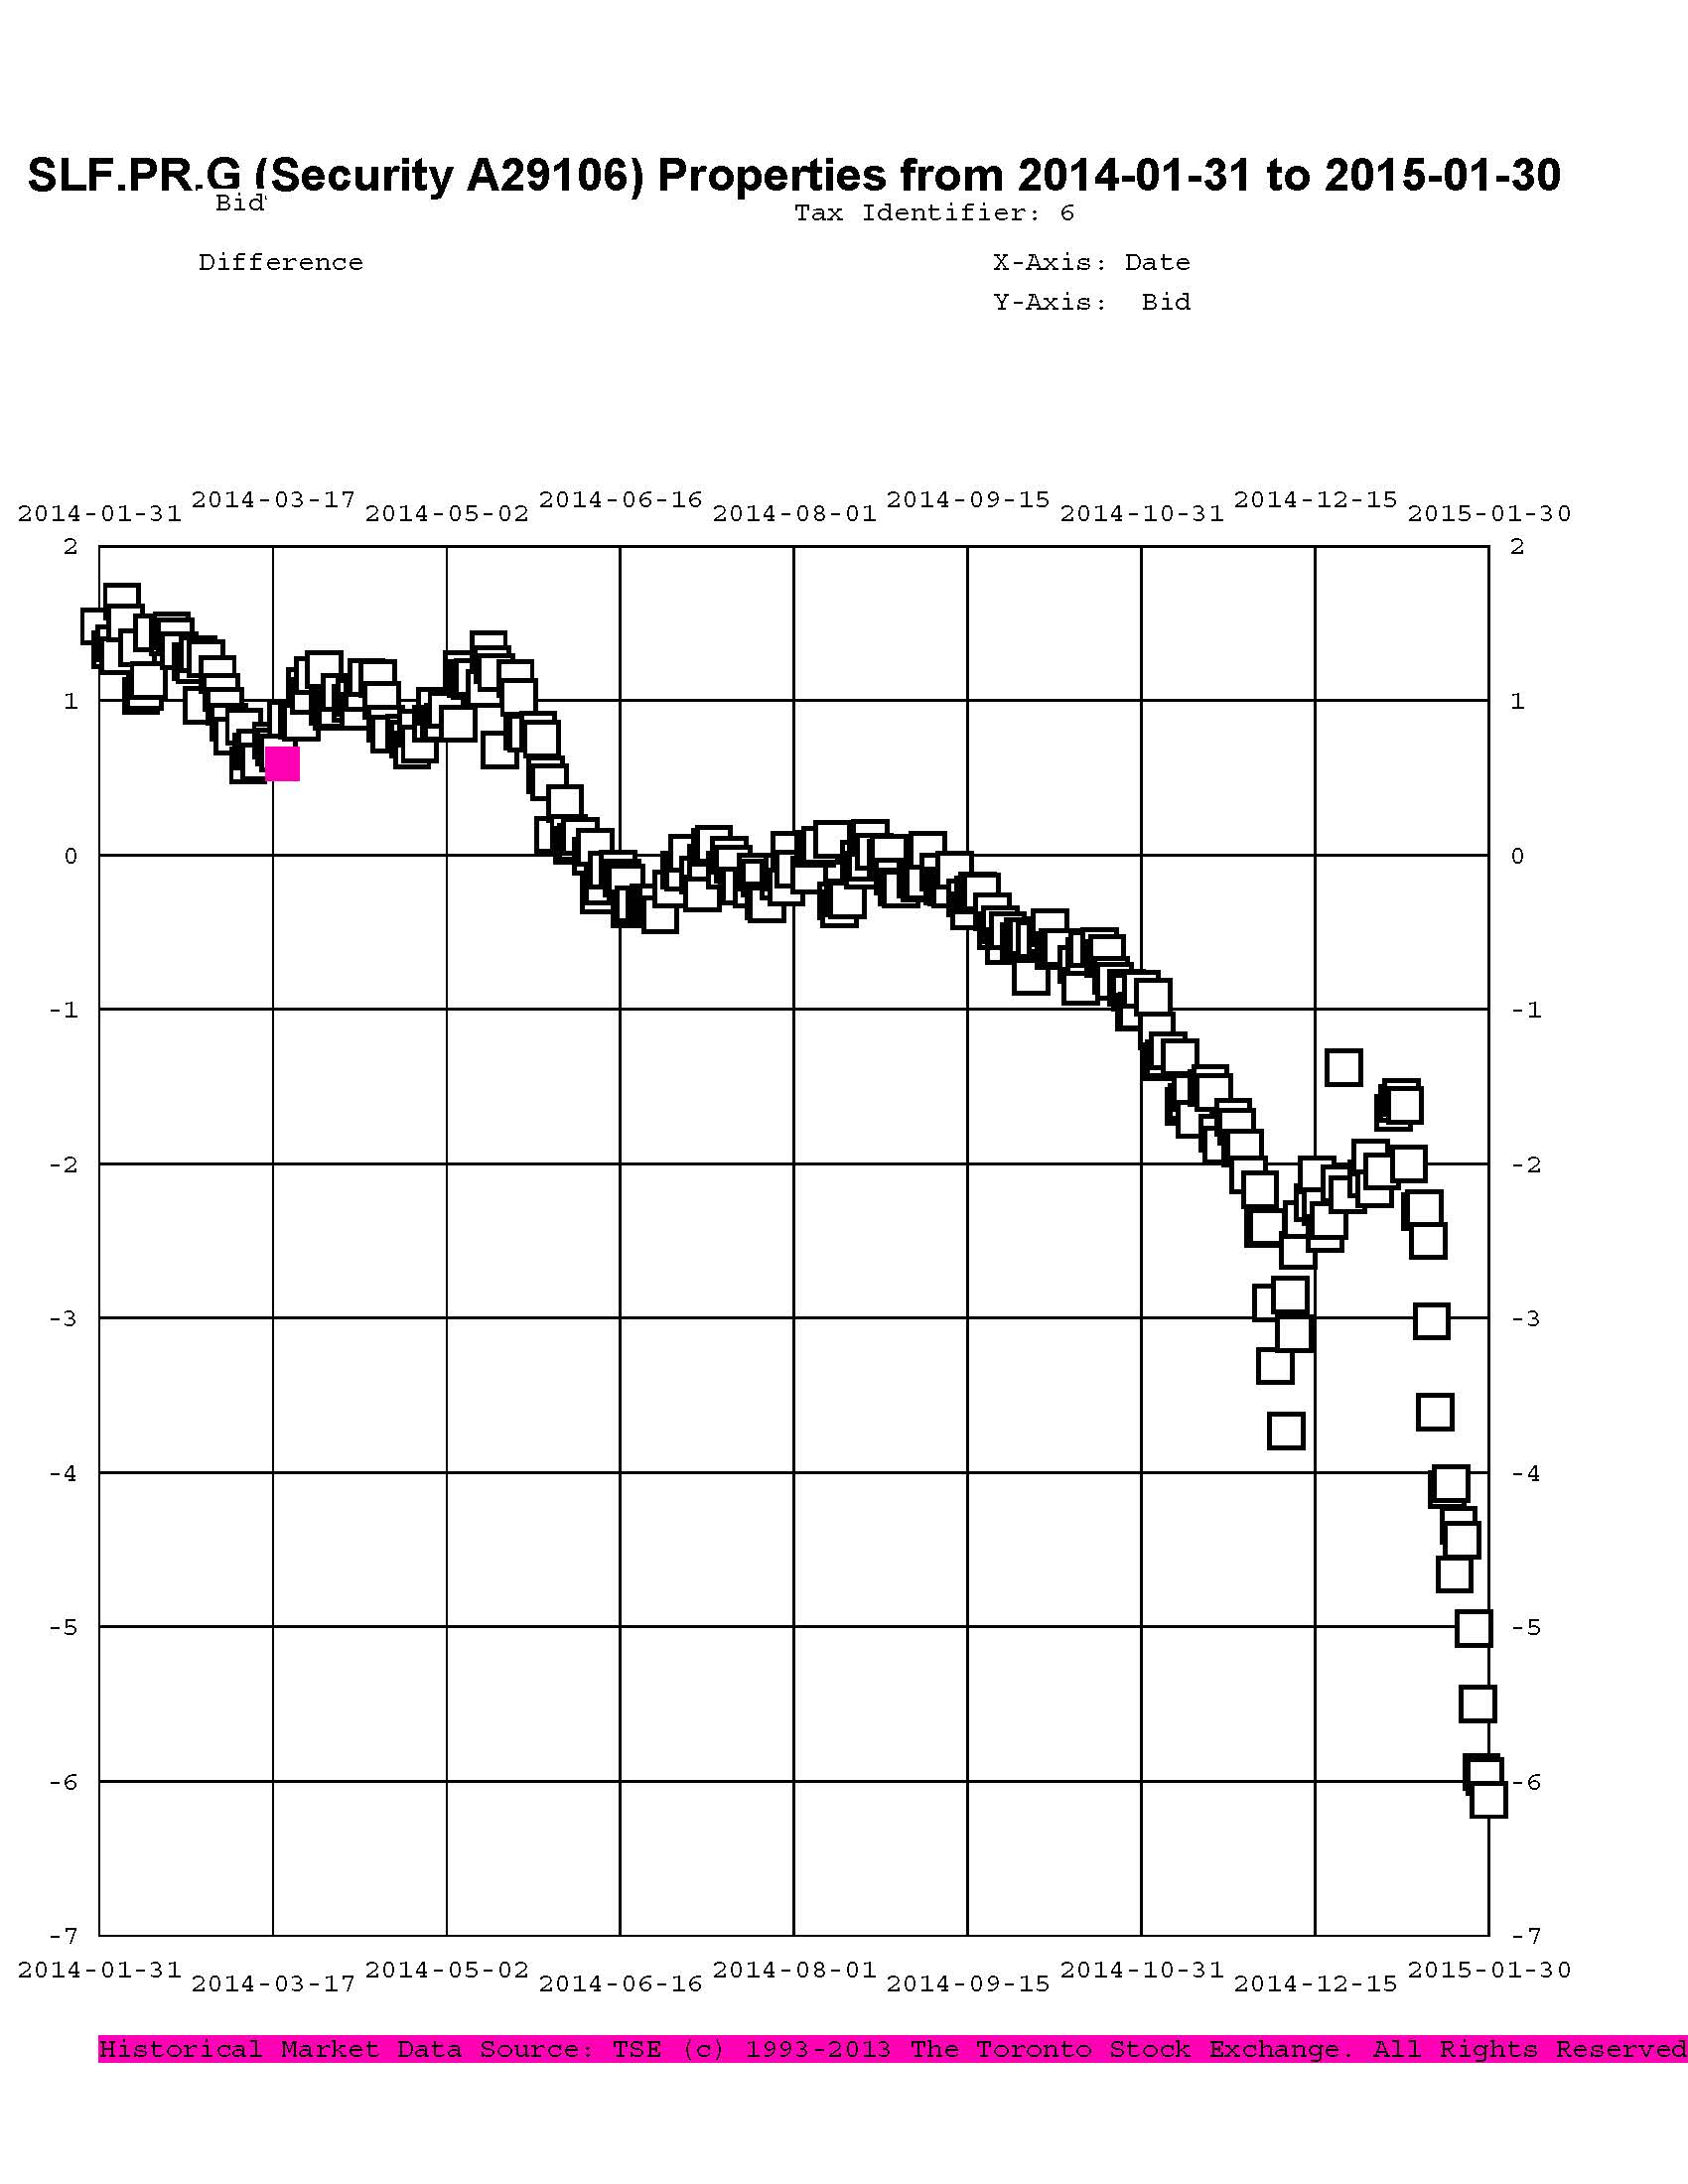
| SLF.PR.G | FixedReset | -2.94 % | YTW SCENARIO Maturity Type : Hard Maturity Maturity Date : 2025-01-31 Maturity Price : 25.00 Evaluated at bid price : 17.81 Bid-YTW : 6.00 % |
| TRP.PR.C | FixedReset | -2.73 % | YTW SCENARIO Maturity Type : Limit Maturity Maturity Date : 2045-02-03 Maturity Price : 16.74 Evaluated at bid price : 16.74 Bid-YTW : 3.33 % |
| HSE.PR.A | FixedReset | -2.47 % | YTW SCENARIO Maturity Type : Limit Maturity Maturity Date : 2045-02-03 Maturity Price : 16.60 Evaluated at bid price : 16.60 Bid-YTW : 3.71 % |
| BAM.PR.B | Floater | -2.41 % | YTW SCENARIO Maturity Type : Limit Maturity Maturity Date : 2045-02-03 Maturity Price : 14.15 Evaluated at bid price : 14.15 Bid-YTW : 3.55 % |
| TRP.PR.B | FixedReset | -2.26 % | YTW SCENARIO Maturity Type : Limit Maturity Maturity Date : 2045-02-03 Maturity Price : 14.71 Evaluated at bid price : 14.71 Bid-YTW : 3.26 % |
| FTS.PR.H | FixedReset | -2.17 % | YTW SCENARIO Maturity Type : Limit Maturity Maturity Date : 2045-02-03 Maturity Price : 16.70 Evaluated at bid price : 16.70 Bid-YTW : 3.15 % |
| TRP.PR.F | FloatingReset | -2.12 % | YTW SCENARIO Maturity Type : Limit Maturity Maturity Date : 2045-02-03 Maturity Price : 18.50 Evaluated at bid price : 18.50 Bid-YTW : 3.36 % |
| BAM.PR.C | Floater | -1.72 % | YTW SCENARIO Maturity Type : Limit Maturity Maturity Date : 2045-02-03 Maturity Price : 14.25 Evaluated at bid price : 14.25 Bid-YTW : 3.53 % |
| BNS.PR.P | FixedReset | -1.57 % | YTW SCENARIO Maturity Type : Hard Maturity Maturity Date : 2022-01-31 Maturity Price : 25.00 Evaluated at bid price : 25.10 Bid-YTW : 2.94 % |
| BAM.PR.K | Floater | -1.54 % | YTW SCENARIO Maturity Type : Limit Maturity Maturity Date : 2045-02-03 Maturity Price : 14.10 Evaluated at bid price : 14.10 Bid-YTW : 3.56 % |
| FTS.PR.K | FixedReset | -1.53 % | YTW SCENARIO Maturity Type : Limit Maturity Maturity Date : 2045-02-03 Maturity Price : 22.42 Evaluated at bid price : 23.15 Bid-YTW : 3.11 % |
| FTS.PR.G | FixedReset | -1.53 % | YTW SCENARIO Maturity Type : Limit Maturity Maturity Date : 2045-02-03 Maturity Price : 22.47 Evaluated at bid price : 23.15 Bid-YTW : 3.14 % |
| IFC.PR.A | FixedReset | -1.52 % | YTW SCENARIO Maturity Type : Hard Maturity Maturity Date : 2025-01-31 Maturity Price : 25.00 Evaluated at bid price : 19.50 Bid-YTW : 5.96 % |
| NA.PR.M | Deemed-Retractible | -1.08 % | YTW SCENARIO Maturity Type : Call Maturity Date : 2015-05-15 Maturity Price : 25.50 Evaluated at bid price : 25.67 Bid-YTW : 2.76 % |
| MFC.PR.F | FixedReset | 1.01 % | YTW SCENARIO Maturity Type : Hard Maturity Maturity Date : 2025-01-31 Maturity Price : 25.00 Evaluated at bid price : 19.05 Bid-YTW : 5.55 % |
| FTS.PR.M | FixedReset | 1.01 % | YTW SCENARIO Maturity Type : Limit Maturity Maturity Date : 2045-02-03 Maturity Price : 23.17 Evaluated at bid price : 25.00 Bid-YTW : 3.20 % |
| ENB.PF.E | FixedReset | 1.02 % | YTW SCENARIO Maturity Type : Limit Maturity Maturity Date : 2045-02-03 Maturity Price : 22.10 Evaluated at bid price : 22.73 Bid-YTW : 3.93 % |
| ENB.PR.P | FixedReset | 1.02 % | YTW SCENARIO Maturity Type : Limit Maturity Maturity Date : 2045-02-03 Maturity Price : 20.71 Evaluated at bid price : 20.71 Bid-YTW : 4.03 % |
| BAM.PF.G | FixedReset | 1.05 % | YTW SCENARIO Maturity Type : Limit Maturity Maturity Date : 2045-02-03 Maturity Price : 23.12 Evaluated at bid price : 24.95 Bid-YTW : 3.62 % |
| ENB.PF.A | FixedReset | 1.12 % | YTW SCENARIO Maturity Type : Limit Maturity Maturity Date : 2045-02-03 Maturity Price : 22.02 Evaluated at bid price : 22.56 Bid-YTW : 3.93 % |
| MFC.PR.M | FixedReset | 1.35 % | YTW SCENARIO Maturity Type : Hard Maturity Maturity Date : 2025-01-31 Maturity Price : 25.00 Evaluated at bid price : 24.07 Bid-YTW : 3.98 % |
| BNS.PR.B | FloatingReset | 1.47 % | YTW SCENARIO Maturity Type : Hard Maturity Maturity Date : 2022-01-31 Maturity Price : 25.00 Evaluated at bid price : 23.50 Bid-YTW : 3.14 % |
| MFC.PR.K | FixedReset | 1.51 % | YTW SCENARIO Maturity Type : Hard Maturity Maturity Date : 2025-01-31 Maturity Price : 25.00 Evaluated at bid price : 23.60 Bid-YTW : 3.96 % |
| ENB.PR.F | FixedReset | 1.55 % | YTW SCENARIO Maturity Type : Limit Maturity Maturity Date : 2045-02-03 Maturity Price : 21.00 Evaluated at bid price : 21.00 Bid-YTW : 3.94 % |
| TD.PF.B | FixedReset | 1.78 % | YTW SCENARIO Maturity Type : Limit Maturity Maturity Date : 2045-02-03 Maturity Price : 23.05 Evaluated at bid price : 24.58 Bid-YTW : 2.98 % |
| BAM.PF.E | FixedReset | 1.88 % | YTW SCENARIO Maturity Type : Limit Maturity Maturity Date : 2045-02-03 Maturity Price : 22.41 Evaluated at bid price : 23.25 Bid-YTW : 3.69 % |
| CU.PR.E | Perpetual-Premium | 2.22 % | YTW SCENARIO Maturity Type : Call Maturity Date : 2021-09-01 Maturity Price : 25.00 Evaluated at bid price : 25.35 Bid-YTW : 4.61 % |
| SLF.PR.H | FixedReset | 2.53 % | YTW SCENARIO Maturity Type : Hard Maturity Maturity Date : 2025-01-31 Maturity Price : 25.00 Evaluated at bid price : 24.30 Bid-YTW : 3.34 % |
| TRP.PR.E | FixedReset | 2.56 % | YTW SCENARIO Maturity Type : Limit Maturity Maturity Date : 2045-02-03 Maturity Price : 22.79 Evaluated at bid price : 24.00 Bid-YTW : 3.28 % |
| MFC.PR.L | FixedReset | 2.98 % | YTW SCENARIO Maturity Type : Hard Maturity Maturity Date : 2025-01-31 Maturity Price : 25.00 Evaluated at bid price : 23.85 Bid-YTW : 3.93 % |
| BNS.PR.Y | FixedReset | 3.17 % | YTW SCENARIO Maturity Type : Hard Maturity Maturity Date : 2022-01-31 Maturity Price : 25.00 Evaluated at bid price : 21.82 Bid-YTW : 3.76 % |
| TD.PF.C | FixedReset | 4.26 % | YTW SCENARIO Maturity Type : Limit Maturity Maturity Date : 2045-02-03 Maturity Price : 22.98 Evaluated at bid price : 24.50 Bid-YTW : 3.02 % |
| Volume Highlights | |||
| Issue | Index | Shares Traded |
Notes |
| RY.PR.J | FixedReset | 464,210 | Recent new issue. YTW SCENARIO Maturity Type : Limit Maturity Maturity Date : 2045-02-03 Maturity Price : 23.14 Evaluated at bid price : 24.99 Bid-YTW : 3.27 % |
| TD.PF.B | FixedReset | 70,917 | RBC crossed 48,500 at 24.65. YTW SCENARIO Maturity Type : Limit Maturity Maturity Date : 2045-02-03 Maturity Price : 23.05 Evaluated at bid price : 24.58 Bid-YTW : 2.98 % |
| MFC.PR.N | FixedReset | 61,250 | Scotia crossed 36,600 at 23.90. YTW SCENARIO Maturity Type : Hard Maturity Maturity Date : 2025-01-31 Maturity Price : 25.00 Evaluated at bid price : 24.00 Bid-YTW : 3.97 % |
| SLF.PR.G | FixedReset | 60,505 | RBC crossed 51,000 at 18.66. YTW SCENARIO Maturity Type : Hard Maturity Maturity Date : 2025-01-31 Maturity Price : 25.00 Evaluated at bid price : 17.81 Bid-YTW : 6.00 % |
| CU.PR.F | Perpetual-Discount | 58,055 | Nesbitt crossed blocks of 25,700 and 30,900, both at 23.50. YTW SCENARIO Maturity Type : Limit Maturity Maturity Date : 2045-02-03 Maturity Price : 23.17 Evaluated at bid price : 23.50 Bid-YTW : 4.77 % |
| BNS.PR.A | FloatingReset | 56,093 | Scotia crossed 42,500 at 23.85. YTW SCENARIO Maturity Type : Hard Maturity Maturity Date : 2022-01-31 Maturity Price : 25.00 Evaluated at bid price : 23.89 Bid-YTW : 3.24 % |
| There were 54 other index-included issues trading in excess of 10,000 shares. | |||
| Wide Spread Highlights | ||
| Issue | Index | Quote Data and Yield Notes |
| MFC.PR.J | FixedReset | Quote: 25.00 – 25.44 Spot Rate : 0.4400 Average : 0.2692 YTW SCENARIO |
| PWF.PR.T | FixedReset | Quote: 24.87 – 25.45 Spot Rate : 0.5800 Average : 0.4312 YTW SCENARIO |
| SLF.PR.G | FixedReset | Quote: 17.81 – 18.50 Spot Rate : 0.6900 Average : 0.5486 YTW SCENARIO |
| BNS.PR.Q | FixedReset | Quote: 25.31 – 25.68 Spot Rate : 0.3700 Average : 0.2606 YTW SCENARIO |
| MFC.PR.B | Deemed-Retractible | Quote: 24.29 – 24.70 Spot Rate : 0.4100 Average : 0.3007 YTW SCENARIO |
| BAM.PR.X | FixedReset | Quote: 17.96 – 18.35 Spot Rate : 0.3900 Average : 0.2832 YTW SCENARIO |