Month: November 2018

Issue Comments

ENB.PR.N To Reset At 5.086%

Enbridge Inc. has announced (on November 1):

that it does not intend to exercise its right to redeem its currently outstanding Cumulative Redeemable Preference Shares, Series N (Series N Shares) (TSX: ENB.PR.N) on December 1, 2018. As a result, subject to certain conditions, the holders of the Series N Shares have the right to convert all or part of their Series N Shares on a one-for-one basis into Cumulative Redeemable Preference Shares, Series O of Enbridge (Series O Shares) on December 1, 2018. Holders who do not exercise their right to convert their Series N Shares into Series O Shares will retain their Series N Shares.

The foregoing conversion right is subject to the conditions that: (i) if Enbridge determines that there would be less than 1,000,000 Series N Shares outstanding after December 1, 2018, then all remaining Series N Shares will automatically be converted into Series O Shares on a one-for-one basis on December 1, 2018; and (ii) alternatively, if Enbridge determines that there would be less than 1,000,000 Series O Shares outstanding after December 1, 2018, no Series N Shares will be converted into Series O Shares. There are currently 18,000,000 Series N Shares outstanding.

With respect to any Series N Shares that remain outstanding after December 1, 2018, holders thereof will be entitled to receive quarterly fixed cumulative preferential cash dividends, as and when declared by the Board of Directors of Enbridge. The new annual dividend rate applicable to the Series N Shares for the five-year period commencing on December 1, 2018 to, but excluding, December 1, 2023 will be 5.086 percent, being equal to the five-year Government of Canada bond yield of 2.436 percent determined as of today plus 2.65 percent in accordance with the terms of the Series N Shares.

With respect to any Series O Shares that may be issued on December 1, 2018, holders thereof will be entitled to receive quarterly floating rate cumulative preferential cash dividends, as and when declared by the Board of Directors of Enbridge. The dividend rate applicable to the Series O Shares for the three-month floating rate period commencing on December 1, 2018 to, but excluding, March 1, 2019 will be 1.08 percent, based on the annual rate on three month Government of Canada treasury bills for the most recent treasury bills auction of 1.73 percent plus 2.65 percent in accordance with the terms of the Series O Shares (the Floating Quarterly Dividend Rate). The Floating Quarterly Dividend Rate will be reset every quarter.

Beneficial holders of Series N Shares who wish to exercise their right of conversion during the conversion period, which runs from November 1, 2018 until 5:00 p.m. (EST) on November 16, 2018, should communicate as soon as possible with their broker or other intermediary for more information. It is recommended that this be done well in advance of the deadline in order to provide the broker or other intermediary time to complete the necessary steps. Any notices received after this deadline will not be valid.

ENB.PR.N is a FixedReset, 4.00%+265, that commenced trading 2012-7-17 after being announced 2012-7-9. It is tracked by HIMIPref™ and assigned to the “Scraps – FixedResets (Discount)” subindex, relegated there due to credit concerns.

The most logical way to analyze the question of whether or not to convert is through the theory of Preferred Pairs, for which a calculator is available. Briefly, a Strong Pair is defined as a pair of securities that can be interconverted in the future (e.g., ENB.PR.N and the FloatingReset that will exist if enough holders convert). Since they will be interconvertible on this future date, it may be assumed that they will be priced identically on this date (if they aren’t then holders will simply convert en masse to the higher-priced issue). And since they will be priced identically on a given date in the future, any current difference in price must be offset by expectations of an equal and opposite value of dividends to be received in the interim. And since the dividend rate on one element of the pair is both fixed and known, the implied average rate of the other, floating rate, instrument can be determined. Finally, we say, we may compare these average rates and take a view regarding the actual future course of that rate relative to the implied rate, which will provide us with guidance on which element of the pair is likely to outperform the other until the next interconversion date, at which time the process will be repeated.

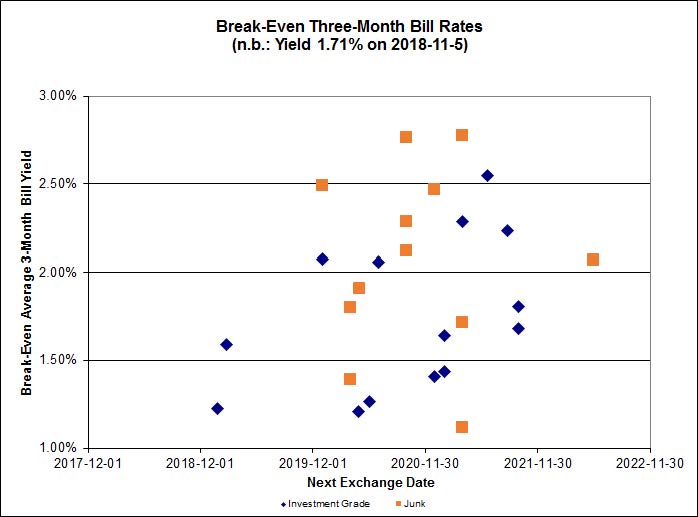
We can show the break-even rates for each FixedReset / FloatingReset Strong Pair graphically by plotting the implied average 3-month bill rate against the next Exchange Date (which is the date to which the average will be calculated).

pairs_fr_181105
Click for Big

The market appears to be becoming interested in floating rate product; the implied rates until the next interconversion are above the current 3-month bill rate as the averages for investment-grade and junk issues are at +1.96% and +1.78%, respectively. Whatever might be the result of the next few Bank of Canada overnight rate decisions, I suggest that it is unlikely that the average rate over the next five years will be lower than current – but if you disagree, of course, you may interpret the data any way you like.

Since credit quality of each element of the pair is equal to the other element, it should not make any difference whether the pair examined is investment-grade or junk, although we might expect greater variation of implied rates between junk issues on grounds of lower liquidity, and this is just what we see.

If we plug in the current bid price of the ENB.PR.N FixedReset, we may construct the following table showing consistent prices for its soon-may-be-issued FloatingReset counterpart given a variety of Implied Breakeven yields consistent with issues currently trading:

Estimate of FloatingReset (received in exchange for ENB.PR.N) Trading Price In Current Conditions
  Assumed FloatingReset
Price if Implied Bill
is equal to
FixedReset Bid Price Spread 2.50% 2.00% 1.50%
ENB.PR.N 19.75 265bp 19.81 19.33 18.85

Based on current market conditions, I suggest that the FloatingResets that will result from conversion are likely to be cheap and trading below the price of their FixedReset counterparts, ENB.PR.N. Therefore, it seems likely that I will recommend that holders of ENB.PR.N continue to hold the issue and not to convert, but I will wait until it’s closer to the November 16 notification deadline before making a final pronouncement. I will note that once the FloatingResets commence trading (if, in fact, they do) it may be a good trade to swap the FixedReset for the FloatingReset in the market once both elements of each pair are trading and you can – presumably, according to this analysis – do it with a reasonably good take-out in price, rather than doing it through the company on a 1:1 basis. But that, of course, will depend on the prices at that time and your forecast for the path of policy rates over the next five years. There are no guarantees – my recommendation is based on the assumption that current market conditions with respect to the pairs will continue until the FloatingResets commence trading and that the relative pricing of the two new pairs will reflect these conditions.

Market Action

November 5, 2018

HIMIPref™ Preferred Indices
These values reflect the December 2008 revision of the HIMIPref™ Indices

Values are provisional and are finalized monthly
Index Mean
Current
Yield
(at bid)
Median
YTW
Median
Average
Trading
Value
Median
Mod Dur
(YTW)
Issues Day’s Perf. Index Value
Ratchet 0.00 % 0.00 % 0 0.00 0 1.4256 % 3,109.2
FixedFloater 0.00 % 0.00 % 0 0.00 0 1.4256 % 5,705.2
Floater 3.74 % 3.96 % 40,568 17.47 4 1.4256 % 3,287.9
OpRet 0.00 % 0.00 % 0 0.00 0 0.2798 % 3,210.7
SplitShare 4.63 % 4.90 % 53,935 4.66 5 0.2798 % 3,834.3
Interest-Bearing 0.00 % 0.00 % 0 0.00 0 0.2798 % 2,991.7
Perpetual-Premium 5.69 % 5.67 % 67,989 14.17 12 0.4060 % 2,880.5
Perpetual-Discount 5.66 % 5.76 % 75,466 14.24 21 0.2370 % 2,901.0
FixedReset Disc 4.39 % 5.38 % 161,609 15.08 46 -0.0608 % 2,489.9
Deemed-Retractible 5.34 % 6.70 % 69,869 5.19 27 0.4853 % 2,903.6
FloatingReset 3.79 % 3.90 % 46,659 5.45 4 0.5368 % 2,789.0
FixedReset Prem 4.94 % 4.57 % 250,630 3.05 34 0.2091 % 2,541.4
FixedReset Bank Non 2.97 % 3.91 % 114,225 0.30 6 0.0962 % 2,573.5
FixedReset Ins Non 4.51 % 6.27 % 127,649 5.30 22 0.2972 % 2,488.8
Performance Highlights
Issue Index Change Notes
TD.PF.A FixedReset Disc -5.25 % A nonsensical quote provided at high cost from Nonsense Central, as the issue traded 8,600 shares today in a range of 22.35-67 before being quoted at 21.29-22.26.

I have not checked whether the lamentable state of the quote is due to inadequate Toronto Stock Exchange reporting or inadequate Toronto Stock Exchange supervision of market-makers.

YTW SCENARIO
Maturity Type : Limit Maturity
Maturity Date : 2048-11-05
Maturity Price : 21.29
Evaluated at bid price : 21.29
Bid-YTW : 5.49 %

BAM.PR.M Perpetual-Discount -3.24 % YTW SCENARIO
Maturity Type : Limit Maturity
Maturity Date : 2048-11-05
Maturity Price : 19.12
Evaluated at bid price : 19.12
Bid-YTW : 6.31 %
HSE.PR.A FixedReset Disc -2.99 % YTW SCENARIO
Maturity Type : Limit Maturity
Maturity Date : 2048-11-05
Maturity Price : 16.22
Evaluated at bid price : 16.22
Bid-YTW : 6.06 %
MFC.PR.G FixedReset Ins Non -2.95 % YTW SCENARIO
Maturity Type : Hard Maturity
Maturity Date : 2025-01-31
Maturity Price : 25.00
Evaluated at bid price : 23.00
Bid-YTW : 6.28 %
RY.PR.H FixedReset Disc -1.99 % YTW SCENARIO
Maturity Type : Limit Maturity
Maturity Date : 2048-11-05
Maturity Price : 21.75
Evaluated at bid price : 22.20
Bid-YTW : 5.25 %
TRP.PR.D FixedReset Disc -1.89 % YTW SCENARIO
Maturity Type : Limit Maturity
Maturity Date : 2048-11-05
Maturity Price : 21.25
Evaluated at bid price : 21.25
Bid-YTW : 5.70 %
BAM.PF.F FixedReset Disc -1.69 % YTW SCENARIO
Maturity Type : Limit Maturity
Maturity Date : 2048-11-05
Maturity Price : 22.64
Evaluated at bid price : 23.20
Bid-YTW : 5.71 %
BIP.PR.E FixedReset Disc -1.64 % YTW SCENARIO
Maturity Type : Limit Maturity
Maturity Date : 2048-11-05
Maturity Price : 22.54
Evaluated at bid price : 23.41
Bid-YTW : 5.71 %
CM.PR.Q FixedReset Disc -1.39 % YTW SCENARIO
Maturity Type : Limit Maturity
Maturity Date : 2048-11-05
Maturity Price : 23.04
Evaluated at bid price : 23.42
Bid-YTW : 5.41 %
BIP.PR.A FixedReset Disc -1.37 % YTW SCENARIO
Maturity Type : Limit Maturity
Maturity Date : 2048-11-05
Maturity Price : 22.62
Evaluated at bid price : 23.00
Bid-YTW : 6.43 %
IAG.PR.I FixedReset Ins Non 1.05 % YTW SCENARIO
Maturity Type : Hard Maturity
Maturity Date : 2025-01-31
Maturity Price : 25.00
Evaluated at bid price : 24.00
Bid-YTW : 5.80 %
TRP.PR.C FixedReset Disc 1.06 % YTW SCENARIO
Maturity Type : Limit Maturity
Maturity Date : 2048-11-05
Maturity Price : 17.20
Evaluated at bid price : 17.20
Bid-YTW : 5.51 %
MFC.PR.C Deemed-Retractible 1.07 % YTW SCENARIO
Maturity Type : Hard Maturity
Maturity Date : 2025-01-31
Maturity Price : 25.00
Evaluated at bid price : 19.78
Bid-YTW : 9.14 %
MFC.PR.B Deemed-Retractible 1.08 % YTW SCENARIO
Maturity Type : Hard Maturity
Maturity Date : 2025-01-31
Maturity Price : 25.00
Evaluated at bid price : 20.55
Bid-YTW : 8.57 %
IAG.PR.G FixedReset Ins Non 1.15 % YTW SCENARIO
Maturity Type : Hard Maturity
Maturity Date : 2025-01-31
Maturity Price : 25.00
Evaluated at bid price : 22.85
Bid-YTW : 6.16 %
PWF.PR.K Perpetual-Discount 1.18 % YTW SCENARIO
Maturity Type : Limit Maturity
Maturity Date : 2048-11-05
Maturity Price : 21.45
Evaluated at bid price : 21.45
Bid-YTW : 5.82 %
BMO.PR.W FixedReset Disc 1.18 % YTW SCENARIO
Maturity Type : Limit Maturity
Maturity Date : 2048-11-05
Maturity Price : 21.79
Evaluated at bid price : 22.26
Bid-YTW : 5.17 %
GWO.PR.I Deemed-Retractible 1.20 % YTW SCENARIO
Maturity Type : Hard Maturity
Maturity Date : 2025-01-31
Maturity Price : 25.00
Evaluated at bid price : 20.19
Bid-YTW : 8.70 %
PWF.PR.A Floater 1.28 % YTW SCENARIO
Maturity Type : Limit Maturity
Maturity Date : 2048-11-05
Maturity Price : 21.32
Evaluated at bid price : 21.32
Bid-YTW : 3.24 %
W.PR.H Perpetual-Discount 1.29 % YTW SCENARIO
Maturity Type : Limit Maturity
Maturity Date : 2048-11-05
Maturity Price : 24.02
Evaluated at bid price : 24.27
Bid-YTW : 5.71 %
HSE.PR.C FixedReset Disc 1.30 % YTW SCENARIO
Maturity Type : Limit Maturity
Maturity Date : 2048-11-05
Maturity Price : 22.89
Evaluated at bid price : 23.40
Bid-YTW : 5.91 %
EML.PR.A FixedReset Ins Non 1.33 % YTW SCENARIO
Maturity Type : Call
Maturity Date : 2021-04-17
Maturity Price : 25.00
Evaluated at bid price : 25.94
Bid-YTW : 4.27 %
BAM.PR.K Floater 1.33 % YTW SCENARIO
Maturity Type : Limit Maturity
Maturity Date : 2048-11-05
Maturity Price : 17.53
Evaluated at bid price : 17.53
Bid-YTW : 3.98 %
SLF.PR.A Deemed-Retractible 1.42 % YTW SCENARIO
Maturity Type : Hard Maturity
Maturity Date : 2025-01-31
Maturity Price : 25.00
Evaluated at bid price : 21.40
Bid-YTW : 7.86 %
BAM.PR.C Floater 1.45 % YTW SCENARIO
Maturity Type : Limit Maturity
Maturity Date : 2048-11-05
Maturity Price : 17.55
Evaluated at bid price : 17.55
Bid-YTW : 3.97 %
GWO.PR.S Deemed-Retractible 1.51 % YTW SCENARIO
Maturity Type : Hard Maturity
Maturity Date : 2025-01-31
Maturity Price : 25.00
Evaluated at bid price : 23.55
Bid-YTW : 6.54 %
BAM.PR.B Floater 1.68 % YTW SCENARIO
Maturity Type : Limit Maturity
Maturity Date : 2048-11-05
Maturity Price : 17.59
Evaluated at bid price : 17.59
Bid-YTW : 3.96 %
TRP.PR.B FixedReset Disc 1.76 % YTW SCENARIO
Maturity Type : Limit Maturity
Maturity Date : 2048-11-05
Maturity Price : 16.75
Evaluated at bid price : 16.75
Bid-YTW : 5.40 %
BAM.PF.B FixedReset Disc 1.82 % YTW SCENARIO
Maturity Type : Limit Maturity
Maturity Date : 2048-11-05
Maturity Price : 22.20
Evaluated at bid price : 22.90
Bid-YTW : 5.54 %
BAM.PF.E FixedReset Disc 1.88 % YTW SCENARIO
Maturity Type : Limit Maturity
Maturity Date : 2048-11-05
Maturity Price : 22.39
Evaluated at bid price : 22.80
Bid-YTW : 5.46 %
PWF.PR.Q FloatingReset 1.90 % YTW SCENARIO
Maturity Type : Limit Maturity
Maturity Date : 2048-11-05
Maturity Price : 21.45
Evaluated at bid price : 21.45
Bid-YTW : 3.88 %
BIP.PR.F FixedReset Prem 2.20 % YTW SCENARIO
Maturity Type : Limit Maturity
Maturity Date : 2048-11-05
Maturity Price : 23.02
Evaluated at bid price : 24.63
Bid-YTW : 5.36 %
BAM.PR.R FixedReset Disc 2.29 % YTW SCENARIO
Maturity Type : Limit Maturity
Maturity Date : 2048-11-05
Maturity Price : 20.07
Evaluated at bid price : 20.07
Bid-YTW : 5.64 %
IFC.PR.G FixedReset Ins Non 3.49 % YTW SCENARIO
Maturity Type : Hard Maturity
Maturity Date : 2025-01-31
Maturity Price : 25.00
Evaluated at bid price : 24.00
Bid-YTW : 5.83 %
Volume Highlights
Issue Index Shares
Traded
Notes
RY.PR.S FixedReset Disc 209,287 YTW SCENARIO
Maturity Type : Limit Maturity
Maturity Date : 2048-11-05
Maturity Price : 23.03
Evaluated at bid price : 24.69
Bid-YTW : 4.80 %
RY.PR.M FixedReset Disc 108,400 YTW SCENARIO
Maturity Type : Limit Maturity
Maturity Date : 2048-11-05
Maturity Price : 22.91
Evaluated at bid price : 23.24
Bid-YTW : 5.26 %
TD.PF.H FixedReset Prem 71,736 YTW SCENARIO
Maturity Type : Call
Maturity Date : 2021-10-31
Maturity Price : 25.00
Evaluated at bid price : 25.65
Bid-YTW : 3.96 %
MFC.PR.O FixedReset Ins Non 56,225 YTW SCENARIO
Maturity Type : Call
Maturity Date : 2021-06-19
Maturity Price : 25.00
Evaluated at bid price : 25.95
Bid-YTW : 4.38 %
RY.PR.Z FixedReset Disc 30,670 YTW SCENARIO
Maturity Type : Limit Maturity
Maturity Date : 2048-11-05
Maturity Price : 21.91
Evaluated at bid price : 22.43
Bid-YTW : 5.15 %
RY.PR.H FixedReset Disc 30,070 YTW SCENARIO
Maturity Type : Limit Maturity
Maturity Date : 2048-11-05
Maturity Price : 21.75
Evaluated at bid price : 22.20
Bid-YTW : 5.25 %
There were 18 other index-included issues trading in excess of 10,000 shares.
Wide Spread Highlights
Issue Index Quote Data and Yield Notes
TD.PF.A FixedReset Disc Quote: 21.29 – 22.66
Spot Rate : 1.3700
Average : 0.7828

YTW SCENARIO
Maturity Type : Limit Maturity
Maturity Date : 2048-11-05
Maturity Price : 21.29
Evaluated at bid price : 21.29
Bid-YTW : 5.49 %

BAM.PR.M Perpetual-Discount Quote: 19.12 – 20.40
Spot Rate : 1.2800
Average : 0.8469

YTW SCENARIO
Maturity Type : Limit Maturity
Maturity Date : 2048-11-05
Maturity Price : 19.12
Evaluated at bid price : 19.12
Bid-YTW : 6.31 %

SLF.PR.A Deemed-Retractible Quote: 21.40 – 22.25
Spot Rate : 0.8500
Average : 0.5056

YTW SCENARIO
Maturity Type : Hard Maturity
Maturity Date : 2025-01-31
Maturity Price : 25.00
Evaluated at bid price : 21.40
Bid-YTW : 7.86 %

MFC.PR.G FixedReset Ins Non Quote: 23.00 – 23.84
Spot Rate : 0.8400
Average : 0.5231

YTW SCENARIO
Maturity Type : Hard Maturity
Maturity Date : 2025-01-31
Maturity Price : 25.00
Evaluated at bid price : 23.00
Bid-YTW : 6.28 %

BAM.PF.G FixedReset Disc Quote: 23.35 – 24.10
Spot Rate : 0.7500
Average : 0.5186

YTW SCENARIO
Maturity Type : Limit Maturity
Maturity Date : 2048-11-05
Maturity Price : 22.95
Evaluated at bid price : 23.35
Bid-YTW : 5.62 %

TRP.PR.D FixedReset Disc Quote: 21.25 – 22.19
Spot Rate : 0.9400
Average : 0.7099

YTW SCENARIO
Maturity Type : Limit Maturity
Maturity Date : 2048-11-05
Maturity Price : 21.25
Evaluated at bid price : 21.25
Bid-YTW : 5.70 %

Issue Comments

RY.PR.S Surprisingly Strong on Modest Volume

Royal Bank of Canada has announced (on November 2):

it has closed its domestic public offering of Non-Cumulative, 5-Year Rate Reset Preferred Shares Series BO. Royal Bank of Canada issued 14 million Preferred Shares Series BO at a price of $25.00 per share to raise gross proceeds of $350 million.

The offering was underwritten by a syndicate led by RBC Capital Markets. The Preferred Shares Series BO will commence trading on the Toronto Stock Exchange today under the ticker symbol RY.PR.S.

The Preferred Shares Series BO were issued under a prospectus supplement dated October 29, 2018 to the bank’s short form base shelf prospectus dated January 30, 2018.

RY.PR.S is a FixedReset, 4.80+238, announced 2018-10-25. It will be tracked by HIMIPref™ and has been assigned to the Fixed-Resets (Discount) subindex.

RY.PR.S traded 747,100 shares on its November 2 opening date in a range of 24.50-75 before closing at 24.70-75. Vital statistics (on November 2) were:

RY.PR.S FixedReset Disc YTW SCENARIO
Maturity Type : Limit Maturity
Maturity Date : 2048-11-02
Maturity Price : 23.04
Evaluated at bid price : 24.70
Bid-YTW : 4.74 %

Given that the FixedReset (Discount) index to which it is assigned lost 2.51% between the October 25 announcement date and the November 2 closing date, the 24.70 bid is actually pretty good!

The new issue is so ridiculously expensive that we don’t even need fancy-pants Implied Volatility Analysis to prove it, but here’s the chart anyway:

impvol_ry_181105
Click for Big

According to this analysis, the fair value of the new issue on November 5 is 22.61, down $1.16 from the October 26 estimate of 23.77.

But, as I say, we don’t need this – even though the issue is, amusingly, trading more in line with NVCC non-compliant issues than the compliant ones. Let’s look at RY.PR.H, a FixedReset, 3.90%+226, that commenced trading 2014-6-3 after being announced 2014-5-23. This issue resets 2019-8-24, which is only three dividends away. The total dividend difference between RY.PR.H and RY.PR.S until then is therefore (4.80% – 3.90%) * 25 * 3/4 = $0.17. So for a reasonable comparison, take the actual November 5 bid of 22.20 for RY.PR.H and add seventeen cents to it to reflect the dividend difference. RY.PR.H has a projected dividend of (GOC5 + IRS) * 25 = (2.44% + 2.26%) * 25 = 4.70% * 25 = 1.175 p.a., which, at a notional price of 22.37, gives us an Expected Future Current Yield of 5.25%.

At the current bid of 24.69 and an expected future dividend of 1.205, RY.PR.S has an Expected Future Current Yield of 4.88%. Need I say more?

The ludicrously high figure of Implied Volatility is something I take to mean that the underlying assumption of the Black-Scholes model, that of no directionality of prices, is not accepted by the market; the market seems to be taking the view that since things seem rosy now, they will always be rosy and everything will trade near par in the future.

I balk at ascribing a 100% probability to the ‘all issues will be called, or at least exhibit price stability’ hypothesis. There may still be a few old geezers amongst the Assiduous Readers of this blog who can still (faintly) remember the Great Bear Market of 2014-16, in which quite a few similar assumptions made earlier turned out to be slightly inaccurate. The extra cushion implied by an Issue Reset Spread that is well over the market spread is worth something, even if nothing gets called. Or, to put it another way, one can buy a whole lot of downside protection for very little extra money, relative to this issue.

Regulatory Capital

Comment Period Expires for IAIS Public Consultation on ICS 2.0

Readers will remember that I am very interested in the IAIS deliberations regarding the definition of Insurance company Tier 1 Limited Capital (which includes preferred shares); I take the view that rules comparable, if not identical to the bank NVCC rules will be imposed by OSFI at some point in the future.

I do not expect OSFI to act until a global standard is agreed upon.

Those who have followed my arguments to support my position may well be getting impatient, although not as impatient as I am. So, I’ll just pass along the news that the comment period for the IAIS Public Consultation: Risk-based Global Insurance Capital Standard (ICS) Version 2.0 has expired:

The purpose of this consultation document (CD) is to solicit feedback from stakeholders on the ICS ahead of the completion of ICS Version 2.0, scheduled for late-2019, before the monitoring period begins on 1 January 2020. This CD covers both issues related to the ICS Version 2.0 monitoring period and the technical aspects of the design and calibration of ICS Version 2.0.

This CD is the third IAIS consultation in a multi-year process to develop the ICS. The IAIS issued its first and second ICS consultation documents in December 2014 and July 2016, respectively. In addition, the IAIS has conducted three quantitative Field Testing exercises in the development of the ICS – in 2015, 2016 and 2017. Currently, the IAIS is conducting its fourth quantitative ICS Field Testing exercise, with data to be submitted in August 2018.

At the same time as this consultation on ICS Version 2.0, the IAIS is also consulting on the Common Framework for the Supervision of IAIGs (ComFrame). While ICS is part of the ComFrame, it was agreed by the Executive Committee of the IAIS in June 2017 that ICS Version 2.0 would be adopted as a stand-alone document in 2019. As such, there are two separate consultation documents.

The consultation document, downloadable from the above page, contains the critical (for our purposes) question:

173. The IAIS is considering whether to set an additional criterion requiring Tier 1 Limited instruments to have a principal loss absorbency mechanism (PLAM). Such mechanisms would provide a means for financial instruments to absorb losses on a going-concern basis through reductions in the principal amount and cancellation of distributions. Without such mechanisms these instruments might only provide going concern loss absorbency through cancellation of distributions.

deemedretractiblequestion_181103
Click for Big

I will also note that:

7. Comments must be sent electronically via the IAIS Consultations webpage.1 All comments will be published on the IAIS website unless a specific request is made for comments to remain confidential.

I will be keeping a sharp eye out for publication of comments received, I assure you, and will pass them on.

Market Action

November 2, 2018

The Canadian jobs report was ho-hum:

The Canadian economy added 11,200 jobs in October on higher full-time hiring, and the unemployment rate dipped to 5.8 per cent, although wage growth was sluggish, Statistics Canada data indicated on Friday.

Although full-time jobs rose by 33,900 compared to a loss of 22,600 part-time positions, the labour participation rate dropped to 65.2 per cent, its lowest since October, 1998.

And the average year-over-year wage growth of permanent employees – a figure closely watched by the Bank of Canada – fell to just 1.9 per cent, the lowest since the 1.7 per cent recorded in August 2017.

Meanwhile, in the States:

  • ■ 250,000 jobs were added last month.
  • ■ The unemployment rate was unchanged at 3.7 percent, a nearly 50-year low.
  • ■ Average earnings rose by 0.2 percent and are up 3.1 percent over the past year.
  • ■ The number of people working or looking for a job increased by 711,000, nudging the labor force participation rate up to 62.9 percent, from 62.7 percent in September.

But so much for the rally!

A steep decline in shares of Apple Inc. further weighed on sentiment in the U.S. stock market after the iPhone maker warned that sales during the crucial holiday quarter would likely miss expectations.

White House economic adviser Larry Kudlow told CNBC that while President Donald Trump plans to meet China President Xi Jinping later this month, he has not asked U.S. officials to draw up a proposed trade plan, contradicting a report earlier in the day that had buoyed hopes of a trade dispute resolution.

That erased early gains in U.S. stocks and curtailed a rally in global markets that had lifted emerging market stocks by their largest daily gain since 2016.

The Dow Jones Industrial Average fell 111.34 points, or 0.44 per cent, to 25,269.4, the S&P 500 lost 17.6 points, or 0.64 per cent, to 2,722.77 and the Nasdaq Composite dropped 77.06 points, or 1.04 per cent, to 7,356.99.

Apple’s shares tumbled nearly 7 per cent, taking its market value below $1-trillion, after the company said sales for the final quarter would likely miss expectations.

In Toronto, Canada’s main stock index also erased early gains on Friday.

The Toronto Stock Exchange’s S&P/TSX composite index unofficially closed down 0.2 per cent, or 30.87 points, at 15,119.28.

HIMIPref™ Preferred Indices
These values reflect the December 2008 revision of the HIMIPref™ Indices

Values are provisional and are finalized monthly
Index Mean
Current
Yield
(at bid)
Median
YTW
Median
Average
Trading
Value
Median
Mod Dur
(YTW)
Issues Day’s Perf. Index Value
Ratchet 0.00 % 0.00 % 0 0.00 0 -0.0274 % 3,065.5
FixedFloater 0.00 % 0.00 % 0 0.00 0 -0.0274 % 5,625.0
Floater 3.79 % 4.03 % 41,189 17.34 4 -0.0274 % 3,241.7
OpRet 0.00 % 0.00 % 0 0.00 0 -0.0959 % 3,201.8
SplitShare 4.65 % 4.97 % 54,750 4.67 5 -0.0959 % 3,823.6
Interest-Bearing 0.00 % 0.00 % 0 0.00 0 -0.0959 % 2,983.3
Perpetual-Premium 5.72 % 5.78 % 70,779 14.15 12 -0.1891 % 2,868.8
Perpetual-Discount 5.67 % 5.78 % 75,499 14.20 21 -0.3435 % 2,894.2
FixedReset Disc 4.37 % 5.29 % 163,191 15.21 45 -0.9971 % 2,492.2
Deemed-Retractible 5.37 % 6.82 % 70,985 5.20 27 -0.1464 % 2,889.5
FloatingReset 3.82 % 3.96 % 47,276 5.45 4 -0.1310 % 2,774.1
FixedReset Prem 4.95 % 4.51 % 243,451 3.06 34 -0.3434 % 2,536.1
FixedReset Bank Non 2.97 % 3.77 % 115,898 0.31 6 -0.2469 % 2,571.0
FixedReset Ins Non 4.51 % 6.26 % 128,806 5.31 22 -0.9096 % 2,481.4
Performance Highlights
Issue Index Change Notes
IFC.PR.G FixedReset Ins Non -3.98 % YTW SCENARIO
Maturity Type : Hard Maturity
Maturity Date : 2025-01-31
Maturity Price : 25.00
Evaluated at bid price : 23.19
Bid-YTW : 6.46 %
BAM.PR.R FixedReset Disc -3.87 % YTW SCENARIO
Maturity Type : Limit Maturity
Maturity Date : 2048-11-02
Maturity Price : 19.62
Evaluated at bid price : 19.62
Bid-YTW : 5.67 %
BAM.PF.E FixedReset Disc -3.33 % YTW SCENARIO
Maturity Type : Limit Maturity
Maturity Date : 2048-11-02
Maturity Price : 21.86
Evaluated at bid price : 22.38
Bid-YTW : 5.47 %
BAM.PR.T FixedReset Disc -3.08 % YTW SCENARIO
Maturity Type : Limit Maturity
Maturity Date : 2048-11-02
Maturity Price : 19.82
Evaluated at bid price : 19.82
Bid-YTW : 5.63 %
IFC.PR.A FixedReset Ins Non -2.67 % YTW SCENARIO
Maturity Type : Hard Maturity
Maturity Date : 2025-01-31
Maturity Price : 25.00
Evaluated at bid price : 19.65
Bid-YTW : 8.11 %
BAM.PF.B FixedReset Disc -2.64 % YTW SCENARIO
Maturity Type : Limit Maturity
Maturity Date : 2048-11-02
Maturity Price : 21.95
Evaluated at bid price : 22.49
Bid-YTW : 5.56 %
HSE.PR.C FixedReset Disc -2.04 % YTW SCENARIO
Maturity Type : Limit Maturity
Maturity Date : 2048-11-02
Maturity Price : 22.61
Evaluated at bid price : 23.10
Bid-YTW : 5.90 %
BAM.PR.M Perpetual-Discount -1.94 % YTW SCENARIO
Maturity Type : Limit Maturity
Maturity Date : 2048-11-02
Maturity Price : 19.76
Evaluated at bid price : 19.76
Bid-YTW : 6.09 %
BAM.PR.X FixedReset Disc -1.83 % YTW SCENARIO
Maturity Type : Limit Maturity
Maturity Date : 2048-11-02
Maturity Price : 17.67
Evaluated at bid price : 17.67
Bid-YTW : 5.52 %
BIP.PR.F FixedReset Prem -1.83 % YTW SCENARIO
Maturity Type : Limit Maturity
Maturity Date : 2048-11-02
Maturity Price : 22.81
Evaluated at bid price : 24.10
Bid-YTW : 5.44 %
BMO.PR.W FixedReset Disc -1.74 % YTW SCENARIO
Maturity Type : Limit Maturity
Maturity Date : 2048-11-02
Maturity Price : 21.61
Evaluated at bid price : 22.00
Bid-YTW : 5.15 %
RY.PR.M FixedReset Disc -1.74 % YTW SCENARIO
Maturity Type : Limit Maturity
Maturity Date : 2048-11-02
Maturity Price : 22.88
Evaluated at bid price : 23.21
Bid-YTW : 5.19 %
SLF.PR.H FixedReset Ins Non -1.67 % YTW SCENARIO
Maturity Type : Hard Maturity
Maturity Date : 2025-01-31
Maturity Price : 25.00
Evaluated at bid price : 20.65
Bid-YTW : 7.30 %
RY.PR.J FixedReset Disc -1.62 % YTW SCENARIO
Maturity Type : Limit Maturity
Maturity Date : 2048-11-02
Maturity Price : 23.30
Evaluated at bid price : 23.71
Bid-YTW : 5.24 %
NA.PR.W FixedReset Disc -1.60 % YTW SCENARIO
Maturity Type : Limit Maturity
Maturity Date : 2048-11-02
Maturity Price : 21.28
Evaluated at bid price : 21.55
Bid-YTW : 5.30 %
RY.PR.Z FixedReset Disc -1.49 % YTW SCENARIO
Maturity Type : Limit Maturity
Maturity Date : 2048-11-02
Maturity Price : 21.99
Evaluated at bid price : 22.55
Bid-YTW : 5.03 %
BMO.PR.T FixedReset Disc -1.47 % YTW SCENARIO
Maturity Type : Limit Maturity
Maturity Date : 2048-11-02
Maturity Price : 21.70
Evaluated at bid price : 22.12
Bid-YTW : 5.16 %
BMO.PR.Q FixedReset Bank Non -1.47 % YTW SCENARIO
Maturity Type : Hard Maturity
Maturity Date : 2022-01-31
Maturity Price : 25.00
Evaluated at bid price : 22.85
Bid-YTW : 4.92 %
MFC.PR.I FixedReset Ins Non -1.46 % YTW SCENARIO
Maturity Type : Hard Maturity
Maturity Date : 2025-01-31
Maturity Price : 25.00
Evaluated at bid price : 23.61
Bid-YTW : 5.88 %
BMO.PR.S FixedReset Disc -1.44 % YTW SCENARIO
Maturity Type : Limit Maturity
Maturity Date : 2048-11-02
Maturity Price : 21.97
Evaluated at bid price : 22.52
Bid-YTW : 5.17 %
W.PR.H Perpetual-Discount -1.40 % YTW SCENARIO
Maturity Type : Limit Maturity
Maturity Date : 2048-11-02
Maturity Price : 23.69
Evaluated at bid price : 23.96
Bid-YTW : 5.78 %
TD.PF.B FixedReset Disc -1.39 % YTW SCENARIO
Maturity Type : Limit Maturity
Maturity Date : 2048-11-02
Maturity Price : 22.03
Evaluated at bid price : 22.63
Bid-YTW : 5.08 %
SLF.PR.G FixedReset Ins Non -1.32 % YTW SCENARIO
Maturity Type : Hard Maturity
Maturity Date : 2025-01-31
Maturity Price : 25.00
Evaluated at bid price : 18.75
Bid-YTW : 8.69 %
BAM.PF.G FixedReset Disc -1.26 % YTW SCENARIO
Maturity Type : Limit Maturity
Maturity Date : 2048-11-02
Maturity Price : 23.17
Evaluated at bid price : 23.57
Bid-YTW : 5.49 %
TD.PF.E FixedReset Disc -1.19 % YTW SCENARIO
Maturity Type : Limit Maturity
Maturity Date : 2048-11-02
Maturity Price : 23.66
Evaluated at bid price : 23.98
Bid-YTW : 5.29 %
PWF.PR.K Perpetual-Discount -1.17 % YTW SCENARIO
Maturity Type : Limit Maturity
Maturity Date : 2048-11-02
Maturity Price : 21.20
Evaluated at bid price : 21.20
Bid-YTW : 5.88 %
TD.PF.A FixedReset Disc -1.10 % YTW SCENARIO
Maturity Type : Limit Maturity
Maturity Date : 2048-11-02
Maturity Price : 21.92
Evaluated at bid price : 22.47
Bid-YTW : 5.08 %
HSE.PR.G FixedReset Prem -1.07 % YTW SCENARIO
Maturity Type : Limit Maturity
Maturity Date : 2048-11-02
Maturity Price : 23.62
Evaluated at bid price : 24.00
Bid-YTW : 6.05 %
HSE.PR.E FixedReset Prem -1.07 % YTW SCENARIO
Maturity Type : Limit Maturity
Maturity Date : 2048-11-02
Maturity Price : 23.68
Evaluated at bid price : 24.10
Bid-YTW : 6.06 %
EMA.PR.F FixedReset Disc -1.06 % YTW SCENARIO
Maturity Type : Limit Maturity
Maturity Date : 2048-11-02
Maturity Price : 22.78
Evaluated at bid price : 23.25
Bid-YTW : 5.30 %
CM.PR.S FixedReset Disc -1.05 % YTW SCENARIO
Maturity Type : Limit Maturity
Maturity Date : 2048-11-02
Maturity Price : 22.64
Evaluated at bid price : 23.60
Bid-YTW : 4.99 %
BAM.PF.A FixedReset Disc -1.04 % YTW SCENARIO
Maturity Type : Limit Maturity
Maturity Date : 2048-11-02
Maturity Price : 22.72
Evaluated at bid price : 23.85
Bid-YTW : 5.46 %
IAG.PR.G FixedReset Ins Non -1.01 % YTW SCENARIO
Maturity Type : Hard Maturity
Maturity Date : 2025-01-31
Maturity Price : 25.00
Evaluated at bid price : 22.59
Bid-YTW : 6.34 %
SLF.PR.B Deemed-Retractible 1.04 % YTW SCENARIO
Maturity Type : Hard Maturity
Maturity Date : 2025-01-31
Maturity Price : 25.00
Evaluated at bid price : 21.44
Bid-YTW : 7.86 %
Volume Highlights
Issue Index Shares
Traded
Notes
TD.PF.H FixedReset Prem 84,475 YTW SCENARIO
Maturity Type : Call
Maturity Date : 2021-10-31
Maturity Price : 25.00
Evaluated at bid price : 25.56
Bid-YTW : 4.08 %
BNS.PR.H FixedReset Prem 74,039 YTW SCENARIO
Maturity Type : Call
Maturity Date : 2022-01-26
Maturity Price : 25.00
Evaluated at bid price : 25.65
Bid-YTW : 4.03 %
BMO.PR.D FixedReset Prem 48,500 YTW SCENARIO
Maturity Type : Call
Maturity Date : 2022-08-25
Maturity Price : 25.00
Evaluated at bid price : 24.90
Bid-YTW : 4.46 %
BNS.PR.I FixedReset Disc 25,950 YTW SCENARIO
Maturity Type : Limit Maturity
Maturity Date : 2048-11-02
Maturity Price : 23.13
Evaluated at bid price : 24.95
Bid-YTW : 4.76 %
NA.PR.C FixedReset Prem 23,450 YTW SCENARIO
Maturity Type : Call
Maturity Date : 2022-11-15
Maturity Price : 25.00
Evaluated at bid price : 24.74
Bid-YTW : 4.72 %
IFC.PR.A FixedReset Ins Non 20,600 YTW SCENARIO
Maturity Type : Hard Maturity
Maturity Date : 2025-01-31
Maturity Price : 25.00
Evaluated at bid price : 19.65
Bid-YTW : 8.11 %
There were 29 other index-included issues trading in excess of 10,000 shares.
Wide Spread Highlights
Issue Index Quote Data and Yield Notes
HSE.PR.C FixedReset Disc Quote: 23.10 – 24.95
Spot Rate : 1.8500
Average : 1.2314

YTW SCENARIO
Maturity Type : Limit Maturity
Maturity Date : 2048-11-02
Maturity Price : 22.61
Evaluated at bid price : 23.10
Bid-YTW : 5.90 %

IFC.PR.G FixedReset Ins Non Quote: 23.19 – 24.19
Spot Rate : 1.0000
Average : 0.6387

YTW SCENARIO
Maturity Type : Hard Maturity
Maturity Date : 2025-01-31
Maturity Price : 25.00
Evaluated at bid price : 23.19
Bid-YTW : 6.46 %

TD.PF.B FixedReset Disc Quote: 22.63 – 23.50
Spot Rate : 0.8700
Average : 0.5604

YTW SCENARIO
Maturity Type : Limit Maturity
Maturity Date : 2048-11-02
Maturity Price : 22.03
Evaluated at bid price : 22.63
Bid-YTW : 5.08 %

BAM.PR.K Floater Quote: 17.30 – 18.15
Spot Rate : 0.8500
Average : 0.5411

YTW SCENARIO
Maturity Type : Limit Maturity
Maturity Date : 2048-11-02
Maturity Price : 17.30
Evaluated at bid price : 17.30
Bid-YTW : 4.03 %

MFC.PR.N FixedReset Ins Non Quote: 22.01 – 23.19
Spot Rate : 1.1800
Average : 0.8955

YTW SCENARIO
Maturity Type : Hard Maturity
Maturity Date : 2025-01-31
Maturity Price : 25.00
Evaluated at bid price : 22.01
Bid-YTW : 6.99 %

EML.PR.A FixedReset Ins Non Quote: 25.60 – 26.40
Spot Rate : 0.8000
Average : 0.5418

YTW SCENARIO
Maturity Type : Call
Maturity Date : 2021-04-17
Maturity Price : 25.00
Evaluated at bid price : 25.60
Bid-YTW : 4.84 %

MAPF

MAPF Performance: October 2018

Malachite Aggressive Preferred Fund’s Net Asset Value per Unit as of the close October 31, 2018, was $9.8797.

Returns to October 31, 2018
Period MAPF BMO-CM “50” Preferred Share Index TXPR*
Total Return
CPD – according to Blackrock
One Month -4.05% -3.31% -2.74% N/A
Three Months -3.62% -3.11% -2.29% N/A
One Year +2.26% +0.27% +0.25% -0.32%
Two Years (annualized) +14.32% +9.72% +7.87% N/A
Three Years (annualized) +11.77% +8.41% +6.91% +6.42%
Four Years (annualized) +3.12% +1.91% +0.82% N/A
Five Years (annualized) +4.37% +2.42% +1.85% +1.43%
Six Years (annualized) +3.41% +2.07% +1.32% N/A
Seven Years (annualized) +4.49% +2.65% +1.97% N/A
Eight Years (annualized) +4.22% +3.12% +2.28% N/A
Nine Years (annualized) +5.99% +4.30% +3.32% N/A
Ten Years (annualized) +10.97% +5.57% +4.53% +3.98%
Eleven Years (annualized) +9.34% +3.82% +2.93%  
Twelve Years (annualized) +8.25% +3.06%    
Thirteen Years (annualized) +8.10% +3.22%    
Fourteen Years (annualized) +7.98% +3.27%    
Fifteen Years (annualized) +8.46% +3.43%    
Sixteen Years (annualized) +9.50% +3.67%    
Seventeen Years (annualized) +8.85% +3.66%    
MAPF returns assume reinvestment of distributions, and are shown after expenses but before fees.
The full name of the BMO-CM “50” index is the BMO Capital Markets “50” Preferred Share Index. It is calculated without accounting for fees.
“TXPR” is the S&P/TSX Preferred Share Index. It is calculated without accounting for fees, but does assume reinvestment of dividends.
CPD Returns are for the NAV and are after all fees and expenses. Reinvestment of dividends is assumed.
Figures for National Bank Preferred Equity Income Fund (formerly Omega Preferred Equity) (which are after all fees and expenses) for 1-, 3- and 12-months are -3.13%, -2.80% and -0.41%, respectively, according to Morningstar after all fees & expenses. Three year performance is +6.16%; five year is +2.30%; ten year is +4.92%
Manulife Preferred Income Class Adv has been terminated by Manulife.
Figures for Horizons Active Preferred Share ETF (HPR) (which are after all fees and expenses) for 1-, 3- and 12-months are -3.27%, -3.03% & +0.02%, respectively. Three year performance is +7.91%, five-year is +2.99%
Figures for National Bank Preferred Equity Fund (formerly Altamira Preferred Equity Fund) are -3.28%, -3.15% and -0.67% for one-, three- and twelve months, respectively. Three year performance is +7.16%; five-year is +1.99%

According to the fund’s fact sheet as of June 30, 2016, the fund’s inception date was October 30, 2015. I do not know how they justify this nonsensical statement, but will assume that prior performance is being suppressed in some perfectly legal manner that somebody at National considers ethical.

The figures for the NAV of BMO S&P/TSX Laddered Preferred Share Index ETF (ZPR) is +0.19% for the past twelve months. Two year performance is +9.50%, three year is +7.19%, five year is +0.33%.
Figures for Natixis Canadian Preferred Share Class Series F (formerly NexGen Canadian Preferred Share Tax Managed Fund) are -2.84%, -2.37% and -1.37% for one-, three- and twelve-months, respectively. Three year performance is +6.00%; five-year is +3.40%
Figures for BMO Preferred Share Fund (advisor series) according to Morningstar are -3.01%, -2.97% and -2.33% for the past one-, three- and twelve-months, respectively. Three year performance is +4.46%; five-year is +0.30%.
Figures for PowerShares Canadian Preferred Share Index Class, Series F are -1.00% for the past twelve months. The three-year figure is +8.37%; five years is +2.49%
Figures for the First Asset Preferred Share Investment Trust (PSF.UN) are no longer available since the fund has merged with First Asset Preferred Share ETF (FPR)
Figures for Lysander-Slater Preferred Share Dividend Fund according to Morningstar are -3.48%, -3.53% and -0.90% for the past one, three and twelve months, respectively. Three year performance is +6.37%.
Figures for the Desjardins Canadian Preferred Share Fund A Class, as reported by Morningstar are -3.11%, -3.08% and -1.36% for the past one, three and twelve months, respectively.

MAPF returns assume reinvestment of dividends, and are shown after expenses but before fees. Past performance is not a guarantee of future performance. You can lose money investing in Malachite Aggressive Preferred Fund or any other fund. For more information, see the fund’s main page. The fund is available either directly from Hymas Investment Management or through a brokerage account at Odlum Brown Limited.

The preferred share market seems to have paused its strong advance from the lows of late 2014 to early 2016, but I think that there is still room for outsized gains. The Seniority Spread (the interest-equivalent yield on reasonably liquid, investment-grade PerpetualDiscounts less the yield on long term corporate bonds) is still quite elevated (chart end-date 2018-10-12)

pl_181012_body_chart_1
Click for Big

Note that the Seniority Spread closed the month at 340bp.

… and the relationship between five-year Canada yields and yields on investment-grade FixedResets is also well within what I consider ‘decoupled panic’ territory (chart end-date 2018-10-12):

pl_181012_body_chart_5
Click for Big

In addition, I feel that the yield on five-year Canadas is unsustainably low (it should be the inflation rate plus an increment of … 1%? 1.5%? 2.0%?),and a return to sustainable levels is likely over the medium term.

FixedReset (Discount) performance on the month was -3.61% vs. PerpetualDiscounts of -3.73% in September; over the past three months, the two classes have performed roughly equally.:

himi_indexperf_181031
Click for Big

It is very peculiar that the two types of preferreds are moving in lockstep, as I noted in my commentary of October 29.

Floaters lost ground on the month, as they returned -3.39% for October and +25.2% for the past twelve months. But look at the long-term performance:

himi_floaterperf_181031
Click for Big

Some Assiduous Readers will be interested to observe that the ‘Quantitative Easing’ decline was not as bad as the ‘Credit Crunch’ decline, which took the sector down to the point where the 15-year cumulative total return was negative. I wrote about that at the time and still can’t get over it. Fifteen years!

As for the future, of course, it’s one thing to say that ‘spreads are unsustainable and so are government yields’ and it’s quite another to forecast just how and when a more economically sustainable environment will take effect. It could be years. There could be a reversal, particularly if Trump’s international trade policies cause a severe recession or even a depression. And, of course, I could be just plain wrong about the sustainability of the current environment.

I think that a broad, sustainable rally in FixedResets will require higher five-year Canada yields (or a widespread expectation of them) … and although I’m sure this will happen eventually, it would be foolish to speculate on just when it will happen!

Calculation of MAPF Sustainable Income Per Unit
Month NAVPU Portfolio
Average
YTW
Leverage
Divisor
Securities
Average
YTW
Capital
Gains
Multiplier
Sustainable
Income
per
current
Unit
June, 2007 9.3114 5.16% 1.03 5.01% 1.3240 0.3524
September 9.1489 5.35% 0.98 5.46% 1.3240 0.3773
December, 2007 9.0070 5.53% 0.942 5.87% 1.3240 0.3993
March, 2008 8.8512 6.17% 1.047 5.89% 1.3240 0.3938
June 8.3419 6.034% 0.952 6.338% 1.3240 $0.3993
September 8.1886 7.108% 0.969 7.335% 1.3240 $0.4537
December, 2008 8.0464 9.24% 1.008 9.166% 1.3240 $0.5571
March 2009 $8.8317 8.60% 0.995 8.802% 1.3240 $0.5872
June 10.9846 7.05% 0.999 7.057% 1.3240 $0.5855
September 12.3462 6.03% 0.998 6.042% 1.3240 $0.5634
December 2009 10.5662 5.74% 0.981 5.851% 1.1141 $0.5549
March 2010 10.2497 6.03% 0.992 6.079% 1.1141 $0.5593
June 10.5770 5.96% 0.996 5.984% 1.1141 $0.5681
September 11.3901 5.43% 0.980 5.540% 1.1141 $0.5664
December 2010 10.7659 5.37% 0.993 5.408% 1.0298 $0.5654
March, 2011 11.0560 6.00% 0.994 5.964% 1.0298 $0.6403
June 11.1194 5.87% 1.018 5.976% 1.0298 $0.6453
September 10.2709 6.10%
Note
1.001 6.106% 1.0298 $0.6090
December, 2011 10.0793 5.63%
Note
1.031 5.805% 1.0000 $0.5851
March, 2012 10.3944 5.13%
Note
0.996 5.109% 1.0000 $0.5310
June 10.2151 5.32%
Note
1.012 5.384% 1.0000 $0.5500
September 10.6703 4.61%
Note
0.997 4.624% 1.0000 $0.4934
December, 2012 10.8307 4.24% 0.989 4.287% 1.0000 $0.4643
March, 2013 10.9033 3.87% 0.996 3.886% 1.0000 $0.4237
June 10.3261 4.81% 0.998 4.80% 1.0000 $0.4957
September 10.0296 5.62% 0.996 5.643% 1.0000 $0.5660
December, 2013 9.8717 6.02% 1.008 5.972% 1.0000 $0.5895
March, 2014 10.2233 5.55% 0.998 5.561% 1.0000 $0.5685
June 10.5877 5.09% 0.998 5.100% 1.0000 $0.5395
September 10.4601 5.28% 0.997 5.296% 1.0000 $0.5540
December, 2014 10.5701 4.83% 1.009 4.787% 1.0000 $0.5060
March, 2015 9.9573 4.99% 1.001 4.985% 1.0000 $0.4964
June, 2015 9.4181 5.55% 1.002 5.539% 1.0000 $0.5217
September 7.8140 6.98% 0.999 6.987% 1.0000 $0.5460
December, 2015 8.1379 6.85% 0.997 6.871% 1.0000 $0.5592
March, 2016 7.4416 7.79% 0.998 7.805% 1.0000 $0.5808
June 7.6704 7.67% 1.011 7.587% 1.0000 $0.5819
September 8.0590 7.35% 0.993 7.402% 1.0000 $0.5965
December, 2016 8.5844 7.24% 0.990 7.313% 1.0000 $0.6278
March, 2017 9.3984 6.26% 0.994 6.298% 1.0000 $0.5919
June 9.5313 6.41% 0.998 6.423% 1.0000 $0.6122
September 9.7129 6.56% 0.998 6.573% 1.0000 $0.6384
December, 2017 10.0566 6.06% 1.004 6.036% 1.0000 $0.6070
March, 2018 10.2701 6.22% 1.007 6.177% 1.0000 $0.6344
June 10.2518 6.22% 0.995 6.251% 1.0000 $0.6408
September 10.2965 6.62% 1.018 6.503% 1.0000 $0.6696
October, 2018 9.8797 7.13% 1.002 7.116% 1.0000 $0.7030
NAVPU is shown after quarterly distributions of dividend income and annual distribution of capital gains.
Portfolio YTW includes cash (or margin borrowing), with an assumed interest rate of 0.00%
The Leverage Divisor indicates the level of cash in the account: if the portfolio is 1% in cash, the Leverage Divisor will be 0.99
Securities YTW divides “Portfolio YTW” by the “Leverage Divisor” to show the average YTW on the securities held; this assumes that the cash is invested in (or raised from) all securities held, in proportion to their holdings.
The Capital Gains Multiplier adjusts for the effects of Capital Gains Dividends. On 2009-12-31, there was a capital gains distribution of $1.989262 which is assumed for this purpose to have been reinvested at the final price of $10.5662. Thus, a holder of one unit pre-distribution would have held 1.1883 units post-distribution; the CG Multiplier reflects this to make the time-series comparable. Note that Dividend Distributions are not assumed to be reinvested.
Sustainable Income is the resultant estimate of the fund’s dividend income per current unit, before fees and expenses. Note that a “current unit” includes reinvestment of prior capital gains; a unitholder would have had the calculated sustainable income with only, say, 0.9 units in the past which, with reinvestment of capital gains, would become 1.0 current units.
DeemedRetractibles are comprised of all Straight Perpetuals (both PerpetualDiscount and PerpetualPremium) issued by BMO, BNS, CM, ELF, GWO, HSB, IAG, MFC, NA, RY, SLF and TD, which are not exchangable into common at the option of the company (definition refined in May, 2011). These issues are analyzed as if their prospectuses included a requirement to redeem at par on or prior to 2022-1-31 (banks) or 2025-1-31 (insurers and insurance holding companies), in addition to the call schedule explicitly defined. See OSFI Does Not Grandfather Extant Tier 1 Capital, CM.PR.D, CM.PR.E, CM.PR.G: Seeking NVCC Status and the January, February, March and June, 2011, editions of PrefLetter for the rationale behind this analysis.

The same reasoning is also applied to FixedResets from these issuers, other than explicitly defined NVCC from banks.

Yields for September, 2011, to January, 2012, were calculated by imposing a cap of 10% on the yields of YLO issues held, in order to avoid their extremely high calculated yields distorting the calculation and to reflect the uncertainty in the marketplace that these yields will be realized. From February to September 2012, yields on these issues have been set to zero. All YLO issues held were sold in October 2012.

These calculations were performed assuming constant contemporary GOC-5 and 3-Month Bill rates, as follows:

Canada Yields Assumed in Calculations
Month-end GOC-5 3-Month Bill
September, 2015 0.78% 0.40%
December, 2015 0.71% 0.46%
March, 2016 0.70% 0.44%
June 0.57% 0.47%
September 0.58% 0.53%
December, 2016 1.16% 0.47%
March, 2017 1.08% 0.55%
June 1.35% 0.69%
September 1.79% 0.97%
December, 2017 1.83% 1.00%
March, 2018 2.06% 1.08%
June 1.95% 1.22%
September 2.33% 1.55%
October, 2018 2.36% 1.72%

Significant positions were held in NVCC non-compliant regulated FixedReset issues on October 31, 2018; all of these currently have their yields calculated with the presumption that they will be called by the issuers at par prior to 2022-1-31 (banks) or 2025-1-31 (insurers and insurance holding companies) or on a different date (SplitShares) This presents another complication in the calculation of sustainable yield, which also assumes that redemption proceeds will be reinvested at the same rate. It will also be noted that my analysis of likely insurance industry regulation as updated is not given much weight by the market.

I will also note that the sustainable yield calculated above is not directly comparable with any yield calculation currently reported by any other preferred share fund as far as I am aware. The Sustainable Yield depends on:
i) Calculating Yield-to-Worst for each instrument and using this yield for reporting purposes;
ii) Using the contemporary value of Five-Year Canadas to estimate dividends after reset for FixedResets. The assumption regarding the five-year Canada rate has become more important as the proportion of low-spread FixedResets in the portfolio has increased.
iii) Making the assumption that deeply discounted NVCC non-compliant issues from both banks and insurers, both Straight and FixedResets will be redeemed at par on their DeemedMaturity date as discussed above.

Market Action

November 1, 2018

HIMIPref™ Preferred Indices
These values reflect the December 2008 revision of the HIMIPref™ Indices

Values are provisional and are finalized monthly
Index Mean
Current
Yield
(at bid)
Median
YTW
Median
Average
Trading
Value
Median
Mod Dur
(YTW)
Issues Day’s Perf. Index Value
Ratchet 0.00 % 0.00 % 0 0.00 0 1.3895 % 3,066.3
FixedFloater 0.00 % 0.00 % 0 0.00 0 1.3895 % 5,626.5
Floater 3.79 % 4.03 % 41,439 17.35 4 1.3895 % 3,242.6
OpRet 0.00 % 0.00 % 0 0.00 0 0.4896 % 3,204.8
SplitShare 4.64 % 4.95 % 56,721 4.67 5 0.4896 % 3,827.3
Interest-Bearing 0.00 % 0.00 % 0 0.00 0 0.4896 % 2,986.2
Perpetual-Premium 5.71 % 5.70 % 71,047 14.17 12 0.6150 % 2,874.2
Perpetual-Discount 5.65 % 5.76 % 75,442 14.24 21 0.4616 % 2,904.2
FixedReset Disc 4.33 % 5.22 % 163,395 15.23 45 0.8591 % 2,517.3
Deemed-Retractible 5.36 % 6.73 % 72,028 5.20 27 0.3508 % 2,893.8
FloatingReset 3.82 % 3.94 % 47,135 5.46 4 0.5510 % 2,777.7
FixedReset Prem 4.93 % 4.41 % 253,695 3.07 34 0.2018 % 2,544.8
FixedReset Bank Non 2.97 % 3.73 % 114,640 0.31 6 0.2347 % 2,577.4
FixedReset Ins Non 4.47 % 5.88 % 129,933 5.31 22 1.1941 % 2,504.2
Performance Highlights
Issue Index Change Notes
TD.PF.D FixedReset Disc -1.16 % YTW SCENARIO
Maturity Type : Limit Maturity
Maturity Date : 2048-11-01
Maturity Price : 23.55
Evaluated at bid price : 23.92
Bid-YTW : 5.24 %
TRP.PR.K FixedReset Prem -1.01 % YTW SCENARIO
Maturity Type : Call
Maturity Date : 2022-05-31
Maturity Price : 25.00
Evaluated at bid price : 25.44
Bid-YTW : 4.64 %
MFC.PR.N FixedReset Ins Non 1.00 % YTW SCENARIO
Maturity Type : Hard Maturity
Maturity Date : 2025-01-31
Maturity Price : 25.00
Evaluated at bid price : 22.17
Bid-YTW : 6.85 %
TRP.PR.C FixedReset Disc 1.01 % YTW SCENARIO
Maturity Type : Limit Maturity
Maturity Date : 2048-11-01
Maturity Price : 17.02
Evaluated at bid price : 17.02
Bid-YTW : 5.46 %
MFC.PR.L FixedReset Ins Non 1.03 % YTW SCENARIO
Maturity Type : Hard Maturity
Maturity Date : 2025-01-31
Maturity Price : 25.00
Evaluated at bid price : 21.60
Bid-YTW : 7.35 %
BMO.PR.Z Perpetual-Premium 1.03 % YTW SCENARIO
Maturity Type : Limit Maturity
Maturity Date : 2048-11-01
Maturity Price : 23.98
Evaluated at bid price : 24.45
Bid-YTW : 5.09 %
CU.PR.G Perpetual-Discount 1.05 % YTW SCENARIO
Maturity Type : Limit Maturity
Maturity Date : 2048-11-01
Maturity Price : 20.26
Evaluated at bid price : 20.26
Bid-YTW : 5.66 %
NA.PR.E FixedReset Disc 1.08 % YTW SCENARIO
Maturity Type : Limit Maturity
Maturity Date : 2048-11-01
Maturity Price : 22.52
Evaluated at bid price : 23.40
Bid-YTW : 5.15 %
SLF.PR.E Deemed-Retractible 1.10 % YTW SCENARIO
Maturity Type : Hard Maturity
Maturity Date : 2025-01-31
Maturity Price : 25.00
Evaluated at bid price : 20.25
Bid-YTW : 8.63 %
IAG.PR.A Deemed-Retractible 1.16 % YTW SCENARIO
Maturity Type : Hard Maturity
Maturity Date : 2025-01-31
Maturity Price : 25.00
Evaluated at bid price : 20.99
Bid-YTW : 8.04 %
CU.PR.C FixedReset Disc 1.16 % YTW SCENARIO
Maturity Type : Limit Maturity
Maturity Date : 2048-11-01
Maturity Price : 21.45
Evaluated at bid price : 21.80
Bid-YTW : 5.20 %
BAM.PF.H FixedReset Prem 1.19 % YTW SCENARIO
Maturity Type : Call
Maturity Date : 2020-12-31
Maturity Price : 25.00
Evaluated at bid price : 25.56
Bid-YTW : 4.15 %
SLF.PR.A Deemed-Retractible 1.20 % YTW SCENARIO
Maturity Type : Hard Maturity
Maturity Date : 2025-01-31
Maturity Price : 25.00
Evaluated at bid price : 21.10
Bid-YTW : 8.12 %
TRP.PR.F FloatingReset 1.23 % YTW SCENARIO
Maturity Type : Limit Maturity
Maturity Date : 2048-11-01
Maturity Price : 19.70
Evaluated at bid price : 19.70
Bid-YTW : 4.66 %
PWF.PR.P FixedReset Disc 1.24 % YTW SCENARIO
Maturity Type : Limit Maturity
Maturity Date : 2048-11-01
Maturity Price : 18.01
Evaluated at bid price : 18.01
Bid-YTW : 5.24 %
IFC.PR.C FixedReset Ins Non 1.32 % YTW SCENARIO
Maturity Type : Hard Maturity
Maturity Date : 2025-01-31
Maturity Price : 25.00
Evaluated at bid price : 22.95
Bid-YTW : 5.88 %
PWF.PR.R Perpetual-Premium 1.43 % YTW SCENARIO
Maturity Type : Limit Maturity
Maturity Date : 2048-11-01
Maturity Price : 23.77
Evaluated at bid price : 24.10
Bid-YTW : 5.73 %
MFC.PR.C Deemed-Retractible 1.45 % YTW SCENARIO
Maturity Type : Hard Maturity
Maturity Date : 2025-01-31
Maturity Price : 25.00
Evaluated at bid price : 19.58
Bid-YTW : 9.32 %
TRP.PR.G FixedReset Disc 1.52 % YTW SCENARIO
Maturity Type : Limit Maturity
Maturity Date : 2048-11-01
Maturity Price : 23.02
Evaluated at bid price : 23.35
Bid-YTW : 5.57 %
TRP.PR.A FixedReset Disc 1.55 % YTW SCENARIO
Maturity Type : Limit Maturity
Maturity Date : 2048-11-01
Maturity Price : 19.60
Evaluated at bid price : 19.60
Bid-YTW : 5.42 %
MFC.PR.K FixedReset Ins Non 1.66 % YTW SCENARIO
Maturity Type : Hard Maturity
Maturity Date : 2025-01-31
Maturity Price : 25.00
Evaluated at bid price : 22.10
Bid-YTW : 7.04 %
POW.PR.A Perpetual-Premium 1.67 % YTW SCENARIO
Maturity Type : Limit Maturity
Maturity Date : 2048-11-01
Maturity Price : 24.16
Evaluated at bid price : 24.41
Bid-YTW : 5.78 %
SLF.PR.C Deemed-Retractible 1.75 % YTW SCENARIO
Maturity Type : Hard Maturity
Maturity Date : 2025-01-31
Maturity Price : 25.00
Evaluated at bid price : 20.30
Bid-YTW : 8.52 %
MFC.PR.B Deemed-Retractible 1.76 % YTW SCENARIO
Maturity Type : Hard Maturity
Maturity Date : 2025-01-31
Maturity Price : 25.00
Evaluated at bid price : 20.25
Bid-YTW : 8.84 %
NA.PR.W FixedReset Disc 1.77 % YTW SCENARIO
Maturity Type : Limit Maturity
Maturity Date : 2048-11-01
Maturity Price : 21.53
Evaluated at bid price : 21.90
Bid-YTW : 5.20 %
CM.PR.S FixedReset Disc 1.84 % YTW SCENARIO
Maturity Type : Limit Maturity
Maturity Date : 2048-11-01
Maturity Price : 22.76
Evaluated at bid price : 23.85
Bid-YTW : 4.93 %
BAM.PF.J FixedReset Prem 1.84 % YTW SCENARIO
Maturity Type : Call
Maturity Date : 2022-12-31
Maturity Price : 25.00
Evaluated at bid price : 24.90
Bid-YTW : 5.00 %
TRP.PR.B FixedReset Disc 1.85 % YTW SCENARIO
Maturity Type : Limit Maturity
Maturity Date : 2048-11-01
Maturity Price : 16.50
Evaluated at bid price : 16.50
Bid-YTW : 5.36 %
SLF.PR.H FixedReset Ins Non 1.94 % YTW SCENARIO
Maturity Type : Hard Maturity
Maturity Date : 2025-01-31
Maturity Price : 25.00
Evaluated at bid price : 21.00
Bid-YTW : 6.99 %
BAM.PR.R FixedReset Disc 1.95 % YTW SCENARIO
Maturity Type : Limit Maturity
Maturity Date : 2048-11-01
Maturity Price : 20.41
Evaluated at bid price : 20.41
Bid-YTW : 5.46 %
BAM.PR.T FixedReset Disc 2.00 % YTW SCENARIO
Maturity Type : Limit Maturity
Maturity Date : 2048-11-01
Maturity Price : 20.45
Evaluated at bid price : 20.45
Bid-YTW : 5.46 %
RY.PR.J FixedReset Disc 2.03 % YTW SCENARIO
Maturity Type : Limit Maturity
Maturity Date : 2048-11-01
Maturity Price : 23.71
Evaluated at bid price : 24.10
Bid-YTW : 5.15 %
PWF.PR.T FixedReset Disc 2.12 % YTW SCENARIO
Maturity Type : Limit Maturity
Maturity Date : 2048-11-01
Maturity Price : 22.06
Evaluated at bid price : 22.65
Bid-YTW : 5.22 %
PVS.PR.D SplitShare 2.20 % YTW SCENARIO
Maturity Type : Hard Maturity
Maturity Date : 2021-10-08
Maturity Price : 25.00
Evaluated at bid price : 25.06
Bid-YTW : 4.69 %
BAM.PF.A FixedReset Disc 2.29 % YTW SCENARIO
Maturity Type : Limit Maturity
Maturity Date : 2048-11-01
Maturity Price : 22.83
Evaluated at bid price : 24.10
Bid-YTW : 5.39 %
BAM.PR.X FixedReset Disc 2.33 % YTW SCENARIO
Maturity Type : Limit Maturity
Maturity Date : 2048-11-01
Maturity Price : 18.00
Evaluated at bid price : 18.00
Bid-YTW : 5.42 %
CM.PR.Q FixedReset Disc 2.39 % YTW SCENARIO
Maturity Type : Limit Maturity
Maturity Date : 2048-11-01
Maturity Price : 23.60
Evaluated at bid price : 23.96
Bid-YTW : 5.21 %
BAM.PR.C Floater 2.49 % YTW SCENARIO
Maturity Type : Limit Maturity
Maturity Date : 2048-11-01
Maturity Price : 17.32
Evaluated at bid price : 17.32
Bid-YTW : 4.03 %
BAM.PR.B Floater 2.49 % YTW SCENARIO
Maturity Type : Limit Maturity
Maturity Date : 2048-11-01
Maturity Price : 17.30
Evaluated at bid price : 17.30
Bid-YTW : 4.03 %
HSE.PR.C FixedReset Disc 2.52 % YTW SCENARIO
Maturity Type : Limit Maturity
Maturity Date : 2048-11-01
Maturity Price : 23.07
Evaluated at bid price : 23.58
Bid-YTW : 5.78 %
BAM.PR.M Perpetual-Discount 2.60 % YTW SCENARIO
Maturity Type : Limit Maturity
Maturity Date : 2048-11-01
Maturity Price : 20.15
Evaluated at bid price : 20.15
Bid-YTW : 5.97 %
MFC.PR.J FixedReset Ins Non 2.72 % YTW SCENARIO
Maturity Type : Hard Maturity
Maturity Date : 2025-01-31
Maturity Price : 25.00
Evaluated at bid price : 24.21
Bid-YTW : 5.71 %
BAM.PF.G FixedReset Disc 2.89 % YTW SCENARIO
Maturity Type : Limit Maturity
Maturity Date : 2048-11-01
Maturity Price : 23.48
Evaluated at bid price : 23.87
Bid-YTW : 5.42 %
MFC.PR.F FixedReset Ins Non 3.03 % YTW SCENARIO
Maturity Type : Hard Maturity
Maturity Date : 2025-01-31
Maturity Price : 25.00
Evaluated at bid price : 17.67
Bid-YTW : 9.44 %
SLF.PR.G FixedReset Ins Non 3.54 % YTW SCENARIO
Maturity Type : Hard Maturity
Maturity Date : 2025-01-31
Maturity Price : 25.00
Evaluated at bid price : 19.00
Bid-YTW : 8.44 %
TRP.PR.D FixedReset Disc 5.17 % YTW SCENARIO
Maturity Type : Limit Maturity
Maturity Date : 2048-11-01
Maturity Price : 21.45
Evaluated at bid price : 21.76
Bid-YTW : 5.45 %
MFC.PR.I FixedReset Ins Non 5.36 % YTW SCENARIO
Maturity Type : Hard Maturity
Maturity Date : 2025-01-31
Maturity Price : 25.00
Evaluated at bid price : 23.96
Bid-YTW : 5.59 %
Volume Highlights
Issue Index Shares
Traded
Notes
TD.PF.I FixedReset Prem 85,850 YTW SCENARIO
Maturity Type : Call
Maturity Date : 2022-10-31
Maturity Price : 25.00
Evaluated at bid price : 25.00
Bid-YTW : 4.53 %
CM.PR.R FixedReset Prem 83,099 YTW SCENARIO
Maturity Type : Call
Maturity Date : 2022-07-31
Maturity Price : 25.00
Evaluated at bid price : 25.06
Bid-YTW : 4.36 %
BMO.PR.D FixedReset Prem 73,908 YTW SCENARIO
Maturity Type : Call
Maturity Date : 2022-08-25
Maturity Price : 25.00
Evaluated at bid price : 24.94
Bid-YTW : 4.41 %
MFC.PR.K FixedReset Ins Non 59,600 YTW SCENARIO
Maturity Type : Hard Maturity
Maturity Date : 2025-01-31
Maturity Price : 25.00
Evaluated at bid price : 22.10
Bid-YTW : 7.04 %
RY.PR.Z FixedReset Disc 48,806 YTW SCENARIO
Maturity Type : Limit Maturity
Maturity Date : 2048-11-01
Maturity Price : 22.19
Evaluated at bid price : 22.89
Bid-YTW : 4.94 %
BNS.PR.Z FixedReset Bank Non 44,000 YTW SCENARIO
Maturity Type : Hard Maturity
Maturity Date : 2022-01-31
Maturity Price : 25.00
Evaluated at bid price : 23.65
Bid-YTW : 4.36 %
There were 34 other index-included issues trading in excess of 10,000 shares.
Wide Spread Highlights
Issue Index Quote Data and Yield Notes
BAM.PF.D Perpetual-Discount Quote: 20.52 – 21.25
Spot Rate : 0.7300
Average : 0.5081

YTW SCENARIO
Maturity Type : Limit Maturity
Maturity Date : 2048-11-01
Maturity Price : 20.52
Evaluated at bid price : 20.52
Bid-YTW : 6.05 %

BAM.PR.X FixedReset Disc Quote: 18.00 – 18.93
Spot Rate : 0.9300
Average : 0.7349

YTW SCENARIO
Maturity Type : Limit Maturity
Maturity Date : 2048-11-01
Maturity Price : 18.00
Evaluated at bid price : 18.00
Bid-YTW : 5.42 %

BMO.PR.Y FixedReset Disc Quote: 23.77 – 24.35
Spot Rate : 0.5800
Average : 0.3892

YTW SCENARIO
Maturity Type : Limit Maturity
Maturity Date : 2048-11-01
Maturity Price : 23.41
Evaluated at bid price : 23.77
Bid-YTW : 5.19 %

SLF.PR.D Deemed-Retractible Quote: 20.14 – 20.58
Spot Rate : 0.4400
Average : 0.2953

YTW SCENARIO
Maturity Type : Hard Maturity
Maturity Date : 2025-01-31
Maturity Price : 25.00
Evaluated at bid price : 20.14
Bid-YTW : 8.67 %

RY.PR.W Perpetual-Discount Quote: 23.78 – 24.08
Spot Rate : 0.3000
Average : 0.1768

YTW SCENARIO
Maturity Type : Limit Maturity
Maturity Date : 2048-11-01
Maturity Price : 23.51
Evaluated at bid price : 23.78
Bid-YTW : 5.15 %

PWF.PR.H Perpetual-Premium Quote: 24.80 – 25.11
Spot Rate : 0.3100
Average : 0.2029

YTW SCENARIO
Maturity Type : Limit Maturity
Maturity Date : 2048-11-01
Maturity Price : 24.55
Evaluated at bid price : 24.80
Bid-YTW : 5.83 %

MAPF

MAPF Portfolio Composition: October, 2018

Turnover remained light in October at 3%.

There is extreme segmentation in the marketplace, with OSFI’s NVCC rule changes in February 2011 having had the effect of splitting the formerly relatively homogeneous Straight Perpetual class of preferreds into three parts:

  • Unaffected Straight Perpetuals
  • DeemedRetractibles explicitly subject to the rules (banks)
  • DeemedRetractibles considered by me, but not (yet!) by the market, to be likely to be explicitly subject to the rules in the future (insurers and insurance holding companies)

This segmentation, and the extreme valuation differences between the segments, has cut down markedly on the opportunities for trading.

To make this more clear, it used to be that there were 70-odd Straight Perpetuals and I was more or less indifferent as to which ones I owned (subject, of course, to issuer concentration concerns and other risk management factors). Thus, if any one of these 70 were to go down in price by – say – $0.25, I would quite often have something in inventory that I’d be willing to swap for it. The segmentation means that I am no longer indifferent; in addition to checking the valuation of a potential buy to other Straights, I also have to check its peer group. This cuts down on the potential for trading.

And, of course, the same segmentation has the same effect on trading opportunities between FixedReset issues.

There is no real hope that this situation will be corrected in the near-term. OSFI has indicated that the long-promised “Draft Definition of Capital” for insurers will not be issued “for public consultation in late 2012 or early 2013”, as they fear that it might encourage speculation in the marketplace. It is not clear why OSFI is so afraid of informed speculation, since the constant speculation in the marketplace is currently less informed than it would be with a little bit of regulatory clarity. While the framework has been updated, the modifications focus on the amount of capital required, not the required characteristics of that capital. However, OSFI has recently indicated that it would support a mechanism similar to the NVCC rule for banks, so we may see some developments as the IAIS deliberations regarding insurance capital continue.

As a result of this delay, I have extended the Deemed Maturity date for insurers and insurance holding companies by three years (to 2025-1-31), in the expectation that when OSFI finally does provide clarity, they will allow the same degree of lead-in time for these companies as they did for banks. This had a major effect on the durations of preferred shares subject to the change but, fortunately, not much on their calculated yields as most of these issues were either trading near par when the change was made or were trading at sufficient premium that a par call was expected on economic grounds. However, with the declines in the market over the past nine months, the expected capital gain on redemption of the insurance-issued DeemedRetractibles has become an important component of the calculated yield.

Due to the footdragging by OSFI, I will be extending the DeemedMaturity date for insurance issues by another few years in the near future.

Sectoral distribution of the MAPF portfolio on October 31 was as follows:

MAPF Sectoral Analysis 2018-10-31
HIMI Indices Sector Weighting YTW ModDur
Ratchet 0% N/A N/A
FixFloat 0% N/A N/A
Floater 0% N/A N/A
OpRet 0% N/A N/A
SplitShare 9.5% 4.96% 5.12
Interest Rearing 0% N/A N/A
PerpetualPremium 0% N/A N/A
PerpetualDiscount 12.1% 5.87% 14.06
Fixed-Reset Discount 23.2% 5.65% 14.92
Deemed-Retractible 8.9% 8.82% 5.23
FloatingReset 0% N/A N/A
FixedReset Premium 0% N/A N/A
FixedReset Bank non-NVCC 0% N/A N/A
FixedReset Insurance non-NVCC 35.4% 8.62% 5.48
Scraps – Ratchet 0% N/A N/A
Scraps – FixedFloater 0% N/A N/A
Scraps – Floater 0% N/A N/A
Scraps – OpRet 0% N/A N/A
Scraps – SplitShare 0% N/A N/A
Scraps – PerpPrem 0% N/A N/A
Scraps – PerpDisc 0% N/A N/A
Scraps – FR Discount 10.5% 7.10% 12.91
Scraps – DeemedRet 0% N/A N/A
Scraps – FloatingReset 0.6% 8.3% 10.99
Scraps – FR Premium 0% N/A N/A
Scraps – Bank non-NVCC 0% N/A N/A
Scraps – Ins non-NVCC 0% N/A N/A
Cash -0.2% 0.00% 0.00
Total 100% 7.13% 9.48
Totals and changes will not add precisely due to rounding. Cash is included in totals with duration and yield both equal to zero.
DeemedRetractibles are comprised of all Straight Perpetuals (both PerpetualDiscount and PerpetualPremium) issued by BMO, BNS, CM, ELF, GWO, HSB, IAG, MFC, NA, RY, SLF and TD, which are not exchangable into common at the option of the company. These issues are analyzed as if their prospectuses included a requirement to redeem at par on or prior to 2022-1-31 (banks) or 2025-1-3 (insurers and insurance holding companies), in addition to the call schedule explicitly defined. See OSFI Does Not Grandfather Extant Tier 1 Capital, CM.PR.D, CM.PR.E, CM.PR.G: NVCC Status Confirmed and the January, February, March and June, 2011, editions of PrefLetter for the rationale behind this analysis.

Note that the estimate for the time this will become effective for insurers and insurance holding companies was extended by three years in April 2013, due to the delays in OSFI’s providing clarity on the issue.

Calculations of resettable instruments are performed assuming a constant GOC-5 rate of 2.36% and a constant 3-Month Bill rate of 1.72%

The “total” reflects the un-leveraged total portfolio (i.e., cash is included in the portfolio calculations and is deemed to have a duration and yield of 0.00.). MAPF will often have relatively large cash balances, both credit and debit, to facilitate trading. Figures presented in the table have been rounded to the indicated precision.

Credit distribution is:

MAPF Credit Analysis 2018-10-31
DBRS Rating Weighting
Pfd-1 0
Pfd-1(low) 0
Pfd-2(high) 26.2%
Pfd-2 32.8%
Pfd-2(low) 30.0%
Pfd-3(high) 3.2%
Pfd-3 4.5%
Pfd-3(low) 2.9%
Pfd-4(high) 0%
Pfd-4 0%
Pfd-4(low) 0%
Pfd-5(high) 0.6%
Pfd-5 0.0%
Cash -0.2%
Totals will not add precisely due to rounding.
The fund holds a position in AZP.PR.C, which is rated P-5(high) by S&P and is unrated by DBRS; it is included in the Pfd-5(high) total.
A position held in INE.PR.A is not rated by DBRS, but has been included as “Pfd-3” in the above table on the basis of its S&P rating of P-3.

Liquidity Distribution is:

MAPF Liquidity Analysis 2018-10-31
Average Daily Trading Weighting
<$50,000 9.5%
$50,000 – $100,000 47.8%
$100,000 – $200,000 39.9%
$200,000 – $300,000 2.2%
>$300,000 0.9%
Cash -0.2%
Totals will not add precisely due to rounding.

MAPF is, of course, Malachite Aggressive Preferred Fund, a “unit trust” managed by Hymas Investment Management Inc. Further information and links to performance, audited financials and subscription information are available the fund’s web page. The fund may be purchased either directly from Hymas Investment Management or through a brokerage account at Odlum Brown Limited. A “unit trust” is like a regular mutual fund, but is sold by offering memorandum rather than prospectus. This is cheaper, but means subscription is restricted to “accredited investors” (as defined by the Ontario Securities Commission). Fund past performances are not a guarantee of future performance. You can lose money investing in MAPF or any other fund.

A similar portfolio composition analysis has been performed on the Claymore Preferred Share ETF (symbol CPD) (and other funds) as of July 31, 2017, and published in the August, 2017, PrefLetter. It is fair to say:

  • MAPF credit quality is much better
  • MAPF liquidity is lower
  • MAPF Yield is higher
  • Weightings
    • MAPF is somewhat mre exposed to Straight Perpetuals
      • Much less exposed to PerpetualPremiums
    • Neither portfolio is exposed to Operating Retractibles (there aren’t too many of those any more!)
    • MAPF is more exposed to SplitShares
    • MAPF is less exposed to FixFloat / Floater / Ratchet
    • MAPF is a little lower weighted in FixedResets, but has a greater emphasis on lower-spread issues