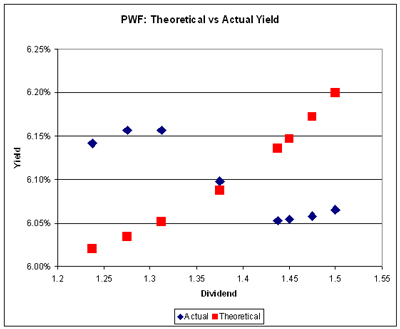
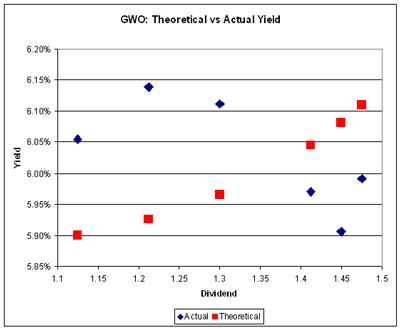
The recent slide in PerpetualDiscounts has been particularly hard on insurers – and particularly the lower coupon issues in a continuation of the trend discussed in MAPF: February Performance.
In fact, implied volatility has gone negative:
Both graphs have been prepared using the Straight Perpetual Implied Volatility Calculator and, for purposes of the theoretical curve, setting the implied volatility to 15% / 3 Years.


[…] time to time – in the spring of 2010, I noted that the relative prices for these two issues reflected negative Implied Volatility (which cannot actually be calculated because the math blows up). It happens. Sometimes, when the […]