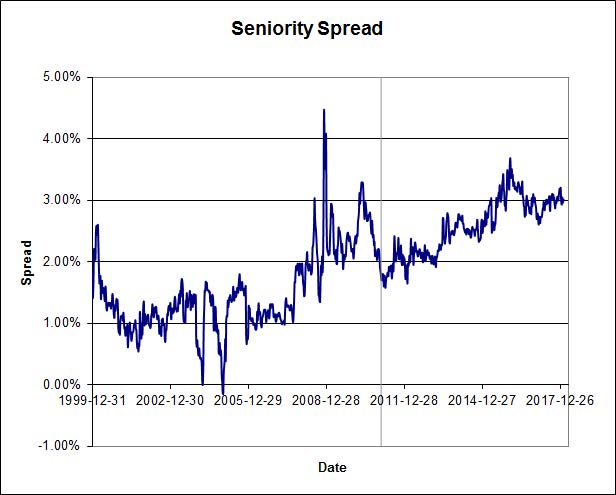
MAPF

MAPF Portfolio Composition: September 2017

Turnover increased slightly to about 11% in a relatively quiet September.

There is extreme segmentation in the marketplace, with OSFI’s NVCC rule changes in February 2011 having had the effect of splitting the formerly relatively homogeneous Straight Perpetual class of preferreds into three parts:

  • Unaffected Straight Perpetuals
  • DeemedRetractibles explicitly subject to the rules (banks)
  • DeemedRetractibles considered by me, but not (yet!) by the market, to be likely to be explicitly subject to the rules in the future (insurers and insurance holding companies)

This segmentation, and the extreme valuation differences between the segments, has cut down markedly on the opportunities for trading.

To make this more clear, it used to be that there were 70-odd Straight Perpetuals and I was more or less indifferent as to which ones I owned (subject, of course, to issuer concentration concerns and other risk management factors). Thus, if any one of these 70 were to go down in price by – say – $0.25, I would quite often have something in inventory that I’d be willing to swap for it. The segmentation means that I am no longer indifferent; in addition to checking the valuation of a potential buy to other Straights, I also have to check its peer group. This cuts down on the potential for trading.

And, of course, the same segmentation has the same effect on trading opportunities between FixedReset issues.

There is no real hope that this situation will be corrected in the near-term. OSFI has indicated that the long-promised “Draft Definition of Capital” for insurers will not be issued “for public consultation in late 2012 or early 2013”, as they fear that it might encourage speculation in the marketplace. It is not clear why OSFI is so afraid of informed speculation, since the constant speculation in the marketplace is currently less informed than it would be with a little bit of regulatory clarity. While the framework has been updated, the modifications focus on the amount of capital required, not the required characteristics of that capital. However, OSFI has recently indicated that it would support a mechanism similar to the NVCC rule for banks, so we may see some developments as the IAIS deliberations regarding insurance capital continue.

As a result of this delay, I have extended the Deemed Maturity date for insurers and insurance holding companies by three years (to 2025-1-31), in the expectation that when OSFI finally does provide clarity, they will allow the same degree of lead-in time for these companies as they did for banks. This had a major effect on the durations of preferred shares subject to the change but, fortunately, not much on their calculated yields as most of these issues were either trading near par when the change was made or were trading at sufficient premium that a par call was expected on economic grounds. However, with the declines in the market over the past nine months, the expected capital gain on redemption of the insurance-issued DeemedRetractibles has become an important component of the calculated yield.

Due to the footdragging by OSFI, I will be extending the DeemedMaturity date for insurance issues by another few years in the near future.

Sectoral distribution of the MAPF portfolio on September 29 was as follows:

MAPF Sectoral Analysis 2017-9-29
HIMI Indices Sector Weighting YTW ModDur
Ratchet 0% N/A N/A
FixFloat 0% N/A N/A
Floater 0% N/A N/A
OpRet 0% N/A N/A
SplitShare 3.7% 4.65% 5.52
Interest Rearing 0% N/A N/A
PerpetualPremium 0% N/A N/A
PerpetualDiscount 14.3% 5.48% 14.70
Fixed-Reset 64.1% 6.75% 6.44
Deemed-Retractible 1.1% 6.99% 6.08
FloatingReset 7.2% 8.28% 6.46
Scraps (Various) 9.4% 6.41% 13.71
Cash +0.2% 0.00% 0.00
Total 100% 6.56% 8.25
Totals and changes will not add precisely due to rounding. Cash is included in totals with duration and yield both equal to zero.
DeemedRetractibles are comprised of all Straight Perpetuals (both PerpetualDiscount and PerpetualPremium) issued by BMO, BNS, CM, ELF, GWO, HSB, IAG, MFC, NA, RY, SLF and TD, which are not exchangable into common at the option of the company. These issues are analyzed as if their prospectuses included a requirement to redeem at par on or prior to 2022-1-31 (banks) or 2025-1-3 (insurers and insurance holding companies), in addition to the call schedule explicitly defined. See OSFI Does Not Grandfather Extant Tier 1 Capital, CM.PR.D, CM.PR.E, CM.PR.G: NVCC Status Confirmed and the January, February, March and June, 2011, editions of PrefLetter for the rationale behind this analysis.

Note that the estimate for the time this will become effective for insurers and insurance holding companies was extended by three years in April 2013, due to the delays in OSFI’s providing clarity on the issue.

Calculations of resettable instruments are performed assuming a constant GOC-5 rate of 1.79% and a constant 3-Month Bill rate of 0.97%

The “total” reflects the un-leveraged total portfolio (i.e., cash is included in the portfolio calculations and is deemed to have a duration and yield of 0.00.). MAPF will often have relatively large cash balances, both credit and debit, to facilitate trading. Figures presented in the table have been rounded to the indicated precision.

Credit distribution is:

MAPF Credit Analysis 2017-9-30
DBRS Rating Weighting
Pfd-1 0
Pfd-1(low) 0
Pfd-2(high) 49.3%
Pfd-2 32.6%
Pfd-2(low) 8.6%
Pfd-3(high) 1.8%
Pfd-3 4.2%
Pfd-3(low) 2.8%
Pfd-4(high) 0%
Pfd-4 0%
Pfd-4(low) 0%
Pfd-5(high) 0.7%
Pfd-5 0.0%
Cash +0.2%
Totals will not add precisely due to rounding.
The fund holds a position in AZP.PR.C, which is rated P-5(high) by S&P and is unrated by DBRS; it is included in the Pfd-5(high) total.
A position held in INE.PR.A is not rated by DBRS, but has been included as “Pfd-3” in the above table on the basis of its S&P rating of P-3.

Liquidity Distribution is:

MAPF Liquidity Analysis 2017-9-29
Average Daily Trading Weighting
<$50,000 30.3%
$50,000 – $100,000 44.1%
$100,000 – $200,000 23.5%
$200,000 – $300,000 0%
>$300,000 1.9%
Cash +0.2%
Totals will not add precisely due to rounding.

MAPF is, of course, Malachite Aggressive Preferred Fund, a “unit trust” managed by Hymas Investment Management Inc. Further information and links to performance, audited financials and subscription information are available the fund’s web page. The fund may be purchased either directly from Hymas Investment Management or through a brokerage account at Odlum Brown Limited. A “unit trust” is like a regular mutual fund, but is sold by offering memorandum rather than prospectus. This is cheaper, but means subscription is restricted to “accredited investors” (as defined by the Ontario Securities Commission). Fund past performances are not a guarantee of future performance. You can lose money investing in MAPF or any other fund.

A similar portfolio composition analysis has been performed on the Claymore Preferred Share ETF (symbol CPD) (and other funds) as of July 31, 2017, and published in the August, 2017, PrefLetter. It is fair to say:

  • MAPF credit quality is much better
  • MAPF liquidity is lower
  • MAPF Yield is higher
  • Weightings
    • MAPF has similar exposure to Straight Perpetuals
      • Much more exposed to PerpetualDiscounts
      • Much less exposed to DeemedRetractibles
      • A little less exposed to PerpetualPremiums
    • Neither portfolio is exposed to Operating Retractibles (there aren’t too many of those any more!)
    • MAPF is more exposed to SplitShares
    • MAPF is a little less exposed to FixFloat / Floater / Ratchet
    • MAPF is a little higher weighted in FixedResets, but has a greater emphasis on lower-spread issues
MAPF

MAPF Performance : September, 2017

Malachite Aggressive Preferred Fund’s Net Asset Value per Unit as of the close September 29, 2017, was $9.7129 after a dividend distribution of 0.084875.

Returns to September 29, 2017
Period MAPF BMO-CM “50” Preferred Share Index TXPR*
Total Return
CPD – according to Blackrock
One Month +0.99% +1.73% +1.36% N/A
Three Months +2.80% +2.34% +1.73% N/A
One Year +25.44% +19.43% +16.46% +16.16%
Two Years (annualized) +16.90% +14.12% +12.43% N/A
Three Years (annualized) +2.46% +1.75% +0.52% +0.19%
Four Years (annualized) +4.21% +2.34% +1.74% N/A
Five Years (annualized) +3.11% +1.97% +1.19% +0.80%
Six Years (annualized) +4.65% +2.71% +2.06% N/A
Seven Years (annualized) +4.38% +3.44% +2.51% N/A
Eight Years (annualized) +5.71% +4.23% +3.30% N/A
Nine Years (annualized) +10.83% +4.88% +3.92% N/A
Ten Years (annualized) +9.29% +3.66% +2.66% +2.15%
Eleven Years (annualized) +8.52% +3.13%    
Twelve Years (annualized) +8.31% +3.21%    
Thirteen Years (annualized) +8.21% +3.36%    
Fourteen Years (annualized) +8.72% +3.48%    
Fifteen Years (annualized) +10.13% +3.72%    
Sixteen Years (annualized) +9.13% +3.70%    
MAPF returns assume reinvestment of distributions, and are shown after expenses but before fees.
The full name of the BMO-CM “50” index is the BMO Capital Markets “50” Preferred Share Index. It is calculated without accounting for fees.
“TXPR” is the S&P/TSX Preferred Share Index. It is calculated without accounting for fees.
CPD Returns are for the NAV and are after all fees and expenses.
Figures for National Bank Preferred Equity Income Fund (formerly Omega Preferred Equity) (which are after all fees and expenses) for 1-, 3- and 12-months are +1.23%, +1.39% and +14.76%, respectively, according to Morningstar after all fees & expenses. Three year performance is +1.65%; five year is +2.14%
Figures for Manulife Preferred Income Class Adv [into which was merged Manulife Preferred Income Fund (formerly AIC Preferred Income Fund)] (which are after all fees and expenses) for 1-, 3- and 12-months are +1.87%, +2.43% & +19.69%, respectively.

It will be noted that AIC Preferred Income Fund was in existence prior to August, 2009, but long term performance figures have been suppressed.

Figures for Horizons Active Preferred Share ETF (HPR) (which are after all fees and expenses) for 1-, 3- and 12-months are +1.83%, +2.38% & +18.69%, respectively. Three year performance is +2.54%, five-year is +2.70%
Figures for National Bank Preferred Equity Fund (formerly Altamira Preferred Equity Fund) are +1.80%, +2.14% and +18.39% for one-, three- and twelve months, respectively. Three year performance is +1.54%.

According to the fund’s fact sheet as of June 30, 2016, the fund’s inception date was October 30, 2015. I do not know how they justify this nonsensical statement, but will assume that prior performance is being suppressed in some perfectly legal manner that somebody at National considers ethical.

The figures for the NAV of BMO S&P/TSX Laddered Preferred Share Index ETF (ZPR) is +21.44% for the past twelve months. Two year performance is +13.64%, three year is -1.78%.
Figures for Natixis Canadian Preferred Share Class (formerly NexGen Canadian Preferred Share Tax Managed Fund) are -%, +% and -% for one-, three- and twelve-months, respectively.
Figures for BMO Preferred Share Fund are +1.10% and +12.64% for the past three- and twelve-months, respectively. Three year performance is -0.37%.
Figures for PowerShares Canadian Preferred Share Index Class, Series F are +20.76% for the past twelve months. The three-year figure is +2.00%; five years is +1.32%
Figures for the First Asset Preferred Share Investment Trust (PSF.UN) are no longer available since the fund has merged with First Asset Preferred Share ETF (FPR)

MAPF returns assume reinvestment of dividends, and are shown after expenses but before fees. Past performance is not a guarantee of future performance. You can lose money investing in Malachite Aggressive Preferred Fund or any other fund. For more information, see the fund’s main page. The fund is available either directly from Hymas Investment Management or through a brokerage account at Odlum Brown Limited.

Obviously, the last twelve months have been superb for both preferred shares in general and the fund in particular, but I think that there is still room for outsized gains. The Seniority Spread (the interest-equivalent yield on reasonably liquid, investment-grade PerpetualDiscounts less the yield on long term corporate bonds) is still quite elevated (chart end-date 2017-9-8):

pl_170908_body_chart_1
Click for Big

… and the relationship between five-year Canada yields and yields on investment-grade FixedResets is also well within what I consider ‘decoupled panic’ territory (chart end-date 2017-8-11):

pl_170908_body_chart_5
Click for Big

In addition, I feel that the yield on five-year Canadas is unsustainably low (it should be the inflation rate plus an increment of … 1%? 1.5%? 2.0%?),and a return to sustainable levels is likely over the medium term.

FixedReset performance on the month was +1.50% vs. PerpetualDiscounts of -0.71% in September, and have strongly outperformed over the past three months:

himi_indexperf_170929
Click for Big

Of course, it’s one thing to say that ‘spreads are unsustainable and so are government yields’ and it’s quite another to forecast just how and when a more economically sustainable environment will take effect. It could be years. There could be a reversal, particularly if Trump’s international trade policies cause a severe recession or even a depression. And, of course, I could be just plain wrong about the sustainability of the current environment.

The Bank of Canada’s policy hike in September undoubtedly had a positive effect on government yields and hence FixedReset expected yields and current returns, but since then expectations of more quick hikes have dampened and an insipid start to the third quarter’s measured economic growth, so as usual the crystal ball for the short term is malfunctioning!

I think that a broad, sustainable rally in FixedResets will require higher five-year Canada yields (or a widespread expectation of them) … and although I’m sure this will happen eventually, it would be foolish to speculate on just when it will happen!

Calculation of MAPF Sustainable Income Per Unit
Month NAVPU Portfolio
Average
YTW
Leverage
Divisor
Securities
Average
YTW
Capital
Gains
Multiplier
Sustainable
Income
per
current
Unit
June, 2007 9.3114 5.16% 1.03 5.01% 1.3240 0.3524
September 9.1489 5.35% 0.98 5.46% 1.3240 0.3773
December, 2007 9.0070 5.53% 0.942 5.87% 1.3240 0.3993
March, 2008 8.8512 6.17% 1.047 5.89% 1.3240 0.3938
June 8.3419 6.034% 0.952 6.338% 1.3240 $0.3993
September 8.1886 7.108% 0.969 7.335% 1.3240 $0.4537
December, 2008 8.0464 9.24% 1.008 9.166% 1.3240 $0.5571
March 2009 $8.8317 8.60% 0.995 8.802% 1.3240 $0.5872
June 10.9846 7.05% 0.999 7.057% 1.3240 $0.5855
September 12.3462 6.03% 0.998 6.042% 1.3240 $0.5634
December 2009 10.5662 5.74% 0.981 5.851% 1.1141 $0.5549
March 2010 10.2497 6.03% 0.992 6.079% 1.1141 $0.5593
June 10.5770 5.96% 0.996 5.984% 1.1141 $0.5681
September 11.3901 5.43% 0.980 5.540% 1.1141 $0.5664
December 2010 10.7659 5.37% 0.993 5.408% 1.0298 $0.5654
March, 2011 11.0560 6.00% 0.994 5.964% 1.0298 $0.6403
June 11.1194 5.87% 1.018 5.976% 1.0298 $0.6453
September 10.2709 6.10%
Note
1.001 6.106% 1.0298 $0.6090
December, 2011 10.0793 5.63%
Note
1.031 5.805% 1.0000 $0.5851
March, 2012 10.3944 5.13%
Note
0.996 5.109% 1.0000 $0.5310
June 10.2151 5.32%
Note
1.012 5.384% 1.0000 $0.5500
September 10.6703 4.61%
Note
0.997 4.624% 1.0000 $0.4934
December, 2012 10.8307 4.24% 0.989 4.287% 1.0000 $0.4643
March, 2013 10.9033 3.87% 0.996 3.886% 1.0000 $0.4237
June 10.3261 4.81% 0.998 4.80% 1.0000 $0.4957
September 10.0296 5.62% 0.996 5.643% 1.0000 $0.5660
December, 2013 9.8717 6.02% 1.008 5.972% 1.0000 $0.5895
March, 2014 10.2233 5.55% 0.998 5.561% 1.0000 $0.5685
June 10.5877 5.09% 0.998 5.100% 1.0000 $0.5395
September 10.4601 5.28% 0.997 5.296% 1.0000 $0.5540
December, 2014 10.5701 4.83% 1.009 4.787% 1.0000 $0.5060
March, 2015 9.9573 4.99% 1.001 4.985% 1.0000 $0.4964
June, 2015 9.4181 5.55% 1.002 5.539% 1.0000 $0.5217
September, 2015 7.8140 6.98% 0.999 6.987% 1.0000 $0.5460
December, 2015 8.1379 6.85% 0.997 6.871% 1.0000 $0.5592
March, 2016 7.4416 7.79% 0.998 7.805% 1.0000 $0.5808
June 7.6704 7.67% 1.011 7.587% 1.0000 $0.5819
September 8.0590 7.35% 0.993 7.402% 1.0000 $0.5965
December, 2016 8.5844 7.24% 0.990 7.313% 1.0000 $0.6278
March, 2017 9.3984 6.26% 0.994 6.298% 1.0000 $0.5919
June 9.5313 6.41% 0.998 6.423% 1.0000 $0.6122
September, 2017 9.7129 6.56% 0.998 6.573% 1.0000 $0.6384
NAVPU is shown after quarterly distributions of dividend income and annual distribution of capital gains.
Portfolio YTW includes cash (or margin borrowing), with an assumed interest rate of 0.00%
The Leverage Divisor indicates the level of cash in the account: if the portfolio is 1% in cash, the Leverage Divisor will be 0.99
Securities YTW divides “Portfolio YTW” by the “Leverage Divisor” to show the average YTW on the securities held; this assumes that the cash is invested in (or raised from) all securities held, in proportion to their holdings.
The Capital Gains Multiplier adjusts for the effects of Capital Gains Dividends. On 2009-12-31, there was a capital gains distribution of $1.989262 which is assumed for this purpose to have been reinvested at the final price of $10.5662. Thus, a holder of one unit pre-distribution would have held 1.1883 units post-distribution; the CG Multiplier reflects this to make the time-series comparable. Note that Dividend Distributions are not assumed to be reinvested.
Sustainable Income is the resultant estimate of the fund’s dividend income per current unit, before fees and expenses. Note that a “current unit” includes reinvestment of prior capital gains; a unitholder would have had the calculated sustainable income with only, say, 0.9 units in the past which, with reinvestment of capital gains, would become 1.0 current units.
DeemedRetractibles are comprised of all Straight Perpetuals (both PerpetualDiscount and PerpetualPremium) issued by BMO, BNS, CM, ELF, GWO, HSB, IAG, MFC, NA, RY, SLF and TD, which are not exchangable into common at the option of the company (definition refined in May, 2011). These issues are analyzed as if their prospectuses included a requirement to redeem at par on or prior to 2022-1-31 (banks) or 2025-1-31 (insurers and insurance holding companies), in addition to the call schedule explicitly defined. See OSFI Does Not Grandfather Extant Tier 1 Capital, CM.PR.D, CM.PR.E, CM.PR.G: Seeking NVCC Status and the January, February, March and June, 2011, editions of PrefLetter for the rationale behind this analysis.

The same reasoning is also applied to FixedResets from these issuers, other than explicitly defined NVCC from banks.

Yields for September, 2011, to January, 2012, were calculated by imposing a cap of 10% on the yields of YLO issues held, in order to avoid their extremely high calculated yields distorting the calculation and to reflect the uncertainty in the marketplace that these yields will be realized. From February to September 2012, yields on these issues have been set to zero. All YLO issues held were sold in October 2012.

These calculations were performed assuming constant contemporary GOC-5 and 3-Month Bill rates, as follows:

Canada Yields Assumed in Calculations
Month-end GOC-5 3-Month Bill
September, 2015 0.78% 0.40%
December, 2015 0.71% 0.46%
March, 2016 0.70% 0.44%
June 0.57% 0.47%
September 0.58% 0.53%
December, 2016 1.16% 0.47%
March, 2017 1.08% 0.55%
June 1.35% 0.69%
September, 2017 1.79% 0.97%

Significant positions were held in NVCC non-compliant regulated FixedReset issues on August 31, 2017; all of these currently have their yields calculated with the presumption that they will be called by the issuers at par prior to 2022-1-31 (banks) or 2025-1-31 (insurers and insurance holding companies) or on a different date (SplitShares) This presents another complication in the calculation of sustainable yield, which also assumes that redemption proceeds will be reinvested at the same rate. It will also be noted that my analysis of likely insurance industry regulation as recently updated is not given much weight by the market.

I will also note that the sustainable yield calculated above is not directly comparable with any yield calculation currently reported by any other preferred share fund as far as I am aware. The Sustainable Yield depends on:
i) Calculating Yield-to-Worst for each instrument and using this yield for reporting purposes;
ii) Using the contemporary value of Five-Year Canadas to estimate dividends after reset for FixedResets. The assumption regarding the five-year Canada rate has become more important as the proportion of low-spread FixedResets in the portfolio has increased.
iii) Making the assumption that deeply discounted NVCC non-compliant issues from both banks and insurers, both Straight and FixedResets will be redeemed at par on their DeemedMaturity date as discussed above.

Issue Comments

NA.PR.Q To Be Redeemed

National Bank of Canada has announced:

its intention to redeem all of its remaining issued and outstanding Non-Cumulative 5-Year Rate Reset First Preferred Shares Series 28 (the “Preferred Shares Series 28”) on November 15, 2017 (the “Redemption Date”).

Pursuant to the share conditions, on the Redemption Date, the Bank may, at its option, redeem the Preferred Shares Series 28 at a price equal to $25.00 per share together with all declared and unpaid dividends. The declared dividends payable on November 15, 2017 will be paid to shareholders of record on October 10, 2017.

Formal notice will be issued to shareholders in accordance with the share conditions. The redemption of the Preferred Shares Series 28 is subject to the approval of the Office of the Superintendent of Financial Institutions and is part of the Bank’s ongoing management of its regulatory capital.

The Bank recommends shareholders consult with their tax advisors to determine the appropriate treatment and impact of the redemption.

NA.PR.Q is a FixedReset, 3.80%+243, that commenced trading 2012-11-7 after being announced 2012-10-30. It has been tracked by HIMIPref™ and assigned to the FixedReset subindex.

Issue Comments

S&P Assigns “Outlook Negative” to BEP & BRF

Standard & Poor’s has announced:

  • •We are revising our outlook on Brookfield Renewable Partners L.P. (BEP) to negative from stable, reflecting limited cushion in the credit metrics should the recovery we are expecting in hydrology and generation across BEP’s footprint fail to materialize.
  • •We believe droughts, El Nino, and low hydrology have affected BEP’s portfolio over the past couple of years, resulting in generation below long-term averages (LTA) that is offsetting the portfolio’s geographic diversity.
  • •We are affirming our ratings on BEP, including our ‘BBB+’ long-term corporate credit rating.


The outlook revision reflects what we view as limited cushion in the credit metrics should the recovery we are expecting to see in hydrology and generation across BEP’s footprint fail to materialize. Metrics have been lower in the past two years because of lower distributions received from owned assets. During this period, generation has been lower than long-term averages mainly due to low hydrology in North America and Brazil, and drought in Colombia due to the El Nino effect in first-half 2016. Even though minimal, the appreciation of the U.S. dollar during this time has also not helped.

The negative outlook reflects S&P Global Ratings’ view that there is limited cushion in the credit metrics should the recovery expected in hydrology and generation across BEP’s footprint fail to materialize. We still expect BEP to maintain a well-diversified portfolio of generation assets, operate under long-term contracts with investment-grade counterparties, and generate fairly predictable cash flows to support its holding-company debt obligations. We expect base-case FFO-to-debt in the 20%-25% range and debt-to-EBITDA of 3.5x-4.5x during our two-year outlook period. We also expect BEP to remain moderately strategic to parent BAM as per our group rating assessment.

We could lower the rating if FFO-to-debt consistently falls below 23% or if the QD score deteriorates during the outlook period. This could result distributions lower than currently forecast as a result of generation below LTA or from acquisitions or capital expenditures financed with substantially higher levels of holding-company debt or acquisition of higher risk merchant assets or a material change in the contractual profile of the operating assets. Given the group support, a negative rating action on the parent would flow through to BEP. In addition, a revision in our assessment of the group status to nonstrategic could result in a downgrade, though this appears less likely.

We could revise the outlook back to stable if the company maintains forward-looking credit metrics at the higher end of the significant. This could result from lower resource variability, generation in line with LTA, increased cash flow, significant deleveraging, and acquisitions financed with lower levels of holding-company debt, all resulting in FFO-to-debt of 25%-30% and debt-to-EBITDA of 3.0x-3.5x.

Affected issues are:

BRF.PR.A, BRF.PR.B, BRF.PR.C, BRF.PR.E and BRF.PR.F (These are from Brookfield Renewable Power Preferred Equity Inc., a wholly owned subsidiary of BEP, and pay eligible dividends)

BEP.PR.E, BEP.PR.G, BEP.PR.I and BEP.PR.K (These are from Brookfield Renewable Partners L.P. itself, and pay distributions comprised of return of capital and ordinary income)

It is not too long since S&P upgraded BEP & BRF to P-2(low) (which was affirmed).

Issue Comments

FTN.PR.A Dividend Rate Raised 25bp for One Year<

Quadravest has announced:

Financial 15 Split Corp. (the “Company”) is pleased to announce the Preferred Share dividend rate for the fiscal year beginning December 1, 2017. Monthly payments to FTN.PR.A will be $0.04583 per share for an annual yield of 5.50% on their $10 redemption value. This is an increase of one quarter of one percent over the current rate.

The Company invests in an actively managed, high quality portfolio consisting of 15 financial services companies made up of Canadian and U.S. issuers as follows:

Bank of Montreal National Bank of Canada Bank of America Corp.
The Bank of Nova Scotia Manulife Financial Corporation Citigroup Inc.
Canadian Imperial Bank of Commerce Sun Life Financial Services of Canada Inc. Goldman Sachs Group Inc.
Royal Bank of Canada Great-West Lifeco Inc. JP Morgan Chase & Co.
The Toronto-Dominion Bank CI Financial Corp. Wells Fargo & Co.

This is a rather peculiar action for them to take, particularly so soon after their recent treasury offering and given that the liquidation date for the company is 2020-12-1 (which the company may extend at will, but only while giving retraction rights to shareholders). I believe we are now in the position of waiting for the other shoe to drop!

Issue Comments

FFN.PR.A Dividend Rate Raised by 25bp for One Year

Quadravest has announced:

North American Financial 15 Split Corp. (the “Company”) is pleased to announce the Preferred Share dividend rate for the fiscal year beginning December 1, 2017. Monthly payments to FFN.PR.A will be $0.04583 per share for an annual yield of 5.50% on their $10 redemption value. This is an increase of one quarter of one percent over the current rate.

The Company invests in an actively managed, high quality portfolio consisting of 15 financial services companies made up of Canadian and U.S. issuers as follows:

Bank of Montreal National Bank of Canada Bank of America Corp.
The Bank of Nova Scotia Manulife Financial Corporation Citigroup Inc.
Canadian Imperial Bank of Commerce Sun Life Financial Services of Canada Inc. Goldman Sachs Group Inc.
Royal Bank of Canada Great-West Lifeco Inc. JP Morgan Chase & Co.
The Toronto-Dominion Bank CI Financial Corp. Wells Fargo & Co.

This is a rather peculiar action for them to take, particularly given that the liquidation date for the company is 2019-12-1 (which the company may extend at will, but only while giving retraction rights to shareholders). I believe we are now in the position of waiting for the other shoe to drop!

Market Action

September 29, 2017

That’s it for another month! It turned out pretty well, with TXPR up 1.36% … with roughly half that coming in the last two days!

HIMIPref™ Preferred Indices
These values reflect the December 2008 revision of the HIMIPref™ Indices

Values are provisional and are finalized monthly
Index Mean
Current
Yield
(at bid)
Median
YTW
Median
Average
Trading
Value
Median
Mod Dur
(YTW)
Issues Day’s Perf. Index Value
Ratchet 0.00 % 0.00 % 0 0.00 0 -0.5614 % 2,397.6
FixedFloater 0.00 % 0.00 % 0 0.00 0 -0.5614 % 4,399.4
Floater 3.95 % 3.96 % 94,574 17.50 3 -0.5614 % 2,535.4
OpRet 0.00 % 0.00 % 0 0.00 0 0.0661 % 3,066.7
SplitShare 4.76 % 4.71 % 87,444 4.42 6 0.0661 % 3,662.3
Interest-Bearing 0.00 % 0.00 % 0 0.00 0 0.0661 % 2,857.5
Perpetual-Premium 5.42 % 4.84 % 57,851 5.78 16 0.1483 % 2,785.3
Perpetual-Discount 5.35 % 5.41 % 72,851 14.70 19 0.4020 % 2,907.4
FixedReset 4.33 % 4.52 % 154,789 6.13 99 0.5185 % 2,427.6
Deemed-Retractible 5.13 % 5.68 % 101,429 6.04 30 0.3361 % 2,870.5
FloatingReset 2.83 % 2.90 % 51,774 4.07 8 0.3003 % 2,659.5
Performance Highlights
Issue Index Change Notes
BAM.PF.H FixedReset 1.00 % YTW SCENARIO
Maturity Type : Call
Maturity Date : 2020-12-31
Maturity Price : 25.00
Evaluated at bid price : 26.24
Bid-YTW : 3.39 %
BAM.PF.B FixedReset 1.00 % YTW SCENARIO
Maturity Type : Limit Maturity
Maturity Date : 2047-09-29
Maturity Price : 22.75
Evaluated at bid price : 23.17
Bid-YTW : 4.75 %
BAM.PF.A FixedReset 1.00 % YTW SCENARIO
Maturity Type : Limit Maturity
Maturity Date : 2047-09-29
Maturity Price : 23.63
Evaluated at bid price : 24.16
Bid-YTW : 4.84 %
RY.PR.M FixedReset 1.02 % YTW SCENARIO
Maturity Type : Limit Maturity
Maturity Date : 2047-09-29
Maturity Price : 22.83
Evaluated at bid price : 23.75
Bid-YTW : 4.49 %
PWF.PR.K Perpetual-Discount 1.05 % YTW SCENARIO
Maturity Type : Limit Maturity
Maturity Date : 2047-09-29
Maturity Price : 22.82
Evaluated at bid price : 23.10
Bid-YTW : 5.44 %
SLF.PR.H FixedReset 1.07 % YTW SCENARIO
Maturity Type : Hard Maturity
Maturity Date : 2025-01-31
Maturity Price : 25.00
Evaluated at bid price : 20.85
Bid-YTW : 6.19 %
POW.PR.D Perpetual-Discount 1.08 % YTW SCENARIO
Maturity Type : Limit Maturity
Maturity Date : 2047-09-29
Maturity Price : 23.20
Evaluated at bid price : 23.50
Bid-YTW : 5.32 %
HSE.PR.C FixedReset 1.09 % YTW SCENARIO
Maturity Type : Limit Maturity
Maturity Date : 2047-09-29
Maturity Price : 23.20
Evaluated at bid price : 24.20
Bid-YTW : 4.99 %
BMO.PR.T FixedReset 1.09 % YTW SCENARIO
Maturity Type : Limit Maturity
Maturity Date : 2047-09-29
Maturity Price : 21.82
Evaluated at bid price : 22.33
Bid-YTW : 4.51 %
BAM.PR.T FixedReset 1.13 % YTW SCENARIO
Maturity Type : Limit Maturity
Maturity Date : 2047-09-29
Maturity Price : 20.55
Evaluated at bid price : 20.55
Bid-YTW : 4.82 %
CM.PR.Q FixedReset 1.14 % YTW SCENARIO
Maturity Type : Limit Maturity
Maturity Date : 2047-09-29
Maturity Price : 22.99
Evaluated at bid price : 23.99
Bid-YTW : 4.55 %
MFC.PR.C Deemed-Retractible 1.17 % YTW SCENARIO
Maturity Type : Hard Maturity
Maturity Date : 2025-01-31
Maturity Price : 25.00
Evaluated at bid price : 21.65
Bid-YTW : 6.92 %
TD.PF.D FixedReset 1.20 % YTW SCENARIO
Maturity Type : Limit Maturity
Maturity Date : 2047-09-29
Maturity Price : 23.18
Evaluated at bid price : 24.40
Bid-YTW : 4.52 %
GWO.PR.H Deemed-Retractible 1.24 % YTW SCENARIO
Maturity Type : Hard Maturity
Maturity Date : 2025-01-31
Maturity Price : 25.00
Evaluated at bid price : 22.88
Bid-YTW : 6.35 %
TD.PF.B FixedReset 1.26 % YTW SCENARIO
Maturity Type : Limit Maturity
Maturity Date : 2047-09-29
Maturity Price : 22.17
Evaluated at bid price : 22.48
Bid-YTW : 4.53 %
BAM.PR.X FixedReset 1.38 % YTW SCENARIO
Maturity Type : Limit Maturity
Maturity Date : 2047-09-29
Maturity Price : 17.57
Evaluated at bid price : 17.57
Bid-YTW : 4.82 %
BAM.PR.R FixedReset 1.41 % YTW SCENARIO
Maturity Type : Limit Maturity
Maturity Date : 2047-09-29
Maturity Price : 20.20
Evaluated at bid price : 20.20
Bid-YTW : 4.82 %
MFC.PR.B Deemed-Retractible 1.73 % YTW SCENARIO
Maturity Type : Hard Maturity
Maturity Date : 2025-01-31
Maturity Price : 25.00
Evaluated at bid price : 22.38
Bid-YTW : 6.53 %
BNS.PR.Z FixedReset 1.86 % YTW SCENARIO
Maturity Type : Hard Maturity
Maturity Date : 2022-01-31
Maturity Price : 25.00
Evaluated at bid price : 22.98
Bid-YTW : 4.46 %
TRP.PR.D FixedReset 1.96 % YTW SCENARIO
Maturity Type : Limit Maturity
Maturity Date : 2047-09-29
Maturity Price : 21.65
Evaluated at bid price : 22.08
Bid-YTW : 4.68 %
Volume Highlights
Issue Index Shares
Traded
Notes
BNS.PR.Z FixedReset 210,100 YTW SCENARIO
Maturity Type : Hard Maturity
Maturity Date : 2022-01-31
Maturity Price : 25.00
Evaluated at bid price : 22.98
Bid-YTW : 4.46 %
TRP.PR.K FixedReset 124,187 YTW SCENARIO
Maturity Type : Call
Maturity Date : 2022-05-31
Maturity Price : 25.00
Evaluated at bid price : 25.95
Bid-YTW : 4.12 %
CM.PR.R FixedReset 120,488 YTW SCENARIO
Maturity Type : Call
Maturity Date : 2022-07-31
Maturity Price : 25.00
Evaluated at bid price : 25.13
Bid-YTW : 4.22 %
RY.PR.Q FixedReset 119,250 YTW SCENARIO
Maturity Type : Call
Maturity Date : 2021-05-24
Maturity Price : 25.00
Evaluated at bid price : 26.78
Bid-YTW : 3.58 %
BMO.PR.B FixedReset 111,500 YTW SCENARIO
Maturity Type : Call
Maturity Date : 2022-02-25
Maturity Price : 25.00
Evaluated at bid price : 26.26
Bid-YTW : 3.73 %
BMO.PR.R FloatingReset 109,765 YTW SCENARIO
Maturity Type : Hard Maturity
Maturity Date : 2022-01-31
Maturity Price : 25.00
Evaluated at bid price : 24.52
Bid-YTW : 3.06 %
There were 37 other index-included issues trading in excess of 10,000 shares.
Wide Spread Highlights
Issue Index Quote Data and Yield Notes
HSE.PR.C FixedReset Quote: 24.20 – 25.00
Spot Rate : 0.8000
Average : 0.5034

YTW SCENARIO
Maturity Type : Limit Maturity
Maturity Date : 2047-09-29
Maturity Price : 23.20
Evaluated at bid price : 24.20
Bid-YTW : 4.99 %

TD.PF.B FixedReset Quote: 22.48 – 23.00
Spot Rate : 0.5200
Average : 0.3323

YTW SCENARIO
Maturity Type : Limit Maturity
Maturity Date : 2047-09-29
Maturity Price : 22.17
Evaluated at bid price : 22.48
Bid-YTW : 4.53 %

SLF.PR.A Deemed-Retractible Quote: 22.40 – 22.80
Spot Rate : 0.4000
Average : 0.2724

YTW SCENARIO
Maturity Type : Hard Maturity
Maturity Date : 2025-01-31
Maturity Price : 25.00
Evaluated at bid price : 22.40
Bid-YTW : 6.60 %

BIP.PR.C FixedReset Quote: 25.76 – 26.10
Spot Rate : 0.3400
Average : 0.2226

YTW SCENARIO
Maturity Type : Call
Maturity Date : 2021-09-30
Maturity Price : 25.00
Evaluated at bid price : 25.76
Bid-YTW : 4.54 %

GWO.PR.N FixedReset Quote: 17.12 – 17.55
Spot Rate : 0.4300
Average : 0.3321

YTW SCENARIO
Maturity Type : Hard Maturity
Maturity Date : 2025-01-31
Maturity Price : 25.00
Evaluated at bid price : 17.12
Bid-YTW : 8.49 %

CM.PR.P FixedReset Quote: 22.00 – 22.25
Spot Rate : 0.2500
Average : 0.1603

YTW SCENARIO
Maturity Type : Limit Maturity
Maturity Date : 2047-09-29
Maturity Price : 21.59
Evaluated at bid price : 22.00
Bid-YTW : 4.51 %

Issue Comments

NA.PR.Q To Be Redeemed

National Bank of Canada has announced:

its intention to redeem all of its remaining issued and outstanding Non-Cumulative 5-Year Rate Reset First Preferred Shares Series 28 (the “Preferred Shares Series 28”) on November 15, 2017 (the “Redemption Date”).

Pursuant to the share conditions, on the Redemption Date, the Bank may, at its option, redeem the Preferred Shares Series 28 at a price equal to $25.00 per share together with all declared and unpaid dividends. The declared dividends payable on November 15, 2017 will be paid to shareholders of record on October 10, 2017.

Formal notice will be issued to shareholders in accordance with the share conditions. The redemption of the Preferred Shares Series 28 is subject to the approval of the Office of the Superintendent of Financial Institutions and is part of the Bank’s ongoing management of its regulatory capital.

The Bank recommends shareholders consult with their tax advisors to determine the appropriate treatment and impact of the redemption.

NA.PR.Q is a FixedReset, 3.80%+243, that commenced trading 2012-11-7 after being announced 2012-10-30. It has been tracked by HIMIPref™ and assigned to the FixedReset subindex.

Issue Comments

S&P Assigns “Outlook Negative” to BEP & BRF

Standard & Poor’s has announced:

  • •We are revising our outlook on Brookfield Renewable Partners L.P. (BEP) to negative from stable, reflecting limited cushion in the credit metrics should the recovery we are expecting in hydrology and generation across BEP’s footprint fail to materialize.
  • •We believe droughts, El Nino, and low hydrology have affected BEP’s portfolio over the past couple of years, resulting in generation below long-term averages (LTA) that is offsetting the portfolio’s geographic diversity.
  • •We are affirming our ratings on BEP, including our ‘BBB+’ long-term corporate credit rating.


The outlook revision reflects what we view as limited cushion in the credit metrics should the recovery we are expecting to see in hydrology and generation across BEP’s footprint fail to materialize. Metrics have been lower in the past two years because of lower distributions received from owned assets. During this period, generation has been lower than long-term averages mainly due to low hydrology in North America and Brazil, and drought in Colombia due to the El Nino effect in first-half 2016. Even though minimal, the appreciation of the U.S. dollar during this time has also not helped.

The negative outlook reflects S&P Global Ratings’ view that there is limited cushion in the credit metrics should the recovery expected in hydrology and generation across BEP’s footprint fail to materialize. We still expect BEP to maintain a well-diversified portfolio of generation assets, operate under long-term contracts with investment-grade counterparties, and generate fairly predictable cash flows to support its holding-company debt obligations. We expect base-case FFO-to-debt in the 20%-25% range and debt-to-EBITDA of 3.5x-4.5x during our two-year outlook period. We also expect BEP to remain moderately strategic to parent BAM as per our group rating assessment.

We could lower the rating if FFO-to-debt consistently falls below 23% or if the QD score deteriorates during the outlook period. This could result distributions lower than currently forecast as a result of generation below LTA or from acquisitions or capital expenditures financed with substantially higher levels of holding-company debt or acquisition of higher risk merchant assets or a material change in the contractual profile of the operating assets. Given the group support, a negative rating action on the parent would flow through to BEP. In addition, a revision in our assessment of the group status to nonstrategic could result in a downgrade, though this appears less likely.

We could revise the outlook back to stable if the company maintains forward-looking credit metrics at the higher end of the significant. This could result from lower resource variability, generation in line with LTA, increased cash flow, significant deleveraging, and acquisitions financed with lower levels of holding-company debt, all resulting in FFO-to-debt of 25%-30% and debt-to-EBITDA of 3.0x-3.5x.

Affected issues are:

BRF.PR.A, BRF.PR.B, BRF.PR.C, BRF.PR.E and BRF.PR.F (These are from Brookfield Renewable Power Preferred Equity Inc., a wholly owned subsidiary of BEP, and pay eligible dividends)

BEP.PR.E, BEP.PR.G, BEP.PR.I and BEP.PR.K (These are from Brookfield Renewable Partners L.P. itself, and pay distributions comprised of return of capital and ordinary income)

It is not too long since S&P upgraded BEP & BRF to P-2(low) (which was affirmed).

Issue Comments

FFN.PR.A Dividend Rate Raised by 25bp for One Year

Quadravest has announced:

North American Financial 15 Split Corp. (the “Company”) is pleased to announce the Preferred Share dividend rate for the fiscal year beginning December 1, 2017. Monthly payments to FFN.PR.A will be $0.04583 per share for an annual yield of 5.50% on their $10 redemption value. This is an increase of one quarter of one percent over the current rate.

The Company invests in an actively managed, high quality portfolio consisting of 15 financial services companies made up of Canadian and U.S. issuers as follows:

Bank of Montreal National Bank of Canada Bank of America Corp.
The Bank of Nova Scotia Manulife Financial Corporation Citigroup Inc.
Canadian Imperial Bank of Commerce Sun Life Financial Services of Canada Inc. Goldman Sachs Group Inc.
Royal Bank of Canada Great-West Lifeco Inc. JP Morgan Chase & Co.
The Toronto-Dominion Bank CI Financial Corp. Wells Fargo & Co.

This is a rather peculiar action for them to take, particularly given that the liquidation date for the company is 2019-12-1 (which the company may extend at will, but only while giving retraction rights to shareholders). I believe we are now in the position of waiting for the other shoe to drop!