Archive for September, 2009

Australian Convertible Floating Prefs

Tuesday, September 29th, 2009

In a comment on the post about HM Treasury’s musings on mandatorially convertible prefs, Assiduous Reader patc provided an introduction to what seems to be the wonderful world of Australian Hybrids.

Further investigation uncovered a Morningstar / “Huntleys’ Your Money Weekly” analytical report titled ASX Listed Hybrids:

These securities pay a regular distribution or dividend. The calculation for most instruments is similar. Start with the 90 or 180 Day Bank Bill Swap Rate (see graph below), which is the rate at which major financial institutions commonly lend money to each other. This rate often sits a little bit above the Reserve Bank cash rate, so now for instance the 90 day rate is sitting at 3.25%, above the cash rate at 3%. To this you add a margin, which differs from security to security. For instance the ANZ offering, with ASX Code ANZPB, has a margin of 2.5%, CBAPB has a margin of 1.05%, WBCPB has a margin of 3.8%.

The distribution may be franked and the numbers we quote include the franking credit where applicable.

Many bank hybrids have Mandatory Converting Conditions. There are offerings of this variety from Westpac, ANZ and CBA, as well as Macquarie and Suncorp. At the end of the term, around the Mandatory Conversion Date there are tests against the share price of the underlying security. For instance ANZPB is tested against the share price of ANZ. If the volume weighted average share price (VWAP) of the institution is above some threshold just prior to the Mandatory Conversion Date then the issuer must convert the hybrid securities into a variable number of ordinary shares – the value of the shares will be the face value of the hybrid plus a small conversion discount, typically 1%–2.5%. Often there’s a test that the price on the 25th business day before the mandatory conversion date is at least above 55–60% of the issue date VWAP, and then that the VWAP for the 20 business days prior to the conversion date is above 50–52% of the issue date VWAP.

Note that I have no idea what “franking” means!

The potential for a significant market in this asset class in Canada was discussed when the market was just about at its bottom in December 2008 in the post Convertible Preferreds? In Canada?.

Sadly, these preferreds approach mandatory conversion from the wrong direction: mandatory conversion occurs when the price of the common is above some level, rather than below, which – from the point of view of market stability – is undesirable. Ideally, the fixed charges inherent in debt-like instruments will be eliminated when the company’s in trouble – by conversion to common – but in this case the implication is that the fixed charges will remain in such a case, and be eliminated if the company does well (or, at least, treads water).

Note that these Australian instruments bear a distinct resemblance to Canadian OperatingRetractibles, the major differences being:

  • the discount on the common is 1% – 2.5% for these Australian issues, vs. a standard 5% discount for the Canadian issues
  • the existence of a minimum price on the common for the “retraction privilege” to be effective in Australia, vs. no minimum in Canada (presumably, this minimum is the reason the issues may be included in Tier 1 Capital)

September 28, 2009

Monday, September 28th, 2009

Accrued Interest worries that Fed purchases are distorting the Agency MBS market:

Obviously the Fed wants to buy the current coupon because that’s the one that influences current borrowing rates. But as a consequence, the Fed has become the overwhelming owner of the 4% and 4.5% coupons: 90% of the former and 80% of the later.

And you have to expect the majority of the widening to hit low coupons, because that’s what Vanguard/the Fed will either be selling or what they will stop buying. At that point mortgage rates will rise, not in a disastrous fashion, but probably at least 50bps. Then what? The borrower within a 4.5% pool will be way out of the money, which will not only prevent any kind of refinancing from ever happening, but also impair his/her mobility. In other words, those MBS will repay extremely slowly for investors.

Andreas Hackethal, Michalis Haliassos and Tullio Jappelli write a piece for VoxEU that is sure to make it into the bibliography of countless DIY-Investing websites: Do financial advisors improve portfolio performance?:

Do financial advisors aid their clients in making wise investments? This column shows that investors who delegate their portfolio management achieve better results. But that’s due to the fact that advisors tend to be matched with richer, older investors. In fact, financial advisors tend to lower returns and raise risk relative to clients who manage their own investment.

The budding literature on financial advice and its regulation is usually based on the premise that advisors know what is good for individual customers but have an incentive to misrepresent this and take advantage of their typically uninformed customers. In recent research (Hacketal, Haliasso, and Jappelli, 2009), we ask:

  • •How do brokerage accounts run by individuals without financial advisors actually perform compared to accounts run by (or in consultation with) financial advisors?
  • •Are financial advisors are indeed matched with poorer, uninformed investors or with richer, experienced but presumably busy investors?
  • •Is the contribution of financial advisors to the accounts that they do run actually positive relative to what investors with the characteristics of their clients tend to obtain on their own?


Our econometric analysis suggests that advisors tend to be matched with richer, older investors rather than with poorer, younger ones. Taking account of this sample selection bias yields the opposite result. Once we control for different characteristics of investors using financial advisors, we discover that advisors actually tend to lower returns, raise portfolio risk, increase the probabilities of losses, and increase trading frequency and portfolio turnover relative to what account owners of given characteristics tend to achieve on their own.

One interpretation could be that advisors overcharge for their services. If they do, should they be regulated? Or should we be content with the idea that they do not tend to serve those lacking sophistication but those lacking time to make money on the market? But then, why do rich, older people pay so much for advice? Could part of it arise because these individuals would not have undertaken the investment themselves if it were not for the help of advisors?

The problem – and the worthy target of research – is that most financial advisors (whether registered with the regulatory authorities as such or not) are not, in fact, financial advisors. They are salesmen. Regulators should insist that, at a minimum, those with discretionary authority over investor accounts must prepare meaningful composites – two versions, one defined by sector of investment and, importantly, the other defined by the results of a KYC form – and that these composites be supplied to the regulators, subject to possible audit by the regulators and published by the regulators as part of the normal registration reporting.

Given that most advisory relationships are effectively discretionary, consideration should be given to forcing the same disclosure for these as well … but this is somewhat murky! What if the client doesn’t take the advice? What it the advice is taylored to what a client might actually do? If a client is convinced oil will triple to year end and insist on overweighting in oil producers, all an advisor can do is recommend the relatively safe ones … whatever “safe” means!

The full paper is available from the Centre for Economic Policy Research.

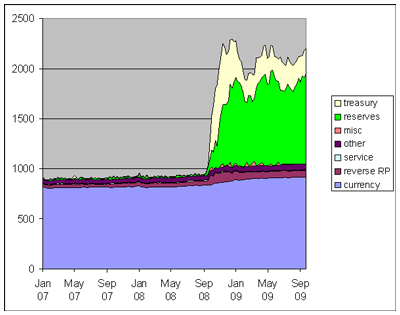
Jim Hamilton of Econbrowser discusses reports of planning for unwinding the Fed’s balance sheet and includes a chart of the Fed’s liabilities:

I mused on September 24 about the discount window and the importance of deposits in funding bank assets. In a normal bank-run scenario, short-term bank liabilities such as deposits are used to fund long-term bank assets such as mortgages and term loans. Liquidity crises come when the bank experiences difficulties rolling over its liabilities and in such a case, the theory goes, they refinance their assets at the Central Bank’s discount window instead.

In this crisis, they are selling their assets to the Fed and leaving the proceeds on deposit; in other words, instead of acting on the liability side of their balance sheet, the banks are taking action on the asset side, converting their long term assets into risk free deposits. I confess that I have not been able to draw any conclusions as yet regarding the costs, benefits and causes of this phenomenon and tied it in with the empirical evidence regarding the importance of a stable deposit base; I can only draw solace from the idea that I haven’t seen this discussed in detail anywhere else, either!

Willem Buiter of Maverecon criticizes the Obama administration:

But it is on the economic front that the damage is really piling up. President Obama’s speech yesterday (the first anniversary of the collapse of Lehman Brothers) on the lessons from Lehman’s demise demonstrated once again that we are stuck with a president who knows little about economics and cares less. There was some perfunctory populist bank and banker bashing, but nothing concrete. Like most other political leaders in the financially benighted north-Atlantic region, president Obama will use the absence of international cooperation and the undesirability of unilateral action by any one country as an excuse to avoid radical reform of the cross-border banking and financial system. No doubt the French president, Mr. Sarkozy, will again threaten his by now traditional walk-out over some trivial issue, but the chances of international agreement on measures that could reduce the frequency and severity of future systemic crises are slim.

The US officials supposed to lead the systemic reforms of the domestic and international financial system are the same people who failed to recognise the emerging disfunctionalities that produced the crisis, who indeed were responsible for creating some of these disfunctionalities, who failed to prevent the crisis, who re-fought the battle of the 1930s (and insist on taking great credit for doing so) and left us with the moral hazard nightmare legacy of the end of the first decade of the twenty first century.

There’s been another entry in the bash-the-banker sweepstakes:

Chancellor of the Exchequer Alistair Darling, targeting what he calls “greed and recklessness” in Britain’s financial system, asked banks to curtail bonuses and said the rich will pay more in tax.

“It is right that those who earn the most should shoulder the biggest burden,” the finance minister told the ruling Labour Party’s annual conference today in Brighton, England. “We will introduce legislation to end the reckless culture that puts short-term profits over long term success. It will mean an end to automatic bank bonuses year after year.”

Prime Minister Gordon Brown’s government is attempting to shore up support among voters by attacking bankers and suggesting the rich will have to foot the bill for the sharpest recession since World War II.

“This is a government on the cusp of losing the next election, and if banker-bashing is going to be popular they’ll do it,” said Simon Maughan, a banking analyst at MF Global Securities in London. “This is a classic case of knee-jerk political reaction to a crisis.”

Politics of division, politics of resentment, politics of envy … you never have to scratch the surface too deeply to find the Lord of the Flies. Mr. Darling did not, as far as I can tell, address the shortcomings of his regulatory authorities.

The Boston Fed has released a paper on social learning by Julian Jamison, David Owens, and Glenn Woroch, Social and Private Learning with Endogenous Decision Timing:

Firms often face choices about when to upgrade and what to upgrade to. We discuss this in the context of upgrading to a new technology (for example, a new computer system), but it applies equally to the upgrading of processes (for example, a new organizational structure) or to individual choices (for example, buying a new car). This paper uses an experimental approach to determine how people address such problems, with a particular focus on the impact of information flows. Specifically, subjects face a multi‐round decision, choosing when (if ever) to upgrade from the status quo to either a safe or a risky new technology. The safe technology
yields more than the status quo, and the risky technology may yield either less than the status quo or more than the safe technology. Every round, subjects who have not yet upgraded receive noisy information about the true quality of the risky technology. Our focus on the timing of endogenous choice is novel and differentiates the results from previous experimental papers on herding and cascades. We find that, in the single‐person decision problem, subjects tend to wait too long before choosing (relative to optimal behavior). In the second treatment, they observe payoff‐irrelevant choices of other subjects. This turns out to induce slightly faster decisions, so the “irrationality” of fads actually improves profits in our framework. In the third and final treatment, subjects observe payoff‐relevant choices of other subjects (that is, others who have the same value for the risky technology but independent private signals). Behavior here is very similar to the second treatment, so having “real” information does not seem to have a strong marginal effect. Overall we find that social learning, whether or not the behavior of others is truly informative, plays a large role in upgrade decisions and hence in technology diffusion.

I cheerfully admit to lack of familiarity with what the authors refer to as the “vast literature” on the “causes and patterns of the adoption and diffusion of innovations”, but it seems to me that you don’t have to squint too much to read “safe or risky new investment class” for “safe or risky new technology”.

Not much of a day for price movement in the preferred share market, with only four issues making it to the price change highlights table (three of them negative; all of them PerpetualDiscounts), while more broadly, PerpetualDiscounts were down 6bp while FixedResets lost 2bp. Volume was good though, dominated by FixedResets.

HIMIPref™ Preferred Indices
These values reflect the December 2008 revision of the HIMIPref™ Indices

Values are provisional and are finalized monthly
Index Mean
Current
Yield
(at bid)
Median
YTW
Median
Average
Trading
Value
Median
Mod Dur
(YTW)
Issues Day’s Perf. Index Value
Ratchet 0.00 % 0.00 % 0 0.00 0 0.3860 % 1,513.1
FixedFloater 5.72 % 3.97 % 52,167 18.63 1 0.5291 % 2,683.1
Floater 2.42 % 2.07 % 37,261 22.26 4 0.3860 % 1,890.4
OpRet 4.86 % -8.78 % 126,936 0.09 15 0.2458 % 2,289.8
SplitShare 6.38 % 6.58 % 832,979 4.01 2 0.0000 % 2,073.1
Interest-Bearing 0.00 % 0.00 % 0 0.00 0 0.2458 % 2,093.8
Perpetual-Premium 5.79 % 5.70 % 149,748 6.11 12 -0.0794 % 1,872.4
Perpetual-Discount 5.75 % 5.82 % 202,037 14.17 59 -0.0635 % 1,793.9
FixedReset 5.49 % 4.05 % 454,436 4.04 40 -0.0230 % 2,111.7
Performance Highlights
Issue Index Change Notes
POW.PR.D Perpetual-Discount -1.75 % YTW SCENARIO
Maturity Type : Limit Maturity
Maturity Date : 2039-09-28
Maturity Price : 21.35
Evaluated at bid price : 21.35
Bid-YTW : 5.88 %
POW.PR.A Perpetual-Discount -1.14 % YTW SCENARIO
Maturity Type : Limit Maturity
Maturity Date : 2039-09-28
Maturity Price : 23.15
Evaluated at bid price : 23.41
Bid-YTW : 5.99 %
HSB.PR.C Perpetual-Discount -1.13 % YTW SCENARIO
Maturity Type : Limit Maturity
Maturity Date : 2039-09-28
Maturity Price : 21.55
Evaluated at bid price : 21.87
Bid-YTW : 5.85 %
SLF.PR.B Perpetual-Discount 1.03 % YTW SCENARIO
Maturity Type : Limit Maturity
Maturity Date : 2039-09-28
Maturity Price : 20.61
Evaluated at bid price : 20.61
Bid-YTW : 5.86 %
Volume Highlights
Issue Index Shares
Traded
Notes
CM.PR.L FixedReset 96,403 Nesbitt crossed blocks of 35,000 and 50,000 shares, both at 27.50.
YTW SCENARIO
Maturity Type : Call
Maturity Date : 2014-05-30
Maturity Price : 25.00
Evaluated at bid price : 27.50
Bid-YTW : 4.05 %
TD.PR.N OpRet 51,580 Desjardins crossed 50,000 at 26.22.
YTW SCENARIO
Maturity Type : Call
Maturity Date : 2010-05-30
Maturity Price : 25.75
Evaluated at bid price : 26.22
Bid-YTW : 2.80 %
RY.PR.X FixedReset 45,400 RBC crossed 10,000 at 27.81.
YTW SCENARIO
Maturity Type : Call
Maturity Date : 2014-09-23
Maturity Price : 25.00
Evaluated at bid price : 27.80
Bid-YTW : 3.95 %
HSB.PR.E FixedReset 44,950 RBC crossed 30,200 at 27.65.
YTW SCENARIO
Maturity Type : Call
Maturity Date : 2014-07-30
Maturity Price : 25.00
Evaluated at bid price : 27.52
Bid-YTW : 4.33 %
BAM.PR.P FixedReset 42,160 Nesbitt crossed 25,000 at 26.60.
YTW SCENARIO
Maturity Type : Call
Maturity Date : 2014-10-30
Maturity Price : 25.00
Evaluated at bid price : 26.61
Bid-YTW : 5.57 %
BNS.PR.R FixedReset 37,906 Nesbitt crossed 25,000 at 25.95.
YTW SCENARIO
Maturity Type : Call
Maturity Date : 2014-02-25
Maturity Price : 25.00
Evaluated at bid price : 25.95
Bid-YTW : 4.25 %
There were 44 other index-included issues trading in excess of 10,000 shares.

YLD.PR.A & YLD.PR.B: Semi-Annual Financial Statements

Monday, September 28th, 2009

Split Yield Corp has announced:

Split Yield Corporation (“Split Yield”) reports financial results for the six months ending July 31, 2009.

The six month period ending July 31, 2009 was one of the most tumultuous periods in financial market history. Against this backdrop, the market prices of the stocks in the portfolio mirrored this activity reaching lows in early March but recovering significantly by the end of July. The net asset value per unit (a unit consists of one Class I Preferred share, one Class II Preferred share and one Capital share) increased by $3.43 to $18.66 per unit as at July 31, 2009.

In a word, yech. As the audited financials state:

The Company has 1,213,202 Class I Preferred shares and 1,213,202 Class II Preferred shares outstanding as at July 31, 2009 with a principal repayment of $24,264,040 and $18,198,030 respective due on termination date, February 1, 2012. As at July 31, 2009 the Company had net assets equivalent to $18.66 per Class I Preferred share and nil per Class II Preferred share. This represents a deficiency as at July 31, 2009 of $1.34 per Class I Preferred share and $15.00 per Class II Preferred share for a total deficiency of $19,823,720. If this condition prevails, the Company will have insufficient assets to meet its full liability of the Preferred shares at the termination date.

How did things come to such a pass? Well … I don’t know. The chart of NAV:

… shows some numbers for cumulative performance that, when a product is taken, come to a cumulative return since inception of -4.77%, and NAV has declined a lot more than that. I can only assume that this figure reports total return on the portfolio gross of distributions, in which case the decline in NAV is due to the cumulative distributions since inception of $7.25, $10.54 and $12.52 on the capital units, YLD.PR.B and YLD.PR.A, respectively. The MER (1.95% annualized in 1H09) will also have played a role.

The company notes:

The Company’s investment manager, Quadravest Capital Management Inc., actively manages the Company’s portfolio consisting primarily of common equities in the S&P/TSX 60 and the S&P 100 Indices. In order to generate additional income above the dividend and interest income earned in the Portfolio, the Company writes covered call options. This conservative strategy is designed to enhance the income in the portfolio by enabling the Company to earn strong income in times of volatile markets while reducing the effects of market corrections. In addition, this source of income is treated as capital gains and as such receives a more favorable tax treatment relative to other sources of income.

Quick! Does anybody have total return figures handy for those indices, from April 16, 1998 to July 31, 2009?

HM Treasury Responds to Turner Report

Monday, September 28th, 2009

The Turner Report on Financial Regulation was reported on PrefBlog in March. The government has now taken some time off from its regularly scheduled banker-bashing to address the issues raised.

The response was released on July 8 with the admission:

There were many causes of the financial crisis:

  • first and foremost, failures of market discipline, in particular of corporate governance, risk management, and remuneration policies. Some banks, boards and investors did not fully understand the complexities of their own businesses;
  • second, regulators and central banks did not sufficiently take account of the excessive risks being taken on by some firms, and did not adequately understand the extent of system-wide risk; and
  • third, the failure of global regulatory standards to respond to the major changes in the financial markets, which have increased complexity and system-wide risk, or to the tendency for system-wide risks to build up during economic upswings.

… which is a lot more balanced than what they spout for the benefit of the man in the street.

The British firm Barrow, Lyde & Gilbert has prepared a precis of the government response; there are, however, two proposals in the full-length report worthy of highlighting for preferred share investors:

Box 6.C: New international ideas for improving access to funding markets

Two ideas to improve banks access to capital during downturns or crises are being aired in academic and policy circles. Both have merits although how they could be applied in practice is yet to be determined.

Capital insurance:Banks essentially face an insurance problem: when faced with a shortage of capital, rather than having to raise new capital at a high market cost it would be more efficient if banks were delivered capital at a pre-agreed (lower) price though a pre-funded insurance policy. Paying the insurance premium in an expansion would be one method of providing some cost to the expansion of credit in an upturn. However, in a systemic crisis the insurance policy would need to pay out to several banks together. In order to ensure that these obligations could always be met, the insurance would probably need to be run by the state sector.

Debt-equity conversion: When banks are forced to raise new equity capital the initial benefits are shared with the existing debt holders as they have a senior claim over equity in the event of liquidation. One solution would be to make some of the debt (perhaps the subordinated debt tranche only) convertible into equity in the event of a systemic crisis and on the authority of the financial regulator. This would immediately inject capital into the bank and reduce the need to raise any new equity capital. The holders of the debt would also have more incentive to impose market discipline on the banks.

The reference supplied for the second option is “Building an incentive-compatible safety net”, C. Calomiris, in Journal of Banking and Finance, 1999; this article is available for purchase from Science Direct and is freely available in HTML form from the American Enterprise Institute for Public Policy Research. Assuming that the AEI transcript is reliable, though, I see very little support for the idea in the Calomiris paper (Calomiris’ ideas are frequently discussed on PrefBlog, but I certainly don’t remember seeing this one).

Regardless of origin, I consider this a fine idea at bottom, although I am opposed to the idea that the triggering mechanism be a ruling by regulatory authorities. I suggest that greater certainty for investors, regulators and issuers could be achieved with little controversy if conversion were to be triggered instead by the trading price of the bank’s common.

In such a world, regulators approving a preferred share for inclusion in Tier 1 Capital would require a forced conversion at some percentage of the current common price if the volume-weighted trading price for a calendar month (quarter?) was below that conversion price. Thus, assuming the chosen percentage was 50%, if RY were to issue preferreds at $25 par value at a time when its common was trading at $50, there would be forced conversion of prefs into common on a 1:1 basis if the common traded below $25 for the required period.

This could bring about interesting arbitrage plays with options – so much the better!

One effect would be that as the common traded lower – presumably in response to Bad Things happening at the company – the preferred share would start behaving more and more like an equity itself – which is precisely what we want.

We shall see, but I hope this idea gains some traction in the halls of power.

Update: Dr. Calomiris has very kindly responded to my query:

Yes, the citation of my work is relevant to the proposal, although it takes a little explaining to see the connection. I have been advocating the use of some form of uninsured debt requirement as part of capital requirements for a long time. The conversion of hybrid idea is a new version of that, which has the advantages of my proposal and also some additional advantages that Mark Flannery and others have pointed to. I like the idea of requiring a minimal amount of “contingent capital” which would take the form of sub debt that converts into equity in adverse circumstances.

You may quote me.

IIAC Releases Securities Industry Performance Report 2Q09

Monday, September 28th, 2009

The Investment Industry Association of Canada has released its Securities Industry Performance Report, 2Q09: fixed income trading was highlighted:

Particularly strong was debt underwriting which witnessed a 54% surge in revenue from the previous quarter as narrowing spreads made debt financings more alluring for issuers. Fixed-income principal trading revenue was also robust and totaled $640 million in the second quarter, a record high, and represented a 15% increase from the prior quarter. For the first half of 2009, industry fixed income revenues (debt underwriting plus debt principal trading) total $1.5 billion and already equal the total for the whole of 2008.

Gee, I sure hope nobody gets a bonus because of this surge in gross profit! Paying for performance can lead to … er … something bad.

There’s not enough data in the report even to make a good guess at the reason for the surge in trading revenue, but it seems probable that the desks have made profits for the same reason that my fund’s returns have been so good over the past year: lots of panic, lots of volatility, lots of players who really don’t have a clue.

September 25, 2009

Friday, September 25th, 2009

Apparently the G-20 will save the world from greedy bankers:

President Barack Obama and other Group of 20 leaders meeting in Pittsburgh are uniting behind a plan to force banks to tie compensation more closely to risk and tighten capital requirements, U.S. officials said. Treasury Secretary Timothy Geithner said there’s a “strong consensus” to tackle global imbalances. At the same time, divisions remain on how to overhaul control of the International Monetary Fund.

That’s a hoot, it really is. “Tie compensation more closely to risk”? “Risk” as defined how and by whom? It seems to have escaped the attention of the press that the Basel Committee (comprised of wise and omniscient bureaucrats) has been attempting to define “risk” in quantitative terms for over twenty years and the current crisis shows they’re not very good at it – no better than the bankers themselves.

But now, it’s done:

Group of 20 leaders said they will crack down on risk-taking by banks and better align economic policies as they turned from crisis management to delivering a new set of rules for the world economy.

“We cannot tolerate the same old boom-and-bust economy of the past,” Obama said after the talks. “Never again should we let the schemes of a reckless few put the world’s financial system and our people’s well-being at risk.”

“They’re trying to ensure that bubbles don’t build up again,” said Kenneth Rogoff, a former chief economist at the International Monetary Fund and a professor at Harvard University. “There’s an element of genuine concern about pay policies, but they may also satisfy some of the public bloodlust.”

Public bloodlust is the key point – and way to whip up the old politics of resentment & envy, Mr. Obama! Now I understand what “Change” means … it means “Change in Targets”.

Banks were told to avoid “multi-year guaranteed bonuses” and a “significant portion of variable compensation” must be deferred, paid in stock, tied to performance and subjected to clawbacks if earnings flop. The G-20 stopped short of endorsing a French proposal to introduce specific caps on pay.

About the only good thing to be said for this is that it will lead a stampede of talent out of the regulated banks and into the hedge-fund sector. Technology’s made it very easy to blur the lines – there’s no reason why a hedge fund can’t call a market in any security and trade it off the exchange in an institutional pool.

Being buck-a-dime on ten-year governments may be less sexy than activist investment management, but it can be much more profitable.

If they can, the profits and share price of banks from Goldman Sachs Group Inc. to Barclays Plc will fall with their scope to invest and trade, said former Bank of England policy maker Charles Goodhart.

“Regulation almost certainly means the size of the banking industry will contract and its rates of return will go down,” said Goodhart, professor emeritus of banking and finance at the London School of Economics.

This will help hedge funds – and other shadow banks – raise capital.

FixedResets outperformed big-time today, returning +14bp against PerpetualDiscounts’ loss of 22bp, while also dominating the volume table on another day of very good volume.

HIMIPref™ Preferred Indices
These values reflect the December 2008 revision of the HIMIPref™ Indices

Values are provisional and are finalized monthly
Index Mean
Current
Yield
(at bid)
Median
YTW
Median
Average
Trading
Value
Median
Mod Dur
(YTW)
Issues Day’s Perf. Index Value
Ratchet 0.00 % 0.00 % 0 0.00 0 -0.3539 % 1,507.3
FixedFloater 5.75 % 4.00 % 52,604 18.59 1 0.4251 % 2,669.0
Floater 2.43 % 2.07 % 37,435 22.27 4 -0.3539 % 1,883.1
OpRet 4.88 % -3.75 % 131,103 0.09 15 -0.1483 % 2,284.2
SplitShare 6.38 % 6.55 % 862,511 4.02 2 0.5752 % 2,073.1
Interest-Bearing 0.00 % 0.00 % 0 0.00 0 -0.1483 % 2,088.7
Perpetual-Premium 5.78 % 5.69 % 150,817 2.81 12 -0.2276 % 1,873.9
Perpetual-Discount 5.74 % 5.79 % 204,453 14.21 59 -0.2170 % 1,795.1
FixedReset 5.49 % 4.04 % 456,934 4.09 40 0.1357 % 2,112.1
Performance Highlights
Issue Index Change Notes
HSB.PR.D Perpetual-Discount -2.15 % YTW SCENARIO
Maturity Type : Limit Maturity
Maturity Date : 2039-09-25
Maturity Price : 21.35
Evaluated at bid price : 21.35
Bid-YTW : 5.89 %
MFC.PR.A OpRet -2.12 % YTW SCENARIO
Maturity Type : Soft Maturity
Maturity Date : 2015-12-18
Maturity Price : 25.00
Evaluated at bid price : 25.45
Bid-YTW : 3.81 %
ELF.PR.F Perpetual-Discount -1.65 % YTW SCENARIO
Maturity Type : Limit Maturity
Maturity Date : 2039-09-25
Maturity Price : 20.90
Evaluated at bid price : 20.90
Bid-YTW : 6.48 %
TRI.PR.B Floater -1.09 % YTW SCENARIO
Maturity Type : Limit Maturity
Maturity Date : 2039-09-25
Maturity Price : 19.05
Evaluated at bid price : 19.05
Bid-YTW : 2.06 %
ELF.PR.G Perpetual-Discount -1.01 % YTW SCENARIO
Maturity Type : Limit Maturity
Maturity Date : 2039-09-25
Maturity Price : 18.67
Evaluated at bid price : 18.67
Bid-YTW : 6.50 %
BNA.PR.D SplitShare 1.02 % YTW SCENARIO
Maturity Type : Hard Maturity
Maturity Date : 2014-07-09
Maturity Price : 25.00
Evaluated at bid price : 25.86
Bid-YTW : 6.55 %
BAM.PR.I OpRet 2.03 % YTW SCENARIO
Maturity Type : Call
Maturity Date : 2009-10-25
Maturity Price : 25.75
Evaluated at bid price : 26.10
Bid-YTW : -11.64 %
CM.PR.K FixedReset 2.16 % YTW SCENARIO
Maturity Type : Call
Maturity Date : 2014-08-30
Maturity Price : 25.00
Evaluated at bid price : 26.05
Bid-YTW : 4.27 %
Volume Highlights
Issue Index Shares
Traded
Notes
TRI.PR.B Floater 170,200 Nesbitt crossed 169,500 at 19.40.
YTW SCENARIO
Maturity Type : Limit Maturity
Maturity Date : 2039-09-25
Maturity Price : 19.05
Evaluated at bid price : 19.05
Bid-YTW : 2.06 %
TD.PR.E FixedReset 137,655 National crossed 10,000 at 27.85; Desjardins crossed 100,000 at the same price; then National crossed a second block of 10,000 at the same price again.
YTW SCENARIO
Maturity Type : Call
Maturity Date : 2014-05-30
Maturity Price : 25.00
Evaluated at bid price : 27.90
Bid-YTW : 3.80 %
CIU.PR.B FixedReset 83,000 RBC crossed 50,000 at 28.14; Nesbitt crossed 30,000 at 28.11.
YTW SCENARIO
Maturity Type : Call
Maturity Date : 2014-07-01
Maturity Price : 25.00
Evaluated at bid price : 28.10
Bid-YTW : 3.98 %
BNS.PR.T FixedReset 52,660 National crossed 30,000 at 27.95.
YTW SCENARIO
Maturity Type : Call
Maturity Date : 2014-05-25
Maturity Price : 25.00
Evaluated at bid price : 27.97
Bid-YTW : 3.73 %
TD.PR.I FixedReset 47,400 Desjardins crossed 33,000 at 27.85.
YTW SCENARIO
Maturity Type : Call
Maturity Date : 2014-08-30
Maturity Price : 25.00
Evaluated at bid price : 27.83
Bid-YTW : 3.96 %
TD.PR.G FixedReset 32,040 National crossed 10,000 at 27.85.
YTW SCENARIO
Maturity Type : Call
Maturity Date : 2014-05-30
Maturity Price : 25.00
Evaluated at bid price : 27.87
Bid-YTW : 3.83 %
There were 54 other index-included issues trading in excess of 10,000 shares.

FRB Cleveland Releases September EconoTrends

Friday, September 25th, 2009

The Federal Reserve Bank of Cleveland has released the September 2009 Edition of EconoTrends, with short articles on:

  • July Price Statistics
  • The Yield Curve, August 2009
  • The Changing Composition of the Fed’s Balance Sheet
  • Borrow Less, Owe More: The U.S. Net International Investment Position
  • Real GDP: Second-Quarter 2009 Revised Estimate
  • Recent Forecasts of Government Debt
  • The Incidence and Duration of Unemployment over the Business Cycle
  • The Employment Situation, August 2009
  • Fourth District Employment Conditions
  • Bank Lending, Capital, Booms, and Busts

The last is under the general heading “Baking and Financial Institutions”, so I guess we’re cooked!

The next chart shows a source of our current problems that many consider more important that pesky bankers’ bonuses:

September 24, 2009

Thursday, September 24th, 2009

Bank of England Governor Mervyn King had some apocalyptic things to say:

two British banks got within hours of a liquidity shortfall on Oct. 6, 2008, and the day after as the U.K. financial system came to the brink of collapse.

“Two of our major banks which had had difficulty in obtaining funding could raise money only for one week then only for one day, and then on that Monday and Tuesday it was not possible even for those two banks really to be confident they could get to the end of the day,” the BBC cited King as saying in an interview to be broadcast later today.

King was referring to Royal Bank of Scotland Group Plc and HBOS Plc, the BBC said. Prime Minister Gordon Brown’s government pledged to invest about 50 billion ($82 billion) pounds in the banking system on Oct. 8, 2008, to save it from meltdown in the aftermath of Lehman Brothers Holdings Inc.’s bankruptcy declared that September.

This meltdown-through-funding scenario ties in the the IMF conclusions on the resiliency of Canadian banks, but I confess that the entire mechanism of such a failure is somewhat opaque to me.

It was to prevent such crises of funding that Central Banking was invented; the Federal Reserve was created explicitly due to the funding difficulties that were at the centre of the panic of 1907 – so why should funding, in and of itself, be such a critical element?

This brings us back to the Northern Rock episode, where the announcement of liquidity support by the BoE actually made matters worse; I have previously speculated that this reflects public distrust of public institutions. If this is the case, then the fundamental assumptions of Central Banking will have to be revised – the discount window has been the most important tool in their box.

What? Public Institutions, civil servants and policitians at fault? Can’t be! It must be the fault of the Credit Rating Agencies:

Moody’s Investors Service, Standard & Poor’s and Fitch Ratings face scrutiny today by insurance regulators examining the role of the firms in evaluating fixed- income securities.

State insurance regulators are meeting in Maryland to examine the firms’ role in rating bonds held by insurance companies. A second hearing scheduled today, by Edolphus Towns, chairman of the House Oversight and Government Reform Committee, was postponed to Sept. 30. The panel will look at ratings companies amid allegations of continued conflicts of interest from a former Moody’s analyst.

“The fundamental issue is if the bar is always moving, that makes it very difficult,” Connecticut insurance Commissioner Thomas Sullivan said in a telephone interview. “Magically overnight, what we thought was AAA is no longer AAA. That’s a big problem.”

Assiduous Readers will remember that actual market participants felt that a volatility scale would be a good adjunct to ratings, but this solution was disdained by regulators. Of some interest in the Bloomberg story was:

Moody’s originally declined to participate in the [NAIC] meeting but relented after New York’s regulator suggested scaling back the rating firm’s authorization if it skipped the session.

Congressional Hearing

The congressional hearing was postponed after the panel obtained an internal Moody’s staff memo written by Eric Kolchinsky, a former analyst at the firm, expressing his concern with how the company rated securities, said committee chairman Edolphus Towns. The panel didn’t have enough time to incorporate the information into the hearing, he said.

A Moody’s representative was invited to the session but didn’t come, Towns said.

“They basically didn’t show up, they ignored us” Towns said in an interview, referring to Moody’s. “I guess they didn’t realize we have subpoena power.”

See? Congressional sessions have subpoena power, but regulators have something even better: extortion.

The Fed has released the Shared National Credits Report:

Credit quality declined sharply for loan commitments of $20 million or more held by multiple federally supervised institutions, according to the 32nd annual review of Shared National Credits (SNC).
The credit risk of these large loan commitments was shared among U.S. bank organizations, foreign bank organizations (FBO), and nonbanks such as securitization pools, hedge funds, insurance companies, and pension funds. Credit quality deteriorated across all entities, but nonbanks held 47 percent of classified assets in the SNC portfolio, despite making up only 21.2 percent of the SNC portfolio. U.S. bank organizations held 30.2 percent of the classified assets and made up 40.8 percent of the SNC portfolio.

The 2009 review covered 8,955 credits totaling $2.9 trillion extended to approximately 5,900 borrowers. Loans were reviewed and categorized by the severity of their risk–special mention, substandard, doubtful, or loss–in order of increasing severity. The lowest risk loans, special mention, had potential weaknesses that deserve management attention to prevent further deterioration at the time of review. The most severe category of loans, loss, includes loans that were considered uncollectible.

Treasury’s wish-list of bank capitalization rules included many references to Tier 1 Financial Holding Companies, a concept I criticized – special status will only cause problems, I said. It would seem that Paul Volcker agrees:

Former Federal Reserve Chairman Paul Volcker criticized the Obama administration’s plan to subject “systemically important” financial firms to more stringent regulation by the Fed.

Volcker told lawmakers today that such a designation would imply government readiness to support the firms in a crisis, encouraging even more risky behavior in a phenomenon known as “moral hazard.”

“The danger is the spread of moral hazard could make the next crisis much bigger,” said Volcker, who serves as an outside economic adviser to Obama. Volcker has criticized key elements of the Obama administration regulatory plan in recent public statements, and his remarks today largely reprised those criticisms.

I am particularly impressed by his reference to the next crisis … it is rare to fin a figure with any political clout not subscribing to the view that the New Millennium will arrive as soon as we get those pesky Credit Rating Agencies under control.

Good volume, soft returns in the preferred market today, with PerpetualDiscounts down 11bp on the day while FixedResets lost 8bp. This may be related to all the new issuance … there are, presumably, people still selling to make room for the monster TRP FixedReset settling September 30 and there was a (long awaited) new straight issue announced by GWO.

HIMIPref™ Preferred Indices
These values reflect the December 2008 revision of the HIMIPref™ Indices

Values are provisional and are finalized monthly
Index Mean
Current
Yield
(at bid)
Median
YTW
Median
Average
Trading
Value
Median
Mod Dur
(YTW)
Issues Day’s Perf. Index Value
Ratchet 0.00 % 0.00 % 0 0.00 0 -0.0154 % 1,512.7
FixedFloater 5.78 % 4.02 % 52,244 18.56 1 -0.7384 % 2,657.7
Floater 2.42 % 2.08 % 34,569 22.25 4 -0.0154 % 1,889.8
OpRet 4.87 % -8.94 % 131,494 0.10 15 -0.4748 % 2,287.6
SplitShare 6.42 % 6.80 % 875,320 4.01 2 0.0000 % 2,061.2
Interest-Bearing 0.00 % 0.00 % 0 0.00 0 -0.4748 % 2,091.8
Perpetual-Premium 5.77 % 5.69 % 150,864 2.82 12 0.0462 % 1,878.2
Perpetual-Discount 5.73 % 5.77 % 203,404 14.24 59 -0.1070 % 1,799.0
FixedReset 5.50 % 4.04 % 459,882 4.05 40 -0.0805 % 2,109.3
Performance Highlights
Issue Index Change Notes
BAM.PR.O OpRet -2.10 % YTW SCENARIO
Maturity Type : Option Certainty
Maturity Date : 2013-06-30
Maturity Price : 25.00
Evaluated at bid price : 25.70
Bid-YTW : 4.20 %
CM.PR.K FixedReset -1.70 % YTW SCENARIO
Maturity Type : Call
Maturity Date : 2019-08-30
Maturity Price : 25.00
Evaluated at bid price : 25.50
Bid-YTW : 4.74 %
BAM.PR.I OpRet -1.62 % YTW SCENARIO
Maturity Type : Call
Maturity Date : 2011-07-30
Maturity Price : 25.25
Evaluated at bid price : 25.58
Bid-YTW : 4.69 %
TD.PR.N OpRet -1.51 % YTW SCENARIO
Maturity Type : Call
Maturity Date : 2010-05-30
Maturity Price : 25.75
Evaluated at bid price : 26.15
Bid-YTW : 3.16 %
CM.PR.R OpRet -1.45 % YTW SCENARIO
Maturity Type : Call
Maturity Date : 2009-10-24
Maturity Price : 25.60
Evaluated at bid price : 25.61
Bid-YTW : -1.60 %
GWO.PR.H Perpetual-Discount -1.44 % YTW SCENARIO
Maturity Type : Limit Maturity
Maturity Date : 2039-09-24
Maturity Price : 20.55
Evaluated at bid price : 20.55
Bid-YTW : 5.94 %
GWO.PR.I Perpetual-Discount -1.08 % YTW SCENARIO
Maturity Type : Limit Maturity
Maturity Date : 2039-09-24
Maturity Price : 19.31
Evaluated at bid price : 19.31
Bid-YTW : 5.86 %
ELF.PR.F Perpetual-Discount 1.09 % YTW SCENARIO
Maturity Type : Limit Maturity
Maturity Date : 2039-09-24
Maturity Price : 21.25
Evaluated at bid price : 21.25
Bid-YTW : 6.37 %
CU.PR.A Perpetual-Premium 1.15 % YTW SCENARIO
Maturity Type : Call
Maturity Date : 2012-03-31
Maturity Price : 25.00
Evaluated at bid price : 25.50
Bid-YTW : 5.14 %
HSB.PR.D Perpetual-Discount 1.39 % YTW SCENARIO
Maturity Type : Limit Maturity
Maturity Date : 2039-09-24
Maturity Price : 21.50
Evaluated at bid price : 21.82
Bid-YTW : 5.74 %
Volume Highlights
Issue Index Shares
Traded
Notes
NA.PR.O FixedReset 105,150 RBC crossed 15,000 at 27.74; Anonymous crossed (? Possibly not the same anonymous) 40,000 at 27.82 then another (?) 39,900 at 27.89 (possibly not the same two anonymice).
YTW SCENARIO
Maturity Type : Call
Maturity Date : 2014-03-17
Maturity Price : 25.00
Evaluated at bid price : 27.75
Bid-YTW : 4.12 %
MFC.PR.D FixedReset 97,275 Desjardins crossed 44,500 at 28.05; Nesbitt crossed 30,000 at 28.00.
YTW SCENARIO
Maturity Type : Call
Maturity Date : 2014-07-19
Maturity Price : 25.00
Evaluated at bid price : 27.99
Bid-YTW : 3.93 %
BAM.PR.K Floater 68,750 Desjardins crossed 55,000 at 13.40.
YTW SCENARIO
Maturity Type : Limit Maturity
Maturity Date : 2039-09-24
Maturity Price : 13.28
Evaluated at bid price : 13.28
Bid-YTW : 2.96 %
BMO.PR.O FixedReset 64,870 RBC crossed 15,000 at 28.01 and sold 20,000 to anonymous at 28.10.
YTW SCENARIO
Maturity Type : Call
Maturity Date : 2014-06-24
Maturity Price : 25.00
Evaluated at bid price : 28.01
Bid-YTW : 3.88 %
TD.PR.K FixedReset 54,200 National crossed 30,000 at 27.82.
YTW SCENARIO
Maturity Type : Call
Maturity Date : 2014-08-30
Maturity Price : 25.00
Evaluated at bid price : 27.74
Bid-YTW : 4.04 %
TD.PR.O Perpetual-Discount 48,916 YTW SCENARIO
Maturity Type : Limit Maturity
Maturity Date : 2039-09-24
Maturity Price : 22.23
Evaluated at bid price : 22.37
Bid-YTW : 5.50 %
There were 58 other index-included issues trading in excess of 10,000 shares.

BPO.PR.L Closes Firm on Heavy Volume

Thursday, September 24th, 2009

BPO.PR.L, the new FixedReset 6.75%+417 announced August 21 has closed smoothly.

The issue traded 898,182 shares in range of 25.02-30 before closing at 25.03-05, 20×75.

BPO.PR.L FixedReset 898,182 YTW SCENARIO
Maturity Type : Limit Maturity
Maturity Date : 2039-09-24
Maturity Price : 24.98
Evaluated at bid price : 25.03
Bid-YTW : 6.74 %

BPO.PR.L is tracked by HIMIPref™ but relegated to the Scraps index on credit concerns.

Why Were Australian Banks So Resilient?

Thursday, September 24th, 2009

I will admit that I’m very unfamiliar with the Australian bank market, but the Reserve Bank of Australia has released its September 2009 Financial Stability Review:

A number of interrelated factors have contributed to the relatively strong performance of the Australian banking system in the face of the challenges of the past couple of years. One is that Australian banks typically entered the financial turmoil with only limited direct exposures to the types of securities – such as CDOs and US sub-prime RMBS – that led to losses for many banks abroad. Moreover, they have typically not relied on the income streams most affected by recent market conditions: trading income only accounted for around 5 per cent of the major banks’ total income prior to the turmoil. Banks’ wealth management operations have been affected by market developments, but the major banks still reported net income of around $2.3 billion from these activities in the latest half year.
One reason why Australian banks garnered a relatively low share of their income from trading and securities holdings is that they did not have as much incentive as many banks around the world to seek out higher-yielding, but higher-risk, offshore assets. In turn, this was partly because they were earning solid profits from lending to domestic borrowers, and already required offshore funding for these activities. As a result, Australian banks’ balance sheets are heavily weighted towards domestic loans, particularly to the historically low-risk household sector.

As discussed in detail in the previous Review, there are several factors that have contributed to the relatively strong outcome in Australia, including:

  • • Lending standards were not eased to the same extent as elsewhere. For example, riskier types of mortgages, such as non-conforming and negative amortisation loans, that became common in the United States, were not features of Australian banks’ lending.
  • • The level of interest rates in Australia did not reach the very low levels that had made it temporarily possible for many borrowers with limited repayment ability to obtain loans, as in some other countries.
  • • All Australian mortgages are ‘full recourse’ following a court repossession action, and households generally understand that they cannot just hand in the keys to the lender to extinguish the debt.
  • • The legal environment in Australia places a stronger obligation on lenders to make responsible lending decisions than is the case in the United States.
  • • The Australian Prudential Regulation Authority (APRA) has been relatively proactive in its approach to prudential supervision, conducting several stress tests of ADIs’ housing loan portfolios and strengthening the capital requirements for higher-risk housing loans.

The Australian housing stress-tests of 2003 have been discussed on PrefBlog.

Capitalization is also good:

The Australian banking system remains soundly capitalised.The sector’s Tier 1 capital ratio rose by 1.3 percentage points over the 12 months to June 2009 to 8.6 per cent, its highest level in over a decade (Graph 37). In contrast, the Tier 2 capital ratio has fallen by around 0.7 percentage points over the same period, mainly because term subordinated debt declined. As a result of these developments, the banking system’s total capital ratio has risen by almost 0.7 percentage points over the past year, to stand at 11.3 per cent as at June 2009. A similar pattern has been evident in a simpler measure of leverage – the ratio of ordinary shares to (unweighted) assets – which has risen by around half a percentage point over the past six months. The credit union and building society sectors are also well capitalised, with aggregate total capital ratios of 16.4 per cent and 15 per cent.

In response to falling profits, many banks have cut their dividends (Graph 39). Despite these lower dividends, the major banks’ dividend payout ratio increased to around 80 per cent over the past year.

Most banks are endeavouring to increase their share of funding from deposits, in response to markets’ increased focus on funding liquidity risk. For some of the smaller banks, it is also because of a lack of alternative funding options, given the difficulties in the securitisation market. These factors have led to strong competition for deposits, especially for term deposits, and deposit spreads have widened. For instance, the average rate paid by the major banks on their term deposit ‘specials’ is currentlyaround 175 basis points above the 90-day bank bill rate, compared to about 75 basis points as at end December 2008.

I’m not sure just what a “special” might be … can any Australians elucidate the matter? I assume that a “bank bill” is essentially a bearer deposit note, but confirmation would be appreciated.

After the review of the current environment, there is a discussion of The International Regulatory Agenda and Australia:

As noted in The Australian Financial System chapter, following the capital raisings by the Australian banks this year, the Tier 1 capital ratio for the banking system is at its highest level in over a decade. In addition, APRA’s existing prudential standard requires that the highest form of capital (such as ordinary shares and retained earnings) must account for at least 75 per cent of Tier 1 capital (net of deductions); other components, such as non-cumulative preference shares, are limited to a maximum of 25 per cent. In some other countries this split has been closer to 50:50.

The old Canadian standard was 75%; after relaxing to 70% in January 2008, OSFI debased capital quality requirements in November 2008 to 60%.