Well, that was a week and a half!
U.S. stocks sank, with the Dow Jones Industrial Average capping its biggest weekly drop in three years, as oil continued to slide and Chinese industrial data raised concern over a global economic slowdown.
Materials stocks declined the most in the Standard & Poor’s 500 Index, losing 2.9 percent as a group, while energy shares dropped 2.2 percent. International Business Machines Corp., DuPont Co. and Exxon Mobil Corp. sank at least 2.9 percent to lead declines in all 30 Dow stocks.
The S&P 500 lost 1.6 percent to 2,002.33 at 4 p.m. in New York, extending losses in the final hour to cap a weekly drop of 3.5 percent. The Dow sank 315.51 points, or 1.8 percent, to 17,280.83. The Dow slid 3.8 percent for the week, its biggest decline since November 2011.
Canada did worse:
Canadian stocks tumbled with equities around the world, capping the worst week in three years, as the continuing selloff in oil fueled concerns over a global economic slowdown.
Energy stocks dropped with oil prices as RMP Energy Inc. and Pacific Rubiales Energy Corp. slid at least 7.9 percent. Consumer-discretionary stocks sank as Amaya Inc. plunged 18 percent. Talisman Energy Inc. soared 17 percent on speculation of a deal with Repsol SA.
The Standard & Poor’s/TSX Composite Index (SPTSX) fell 173.22 points, or 1.3 percent, to 13,731.9 at 4 p.m. in Toronto. The equity gauge dropped 5.1 percent over five days, its worst weekly decline since September 2011. Trading in S&P/TSX stocks was 12 percent above the 30-day average at this time of day.
But it’s an ill wind…:
Inflation is moribund and bond buyers love it.
As crude oil leads a collapse in commodity prices, a German gauge of the outlook for inflation over the next five years has fallen below zero. With no increases in consumer prices in sight, bondholders’ interest and repayments are worth more, inflaming demand for fixed income. The longest maturities are setting the pace from Europe to the U.S.
The rush for bonds pushed yields in Germany and six other euro-area nations to record lows today, while in the U.S, 30-year yields closed at the lowest level since 2012, according to data compiled by Bloomberg. Adding to the momentum is the prospect that central-bank measures to rekindle inflation would involve efforts to keep down borrowing costs, including so-called quantitative easing from the European Central Bank
… and Treasuries…:
Treasuries rallied, with 10-year yields reaching the lowest in eight weeks, as a plunge in crude oil raised concern global inflation is slipping further below central-bank targets before the Federal Reserve meets next week.
The notes posted the biggest weekly decline in yield since June 2012 as crude oil futures fell below $58 a barrel in New York. Fed policy makers will review whether to retain the vow to hold interest rates at virtually zero for a “considerable time.” The biggest U.S. jobs gains in November since January 2012 fueled speculation last week of quicker interest-rate increases, while reports showing slowing factory output in China’s and financial turmoil in Greece represent additional economic headwinds for the U.S.
…
Treasury 10-year note yields fell eight basis points, or 0.08 percentage point, to 2.08 percent at 5 p.m. in New York, according to Bloomberg Bond Trader prices, after reaching the lowest level since Oct. 16. The 2.25 percent security rose 23/32 or $7.19 per $1,000 face amount, to 101 15/32. The yield has fallen 22 basis points this week, the most since June 2012.
So it seems as if the CSE is introducing market-makers:
Following the successful completion of a pilot project with two symbols, the CSE is now accepting applications for Market Makers for all CSE-listed securities. As outlined in the November 14 notice the CSE is modifying its market making programme to improve execution quality and service for retail investors. Market Makers will have the following responsibilities in their assigned stocks:
- •Maintain a bid/ask spread goal
- •Provide a Guaranteed Minimum Fill for eligible orders
- •Provide automatic odd lot execution, so that all incoming market or better limit odd lot orders will be auto traded at the bid/ask if they cannot be filled by booked odd lot orders;
- •Ensure a reasonable bid/ask in the context of current market conditions
- •Undergo periodic performance reviews
If the Toronto Stock Exchange is any guide, then:
- The bid/ask spread goal will neither be publicized nor enforced
- The size of the Guaranteed Minimum Fill will be top secret information, available only to those who pay for it
- Automatic odd lot execution will be fine. Yay!
- A reasonable bid/ask spread will be good fodder for jokes
- performance reviews will not be public and nobody will ever lose their assignment
DBRS downgraded Timmy’s:
DBRS Limited (DBRS) has today downgraded the Issuer Rating of Tim Hortons Inc. (THI or the Company) to BB (low) and its Senior Unsecured Debt to B, with a recovery rating of RR6; the trends are Stable. This action follows the Company’s announcement that it has received regulatory approval for and its shareholders have voted in favour of the proposed transaction to create a new global quick-service restaurant leader that would own both THI and Burger King Worldwide, Inc. (Burger King) under a new parent company, Restaurant Brands International (RBI). DBRS has removed the ratings from Under Review with Negative Implications.
…
Financial Risk Profile
In terms of financial profile, RBI is expected to have balance sheet debt of over $9 billion and preferred shares of $3 billion. Combined with pro forma earnings, DBRS estimates the combined entity will have lease-adjusted debt-to-EBITDAR excluding the preferred shares of approximately 6.23 times (x) and fixed-charge coverage of 1.96x, including the preferred dividend, credit metrics considered at the lower-end of the B range of ratings. That said, the combined entity should nevertheless generate meaningful levels of free cash flow (based on solid operating cash flow and low maintenance capex) beginning in 2016 and could deleverage significantly through a combination of debt repayment and earnings growth.
But, wonder of wonders, the Canadian preferred share market had a very good day, with PerpetualDiscounts up 8bp, FixedResets rocketing up 62bp and DeemedRetractibles gaining 3bp. Not surprisingly, given the averages, the lengthy Performance Highlights table is dominated by FixedReset winners. Volume was high.
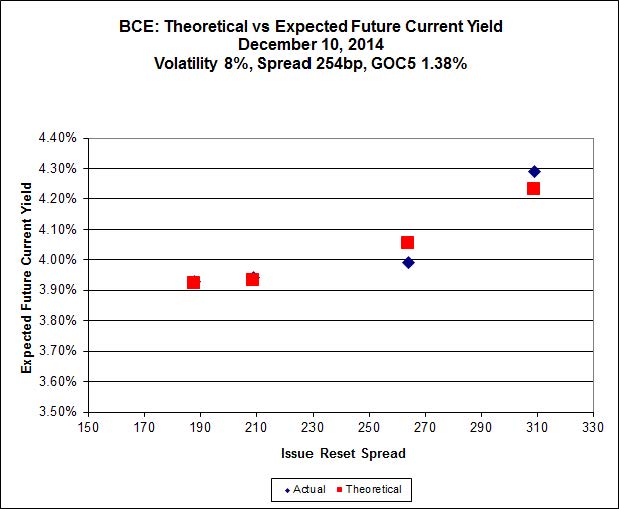
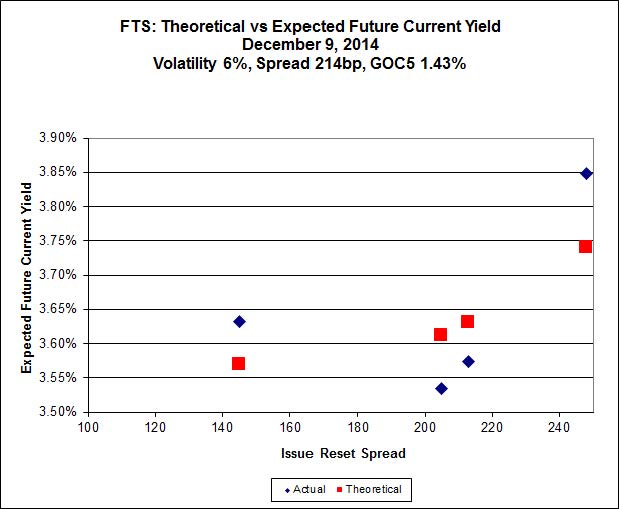
For as long as the FixedReset market is so violently unsettled, I’ll keep publishing updates of the more interesting and meaningful series of FixedResets’ Implied Volatilities. This doesn’t include Enbridge because although Enbridge has a large number of issues outstanding, all of which are quite liquid, the range of Issue Reset Spreads is too small for decent conclusions. The low is 212bp (ENB.PR.H; second-lowest is ENB.PR.D at 237bp) and the high is a mere 268 for ENB.PF.G.
Remember that all rich /cheap assessments are:
- based on Implied Volatility Theory only
- are relative only to other FixedResets from the same issuer
- assume constant GOC-5 yield
- assume constant Implied Volatility
- assume constant spread
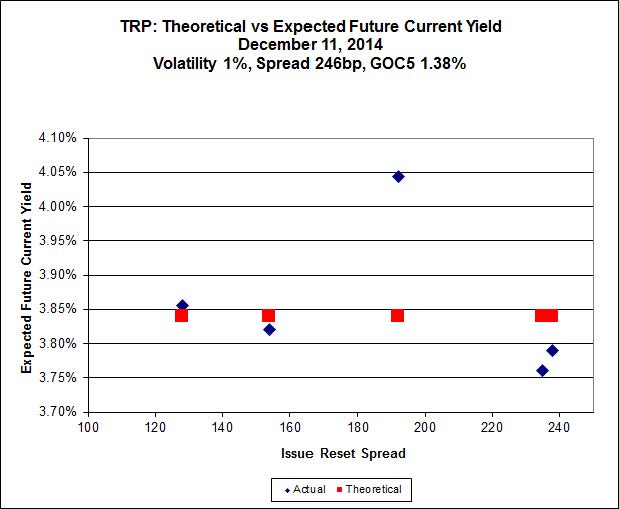
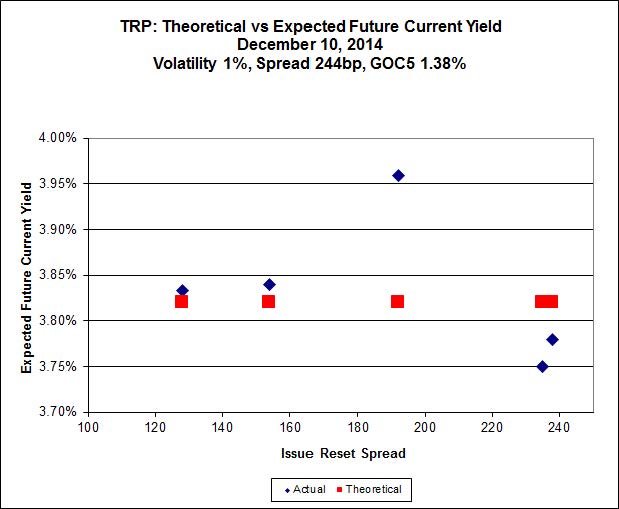
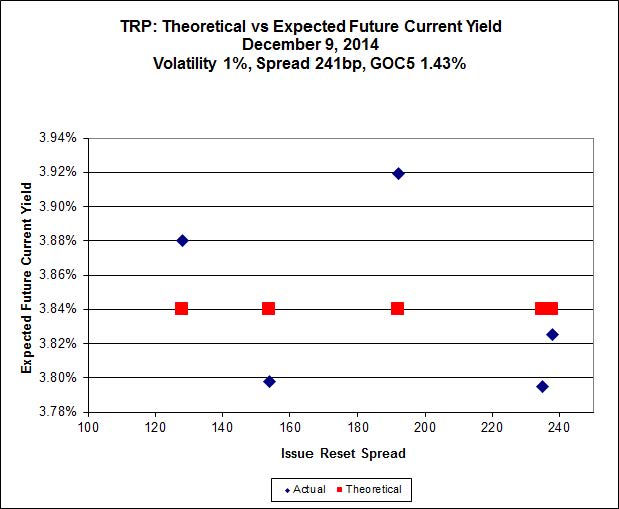
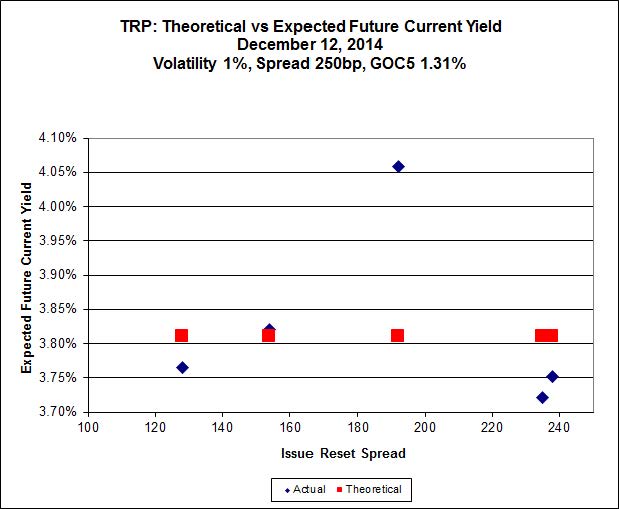
Here’s TRP:
Click for Big
So according to this, TRP.PR.A, bid at 19.90, is $1.29 cheap, but it has already reset. TRP.PR.B, bid at 17.20, resetting 2015-6-30 is about 0.21 rich and TRP.PR.C, bid at 18.65, resetting 2016-1-30 is fairly priced. The TRP issues seem to be steadily rationalizing, but there continues to be pressure on TRP.PR.A.

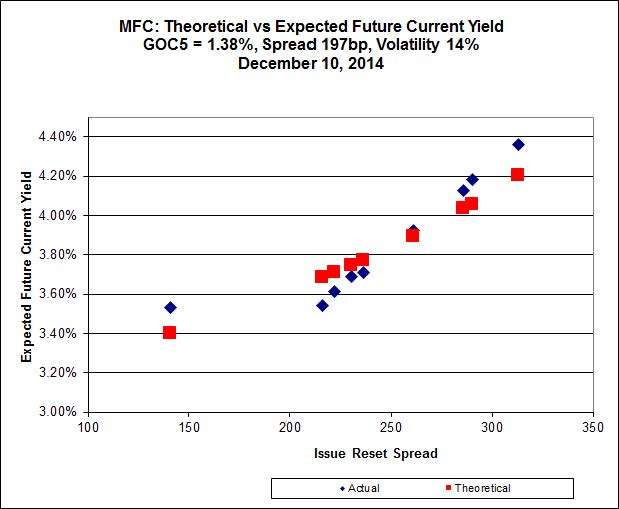
Click for Big
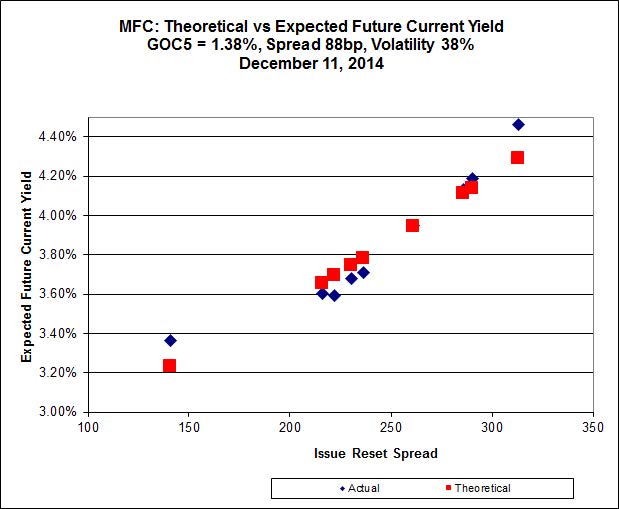
It looks like we’re back in the situation in which eight of the nine issues are well-behaved in accordance with theory, but extraordinary pressure on the lowest-spread issue, MFC.PR.F, is distorting the whole calculation. According to the distorted fit, MFC.PR.F, resetting at +141 on 2016-6-19 is about $0.62 cheap, while MFC.PR.L, resetting at +216 on 2019-6-19, is about $0.61 rich.
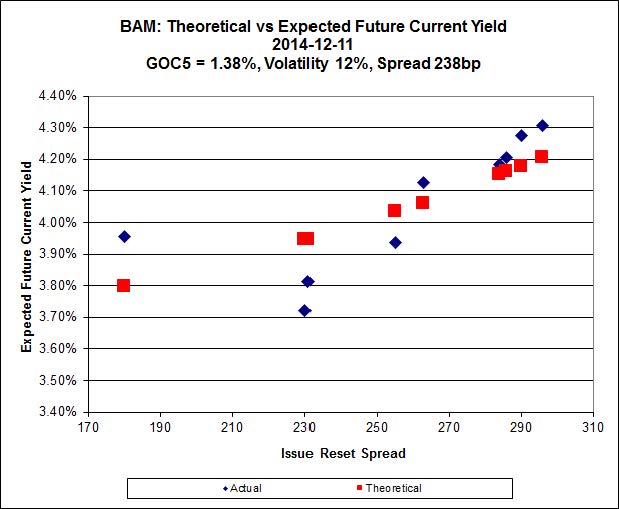
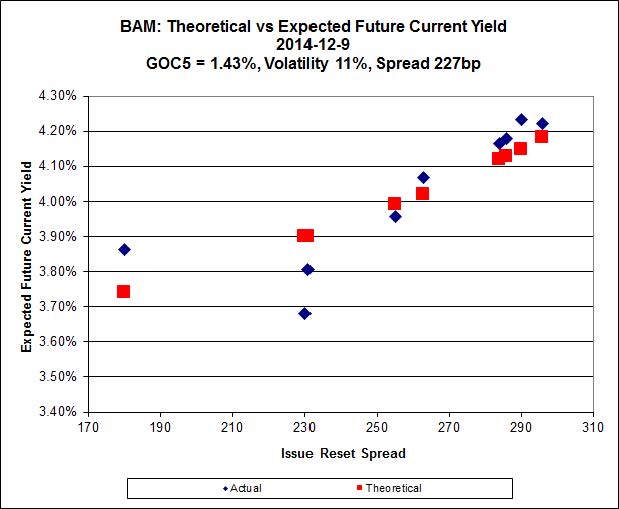
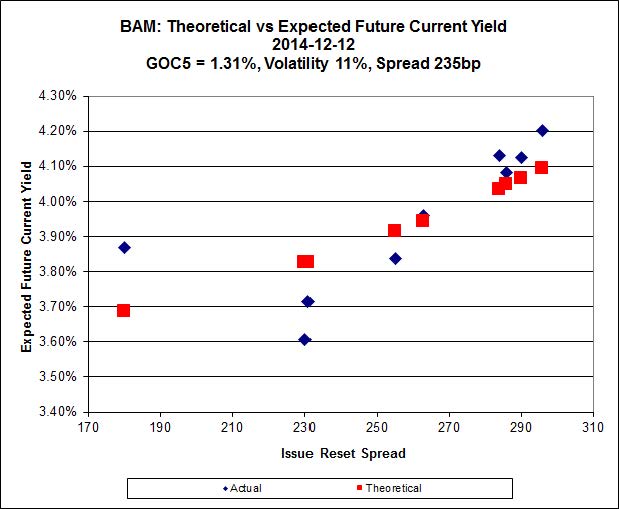
BAM is a little difficult to figure out:
Click for Big
As with MFC, it looks as if extraordinary cheapness in the lowest-spread issue, BAM.PR.X, resetting at +180bp on 2017-6-30, may be throwing off the Implied Volatility calculation; be that as it may, BAM.PR.X is bid at 20.10 and appears to be $0.99 cheap, while BAM.PR.R, resetting at +230bp 2016-6-30 is bid at 25.02 and appears to be $1.43 rich.
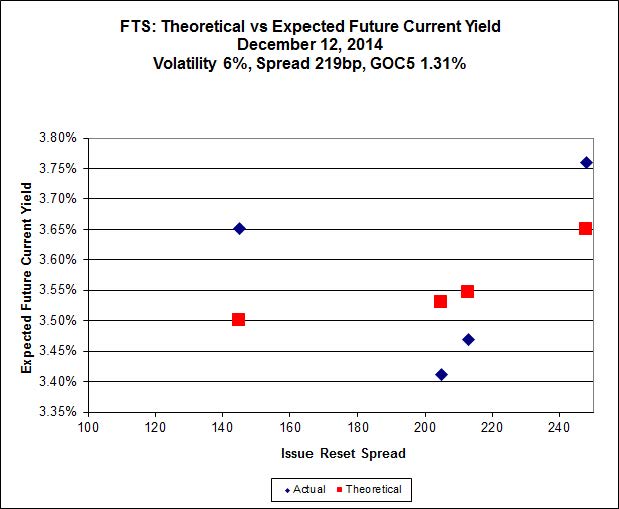
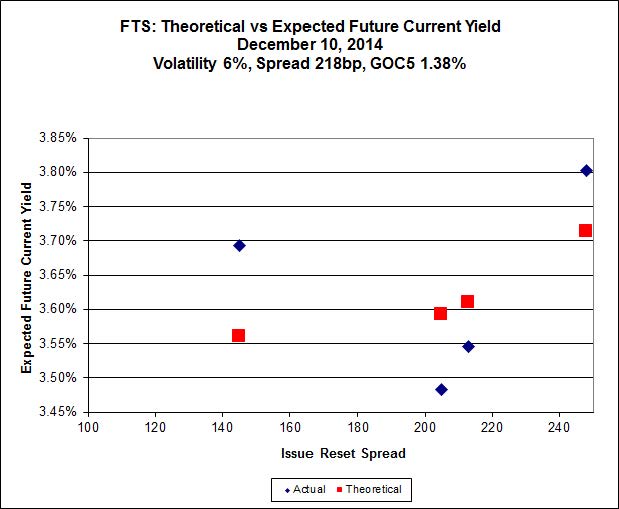
Click for Big
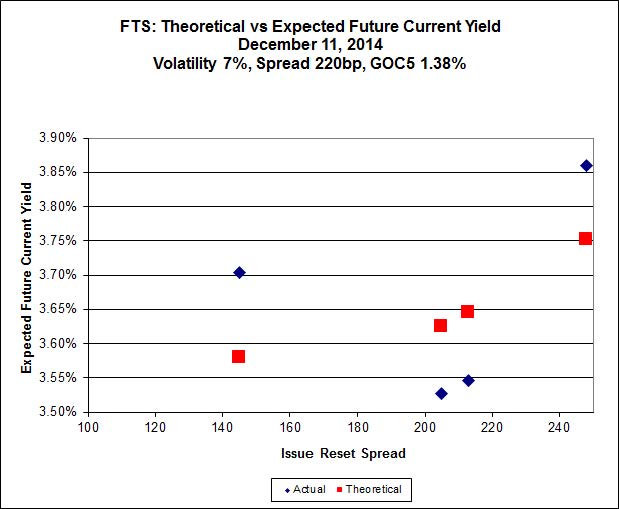
This is just weird because the middle is expensive and the ends are cheap but anyway … FTS.PR.H, with a spread of +145bp, and bid at 18.90, looks $0.81 cheap and resets 2015-6-1. FTS.PR.K, with a spread of +205bp, and bid at 24.62, looks $0.82 expensive and resets 2019-3-1
And now it’s time for PrefLetter!
| HIMIPref™ Preferred Indices These values reflect the December 2008 revision of the HIMIPref™ Indices Values are provisional and are finalized monthly |
|||||||
| Index | Mean Current Yield (at bid) |
Median YTW |
Median Average Trading Value |
Median Mod Dur (YTW) |
Issues | Day’s Perf. | Index Value |
| Ratchet | 0.00 % | 0.00 % | 0 | 0.00 | 0 | -0.8015 % | 2,501.7 |
| FixedFloater | 0.00 % | 0.00 % | 0 | 0.00 | 0 | -0.8015 % | 3,960.6 |
| Floater | 3.03 % | 3.13 % | 61,910 | 19.42 | 4 | -0.8015 % | 2,659.4 |
| OpRet | 4.41 % | -5.72 % | 28,284 | 0.08 | 2 | -0.1369 % | 2,752.0 |
| SplitShare | 4.30 % | 4.07 % | 44,928 | 3.72 | 5 | -0.1096 % | 3,175.2 |
| Interest-Bearing | 0.00 % | 0.00 % | 0 | 0.00 | 0 | -0.1369 % | 2,516.4 |
| Perpetual-Premium | 5.44 % | 1.31 % | 74,566 | 0.08 | 20 | 0.0137 % | 2,475.1 |
| Perpetual-Discount | 5.23 % | 5.15 % | 111,129 | 15.21 | 15 | 0.0750 % | 2,632.9 |
| FixedReset | 4.28 % | 3.64 % | 224,047 | 16.51 | 75 | 0.6184 % | 2,516.2 |
| Deemed-Retractible | 5.00 % | 1.32 % | 97,795 | 0.21 | 40 | 0.0279 % | 2,600.9 |
| FloatingReset | 2.56 % | 2.12 % | 64,801 | 3.53 | 5 | -0.3147 % | 2,533.4 |
| Performance Highlights | |||
| Issue | Index | Change | Notes |
| TRP.PR.A | FixedReset | -2.45 % | YTW SCENARIO Maturity Type : Limit Maturity Maturity Date : 2044-12-12 Maturity Price : 19.90 Evaluated at bid price : 19.90 Bid-YTW : 4.07 % |
| TRP.PR.C | FixedReset | -2.41 % | YTW SCENARIO Maturity Type : Limit Maturity Maturity Date : 2044-12-12 Maturity Price : 18.65 Evaluated at bid price : 18.65 Bid-YTW : 3.98 % |
| BAM.PR.C | Floater | -1.24 % | YTW SCENARIO Maturity Type : Limit Maturity Maturity Date : 2044-12-12 Maturity Price : 16.70 Evaluated at bid price : 16.70 Bid-YTW : 3.14 % |
| BAM.PR.B | Floater | -1.19 % | YTW SCENARIO Maturity Type : Limit Maturity Maturity Date : 2044-12-12 Maturity Price : 16.61 Evaluated at bid price : 16.61 Bid-YTW : 3.15 % |
| FTS.PR.H | FixedReset | -1.05 % | YTW SCENARIO Maturity Type : Limit Maturity Maturity Date : 2044-12-12 Maturity Price : 18.90 Evaluated at bid price : 18.90 Bid-YTW : 3.70 % |
| CU.PR.C | FixedReset | 1.00 % | YTW SCENARIO Maturity Type : Limit Maturity Maturity Date : 2044-12-12 Maturity Price : 23.56 Evaluated at bid price : 25.25 Bid-YTW : 3.60 % |
| BNS.PR.R | FixedReset | 1.02 % | YTW SCENARIO Maturity Type : Hard Maturity Maturity Date : 2022-01-31 Maturity Price : 25.00 Evaluated at bid price : 25.65 Bid-YTW : 3.25 % |
| IFC.PR.C | FixedReset | 1.10 % | YTW SCENARIO Maturity Type : Call Maturity Date : 2016-09-30 Maturity Price : 25.00 Evaluated at bid price : 25.80 Bid-YTW : 2.26 % |
| MFC.PR.C | Deemed-Retractible | 1.10 % | YTW SCENARIO Maturity Type : Hard Maturity Maturity Date : 2025-01-31 Maturity Price : 25.00 Evaluated at bid price : 22.90 Bid-YTW : 5.62 % |
| BAM.PR.R | FixedReset | 1.21 % | YTW SCENARIO Maturity Type : Limit Maturity Maturity Date : 2044-12-12 Maturity Price : 23.72 Evaluated at bid price : 25.02 Bid-YTW : 3.64 % |
| BNS.PR.Q | FixedReset | 1.26 % | YTW SCENARIO Maturity Type : Call Maturity Date : 2018-10-25 Maturity Price : 25.00 Evaluated at bid price : 25.70 Bid-YTW : 2.97 % |
| FTS.PR.K | FixedReset | 1.28 % | YTW SCENARIO Maturity Type : Limit Maturity Maturity Date : 2044-12-12 Maturity Price : 23.09 Evaluated at bid price : 24.62 Bid-YTW : 3.44 % |
| ENB.PR.T | FixedReset | 1.29 % | YTW SCENARIO Maturity Type : Limit Maturity Maturity Date : 2044-12-12 Maturity Price : 22.12 Evaluated at bid price : 22.69 Bid-YTW : 4.23 % |
| BAM.PF.F | FixedReset | 1.31 % | YTW SCENARIO Maturity Type : Call Maturity Date : 2019-09-30 Maturity Price : 25.00 Evaluated at bid price : 25.53 Bid-YTW : 3.98 % |
| NA.PR.S | FixedReset | 1.39 % | YTW SCENARIO Maturity Type : Limit Maturity Maturity Date : 2044-12-12 Maturity Price : 23.35 Evaluated at bid price : 25.45 Bid-YTW : 3.60 % |
| TRP.PR.E | FixedReset | 1.61 % | YTW SCENARIO Maturity Type : Limit Maturity Maturity Date : 2044-12-12 Maturity Price : 23.24 Evaluated at bid price : 25.20 Bid-YTW : 3.67 % |
| IFC.PR.A | FixedReset | 1.72 % | YTW SCENARIO Maturity Type : Hard Maturity Maturity Date : 2025-01-31 Maturity Price : 25.00 Evaluated at bid price : 23.00 Bid-YTW : 4.39 % |
| MFC.PR.L | FixedReset | 1.87 % | YTW SCENARIO Maturity Type : Hard Maturity Maturity Date : 2025-01-31 Maturity Price : 25.00 Evaluated at bid price : 25.04 Bid-YTW : 3.66 % |
| BMO.PR.M | FixedReset | 1.91 % | YTW SCENARIO Maturity Type : Hard Maturity Maturity Date : 2022-01-31 Maturity Price : 25.00 Evaluated at bid price : 25.12 Bid-YTW : 3.15 % |
| MFC.PR.F | FixedReset | 1.93 % | YTW SCENARIO Maturity Type : Hard Maturity Maturity Date : 2025-01-31 Maturity Price : 25.00 Evaluated at bid price : 21.15 Bid-YTW : 4.92 % |
| BAM.PF.A | FixedReset | 1.96 % | YTW SCENARIO Maturity Type : Call Maturity Date : 2018-09-30 Maturity Price : 25.00 Evaluated at bid price : 25.51 Bid-YTW : 3.87 % |
| BNS.PR.P | FixedReset | 2.15 % | YTW SCENARIO Maturity Type : Call Maturity Date : 2018-04-25 Maturity Price : 25.00 Evaluated at bid price : 25.70 Bid-YTW : 2.60 % |
| BAM.PF.B | FixedReset | 2.39 % | YTW SCENARIO Maturity Type : Limit Maturity Maturity Date : 2044-12-12 Maturity Price : 23.18 Evaluated at bid price : 24.88 Bid-YTW : 3.90 % |
| GWO.PR.N | FixedReset | 2.54 % | YTW SCENARIO Maturity Type : Hard Maturity Maturity Date : 2025-01-31 Maturity Price : 25.00 Evaluated at bid price : 20.16 Bid-YTW : 5.19 % |
| MFC.PR.H | FixedReset | 2.93 % | YTW SCENARIO Maturity Type : Call Maturity Date : 2017-03-19 Maturity Price : 25.00 Evaluated at bid price : 26.01 Bid-YTW : 2.72 % |
| PWF.PR.T | FixedReset | 5.47 % | YTW SCENARIO Maturity Type : Limit Maturity Maturity Date : 2044-12-12 Maturity Price : 23.37 Evaluated at bid price : 25.44 Bid-YTW : 3.61 % |
| Volume Highlights | |||
| Issue | Index | Shares Traded |
Notes |
| IAG.PR.E | Deemed-Retractible | 148,462 | Nesbitt crossed 148,400 at 25.98. YTW SCENARIO Maturity Type : Call Maturity Date : 2015-01-30 Maturity Price : 26.00 Evaluated at bid price : 25.97 Bid-YTW : 4.43 % |
| ENB.PR.Y | FixedReset | 122,022 | RBC crossed 97,800 at 21.90. YTW SCENARIO Maturity Type : Limit Maturity Maturity Date : 2044-12-12 Maturity Price : 21.58 Evaluated at bid price : 21.91 Bid-YTW : 4.30 % |
| FTS.PR.M | FixedReset | 106,445 | Scotia crossed blocks of 53,200 and 40,000, both at 25.15. YTW SCENARIO Maturity Type : Limit Maturity Maturity Date : 2044-12-12 Maturity Price : 23.23 Evaluated at bid price : 25.20 Bid-YTW : 3.71 % |
| MFC.PR.N | FixedReset | 71,890 | Recent new issue. YTW SCENARIO Maturity Type : Hard Maturity Maturity Date : 2025-01-31 Maturity Price : 25.00 Evaluated at bid price : 25.01 Bid-YTW : 3.74 % |
| TRP.PR.A | FixedReset | 53,405 | Will reset at 3.266%. YTW SCENARIO Maturity Type : Limit Maturity Maturity Date : 2044-12-12 Maturity Price : 19.90 Evaluated at bid price : 19.90 Bid-YTW : 4.07 % |
| CM.PR.E | Perpetual-Premium | 48,584 | Called for redemption 2015-1-31. YTW SCENARIO Maturity Type : Call Maturity Date : 2015-01-11 Maturity Price : 25.00 Evaluated at bid price : 25.30 Bid-YTW : -0.97 % |
| There were 45 other index-included issues trading in excess of 10,000 shares. | |||
| Wide Spread Highlights | ||
| Issue | Index | Quote Data and Yield Notes |
| NEW.PR.D | SplitShare | Quote: 32.47 – 33.35 Spot Rate : 0.8800 Average : 0.6946 YTW SCENARIO |
| PWF.PR.P | FixedReset | Quote: 20.60 – 21.18 Spot Rate : 0.5800 Average : 0.4300 YTW SCENARIO |
| TRP.PR.D | FixedReset | Quote: 24.59 – 25.16 Spot Rate : 0.5700 Average : 0.4215 YTW SCENARIO |
| TRP.PR.C | FixedReset | Quote: 18.65 – 19.10 Spot Rate : 0.4500 Average : 0.3112 YTW SCENARIO |
| IGM.PR.B | Perpetual-Premium | Quote: 26.05 – 26.50 Spot Rate : 0.4500 Average : 0.3421 YTW SCENARIO |
| TRP.PR.B | FixedReset | Quote: 17.20 – 17.49 Spot Rate : 0.2900 Average : 0.1856 YTW SCENARIO |