David Parkinson of the Globe offers up some threads of hope for the Canadian economy:
Statistics Canada reported that, month-over-month, retail sales rose 0.6 per cent in June, adding to May’s 0.9-per-cent rise. While the gain was entirely a result of price increases – on a volume basis, sales were flat in the month – the solid retail performance caps a run of impressive growth from several key components of the Canadian economy. Together, they add up to a rebound in gross domestic product in June, after the first-quarter GDP contraction of 0.6 per cent annualized was followed by further negative readings in April and May.
Forecasters are now pegging June’s month-over-month GDP growth in a range of 0.2 to 0.4 per cent, which would make it the first month of positive GDP since the end of 2014.
…
The impressive run of June growth indicators started with the merchandise trade report released early this month, which showed a stellar 6.3-per-cent surge in exports over May – a gain so big it wiped out all the declines from the first five months of the year. Since then, the prospects for a strong June GDP number were bolstered by last week’s report of a 1.2-per-cent month-over-month rise in manufacturing sales, and news this week that wholesale sales gained 1.3 per cent.
Equity markets were very nervous today:
Stock bulls looking for a respite from the worst declines since 2011 instead had to watch as a 442-point rally in the Dow Jones Industrial Average vanished in the final hour. The tumble, stretching to 4 percent from the day’s highest level, dashed hopes that China’s interest-rate cut would put a floor under U.S. equities.
Concern bubbled over as the day progressed that fresh stimulus in China wouldn’t be enough to prop up its stock market, where the Shanghai Composite Index has lost 22 percent in four days. Exchange-traded funds tracking China’s A-shares pared gains of as much as 5.2 percent in U.S. trading, halting a rally earlier in the day spurred by policy makers cutting interest rates for a fifth time since November.
…
At the same time, the rout is occurring at a time of deteriorating market sentiment and stagnant earnings. Owners of mutual and exchange-traded funds yanked $78.8 billion from U.S. shares in the first seven months of 2015, more than in any full year since at least 1993. Profits reported by S&P 500 companies in the second quarter fell 2 percent from a year ago and are projected to slip 5.5 percent in the current period.
Never mind US equity funds, look at how much has been taken off the table in China!
China’s margin debt has plunged by 1 trillion yuan ($156 billion) from its June peak as stock traders close out bets using borrowed money amid a $5 trillion rout.
Outstanding margin loans on the Shanghai and Shenzhen exchanges fell to about 1.25 trillion yuan on Monday from a record high of 2.27 trillion yuan on June 18. The Shanghai Composite Index has plunged 45 percent from its June peak amid concern that the highest valuations among major world markets are unjustified given the outlook for slowing economic growth.
Chinese authorities have taken a page from the western political response and are desperately seeking scapegoats:
Authorities announced a probe of allegations of market malpractice involving the stocks regulator on Tuesday, while the official Xinhua News Agency called for efforts to “purify” the capital markets. The news service also carried remarks by a central bank researcher attributing the global rout to an expected Federal Reserve rate increase.
The Shanghai Composite Index has plunged more than 40 percent from its peak, after concerns over the Chinese economy helped snap a months-long rally encouraged by state-run media. Authorities have repeatedly blamed market manipulators and foreign forces since the sell off began in June and led officials to launch an unprecedented stocks-support program.
Now, after suspending that program, the administration has embarked on a new round of allegations and fault-finding.
And all this is affecting speculation regarding the timing of ‘lift-off’:
Traders see a 28 percent probability that the Fed will raise its target next month, according to data compiled by Bloomberg. That probability rises to 34 percent by the end of October, and jumps to 51 percent by the December gathering.
Yellen holds press conferences after every other Federal Open Market Committee meeting.
Some traders see the lack of an October press conference as a dealbreaker. Yet Yellen has indicated that rate decisions wouldn’t depend on when press conferences are scheduled.
So the September probability, charted on August 19 continues to gyrate.
Liberty Street Economics, a vehicle of the New York Fed, has released a series of posts on market liquidity.
The first is titled Has U.S. Treasury Market Liquidity Deteriorated? which emphasizes that there are many ways to define and measure liquidity and that definitions matter:
As shown in the chart below, bid-ask spreads widened markedly during the crisis, but have been relatively narrow and stable since.
…
The chart below plots order book depth, measured as the average quantity of securities available for sale or purchase at the best bid and offer prices. Depth rebounded healthily after the crisis, but declined markedly during the 2013 taper tantrum and around the October 15, 2014 flash rally. It is not unusually low at present by recent historical standards.

Click for Big
The next chart plots the estimated price impact per $100 million net order flow as calculated weekly over five-minute intervals; higher impacts suggest reduced liquidity. Price impact rose sharply during the crisis, declined markedly after, and then increased some during the taper tantrum and in the week including October 15, 2014. The measure remained somewhat elevated after October 15, but is not now especially high by recent historical standards.
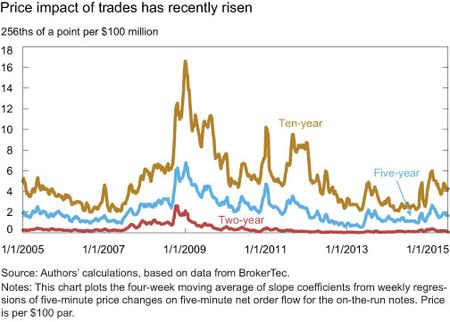
Click for Big
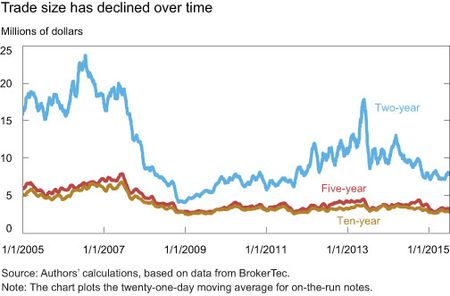
The decline in trade size compared with the precrisis period may merely reflect the increasing prevalence of high frequency trading in the interdealer market, so may be a less reliable indicator of reduced liquidity than the preceding measures.
Click for Big
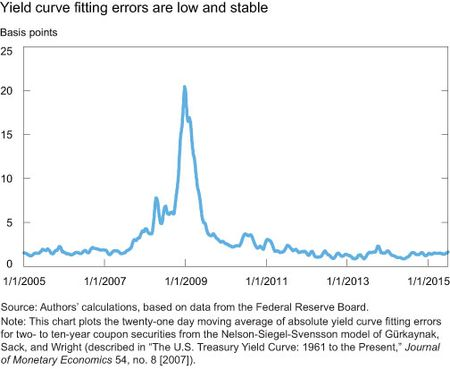
While the high-frequency liquidity measures provide a mixed message regarding the state of Treasury liquidity, the daily measures we consider next are more consistent. We first look at the dispersion of yields around a smoothed yield curve as estimated by the average absolute difference between actual yields and predicted yields (Hu, Pan, and Wang [2013] construct a similar measure).
Click for Big
If average liquidity is generally good by historical standards, then why all the liquidity concerns? One possibility is that the unease is not so much about on-the-run Treasury securities, but about less liquid Treasury securities or other fixed-income securities such as corporate debt securities, which we have not examined here (and for which there is less detailed data to assess liquidity).
Or perhaps the concerns are not so much about average liquidity levels, as we examined, but about liquidity risk. Indeed the events of October 15 and similar episodes of sharp, seemingly unexplained price changes in the dollar-euro and German Bund markets have heightened worry about tail events in which liquidity suddenly evaporates. Liquidity risk, or really illiquidity risk, is harder to measure than liquidity itself, but we attempt to do so in a future post.
Finally, it might be that liquidity concerns reflect anxiety about future liquidity conditions, with a possible imbalance between liquidity supply and demand. On the demand side, the share of Treasuries owned by mutual funds, which may demand daily liquidity, has increased. On the supply side, the primary dealers have pared their financing activities sharply since the crisis and shown no growth in their gross positions despite the sharp increase in Treasury debt outstanding. Market commentators point to these factors and the current environment of low volatility and worry about what will happen when monetary policy is normalized and volatility rises.
The second post, titled Liquidity during Flash Events, concludes:
In particular, all three events exhibited strained liquidity conditions during periods of extreme price volatility but the Treasury market event arguably exhibited a greater degree of price continuity, consistent with descriptions of the flash rally as “slow-moving.”
The third post, High-Frequency Cross-Market Trading in U.S. Treasury Markets, states:
The cash market platform (in Secaucus, New Jersey) and the futures market exchange (in Aurora, Illinois) exhibit very pronounced cross-market trading activity at an offset of +/-5 milliseconds, strikingly consistent with the time it takes to transmit information between the two trading venues using current microwave tower technology. Spikes occur at both negative and positive offsets, suggesting that sometimes Treasury futures lead cash Treasuries (+5 millisecond offset) and other times the cash market leads futures (-5 millisecond offset), a remarkable fact since it indicates that price discovery takes place in both markets as they can both lead each other.
…
Cross-market trading by now accounts for a significant portion of trading in Treasury instruments in both the cash and futures markets. This reflects improvements in trading technology that allow for high-frequency trading within and across platforms. In particular, nearly simultaneous trading between the cash and futures platforms now accounts for up to 20 percent of cash market activity on many days.Market participants often presume that price discovery happens in Treasury futures. However, our findings show that this is not always the case: Although futures usually lead cash, the reverse is also often true. Therefore, from a price discovery point of view, the two markets can effectively be seen as one.
The fourth post is a highly technical piece titled The Evolution of Workups in the U.S. Treasury Securities Market. It’s really only comprehensible if you read the associated staff report on Workups, Order Flow Segmentation and the Role of Dark Pool Trading in the Price Discovery of U.S. Treasury Securities.
The last post, What’s Driving Dealer Balance Sheet Stagnation? investigates the issue of the reason for relatively small dealer balance sheets:
The growing role of electronic trading has likely narrowed bid-ask spreads and reduced dealers’ profits from intermediating customer order flow, causing dealers to step back from making markets and reducing their need for large balance sheets. The changing competitive landscape of market making, as manifested by the entry of nondealer firms since the early 2000s, may therefore also play a role in the post-crisis dealer balance sheet dynamics.
The picture that emerges is that post-crisis dealer asset growth represents the confluence of several issues. Our findings suggest that business-cycle factors (the hangover from the housing boom and bust and subsequent risk aversion) and secular trends (electronification and competitive entry) should be considered alongside tighter regulation in explaining stagnating dealer balance sheets.
Meanwhile, it was a positive day for the Canadian preferred share market with PerpetualDiscounts winning 92bp (due largely to a reversal of yesterday‘s nonsense with ELF.PR.G), FixedResets up 16bp and DeemedRetractibles gaining 10bp. The Performance Highlights table is enormous; there is a huge pool of losers (25 issues) balancing a slightly larger pool of winners (33 issues). Volume was average.
For as long as the FixedReset market is so violently unsettled, I’ll keep publishing updates of the more interesting and meaningful series of FixedResets’ Implied Volatilities. This doesn’t include Enbridge because although Enbridge has a large number of issues outstanding, all of which are quite liquid, the range of Issue Reset Spreads is too small for decent conclusions. The low is 212bp (ENB.PR.H; second-lowest is ENB.PR.D at 237bp) and the high is a mere 268 for ENB.PF.G.
Remember that all rich /cheap assessments are:
» based on Implied Volatility Theory only
» are relative only to other FixedResets from the same issuer
» assume constant GOC-5 yield
» assume constant Implied Volatility
» assume constant spread
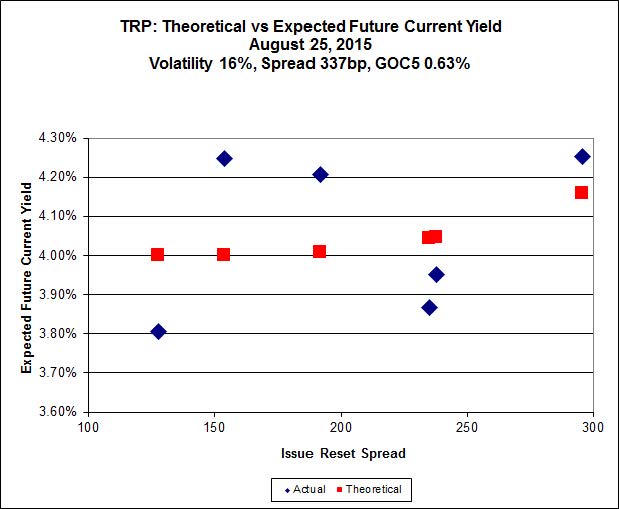
Here’s TRP:
Click for Big
Implied volatility dropped sharply to more normal, but still elevated, levels aided by a more rational quotation for TRP.PR.G (see discussion in the Performance Highlights table).
TRP.PR.E, which resets 2019-10-30 at +235, is bid at 19.26 to be $0.84 rich, while TRP.PR.C, resetting 2016-1-30 at +164, is $0.79 cheap at its bid price of 12.77.
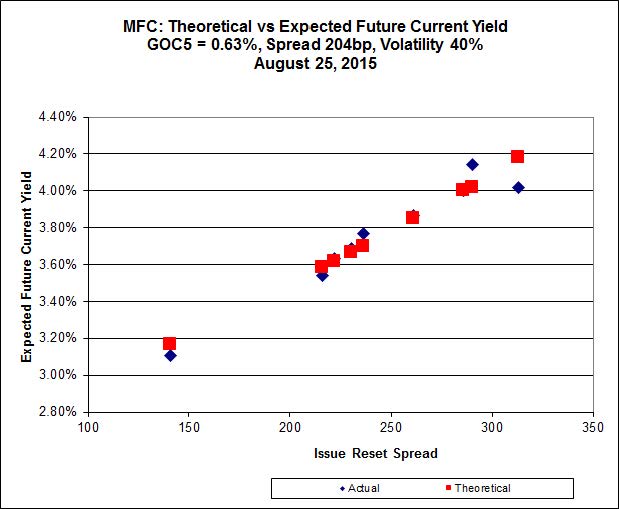
Click for Big
Another good fit today, while the series maintains its high level of Implied Volatility.
Most expensive is MFC.PR.H, resetting at +313bp on 2017-3-19, bid at 23.40 to be 0.91 rich, while MFC.PR.G, resetting at +290bp on 2016-12-19, bid at 21.30 to be 0.67 cheap.
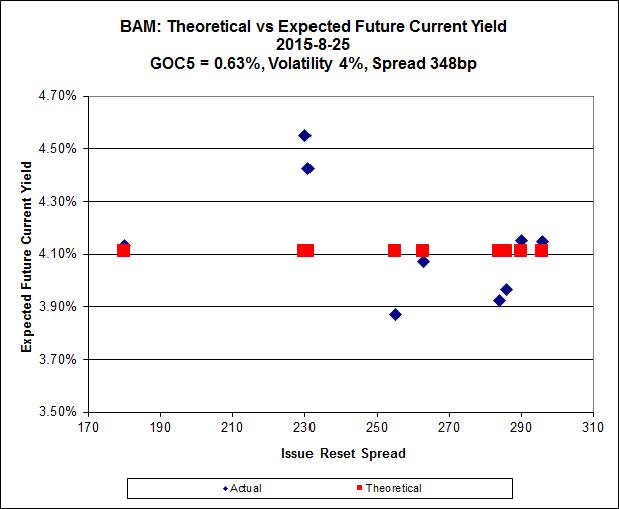
Click for Big
The fit on the BAM issues continues to be horrible.
The cheapest issue relative to its peers is BAM.PR.R, resetting at +230bp on 2016-6-30, bid at 16.10 to be $1.72 cheap. BAM.PF.E, resetting at +255bp on 2020-3-31 is bid at 20.55 and appears to be $1.21 rich.
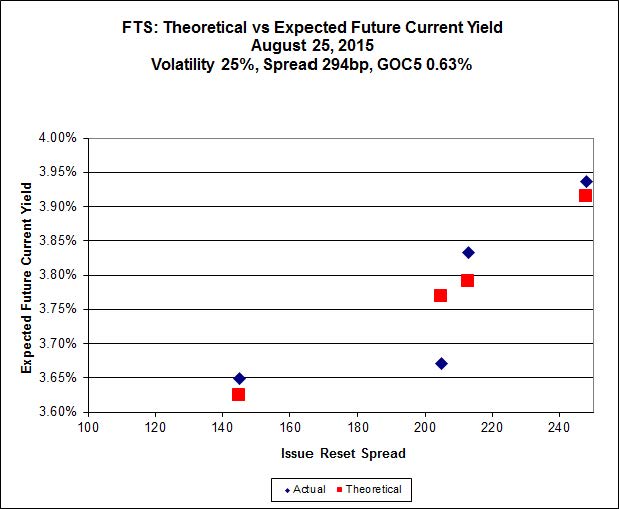
Click for Big
Implied Volatility dropped today, but remains unreasonably high.
FTS.PR.K, with a spread of +205bp, and bid at 18.25, looks $0.47 expensive and resets 2019-3-1. FTS.PR.G, with a spread of +213bp and resetting 2018-9-1, is bid at 18.00 and is $0.21 cheap.
Click for Big
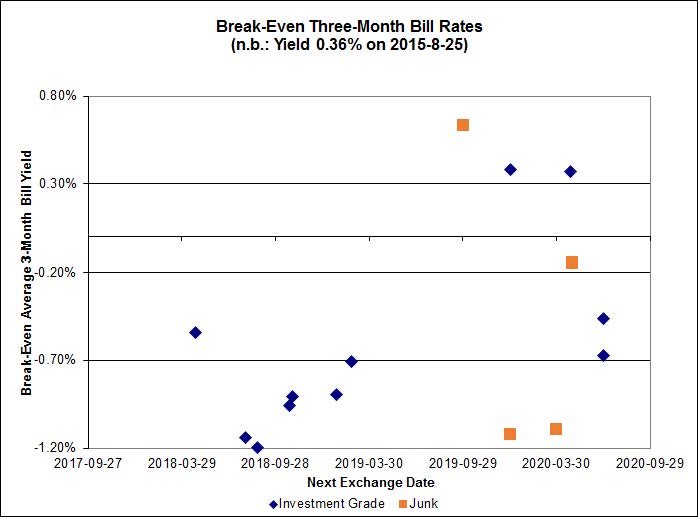
Investment-grade pairs predict an average three-month bill yield over the next five-odd years of -0.45%, with one outlier above +0.80%. Note that the distribution is bimodal, with NVCC non-compliant bank issues averaging -0.91% and the unregulated issues averaging +0.18%. There are three junk outliers below -1.20%.
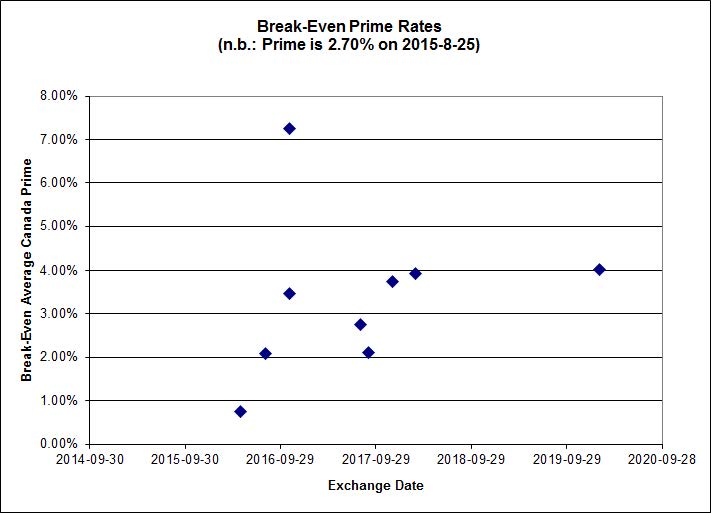
Click for Big
Shall we just say that this exhibits a high level of confidence in the continued rapacity of Canadian banks?
| HIMIPref™ Preferred Indices These values reflect the December 2008 revision of the HIMIPref™ Indices Values are provisional and are finalized monthly |
|||||||
| Index | Mean Current Yield (at bid) |
Median YTW |
Median Average Trading Value |
Median Mod Dur (YTW) |
Issues | Day’s Perf. | Index Value |
| Ratchet | 0.00 % | 0.00 % | 0 | 0.00 | 0 | 2.2874 % | 1,643.4 |
| FixedFloater | 0.00 % | 0.00 % | 0 | 0.00 | 0 | 2.2874 % | 2,873.4 |
| Floater | 4.46 % | 4.53 % | 57,332 | 16.29 | 3 | 2.2874 % | 1,747.0 |
| OpRet | 0.00 % | 0.00 % | 0 | 0.00 | 0 | 0.9906 % | 2,758.0 |
| SplitShare | 4.67 % | 5.27 % | 55,947 | 3.13 | 3 | 0.9906 % | 3,232.2 |
| Interest-Bearing | 0.00 % | 0.00 % | 0 | 0.00 | 0 | 0.9906 % | 2,521.9 |
| Perpetual-Premium | 5.75 % | 5.67 % | 64,403 | 14.08 | 9 | 0.5796 % | 2,474.4 |
| Perpetual-Discount | 5.54 % | 5.58 % | 78,687 | 14.54 | 29 | 0.9179 % | 2,551.1 |
| FixedReset | 5.05 % | 4.24 % | 200,589 | 15.44 | 87 | 0.1568 % | 2,090.6 |
| Deemed-Retractible | 5.21 % | 5.35 % | 97,635 | 5.57 | 34 | 0.1031 % | 2,540.3 |
| FloatingReset | 2.37 % | 3.59 % | 48,243 | 5.97 | 9 | 0.2358 % | 2,189.4 |
| Performance Highlights | |||
| Issue | Index | Change | Notes |
| FTS.PR.H | FixedReset | -4.04 % | YTW SCENARIO Maturity Type : Limit Maturity Maturity Date : 2045-08-25 Maturity Price : 14.25 Evaluated at bid price : 14.25 Bid-YTW : 3.81 % |
| CM.PR.Q | FixedReset | -3.38 % | YTW SCENARIO Maturity Type : Limit Maturity Maturity Date : 2045-08-25 Maturity Price : 21.66 Evaluated at bid price : 22.02 Bid-YTW : 3.93 % |
| BAM.PR.X | FixedReset | -3.29 % | YTW SCENARIO Maturity Type : Limit Maturity Maturity Date : 2045-08-25 Maturity Price : 14.70 Evaluated at bid price : 14.70 Bid-YTW : 4.55 % |
| PWF.PR.P | FixedReset | -2.75 % | YTW SCENARIO Maturity Type : Limit Maturity Maturity Date : 2045-08-25 Maturity Price : 15.56 Evaluated at bid price : 15.56 Bid-YTW : 3.63 % |
| SLF.PR.B | Deemed-Retractible | -2.55 % | YTW SCENARIO Maturity Type : Hard Maturity Maturity Date : 2025-01-31 Maturity Price : 25.00 Evaluated at bid price : 21.02 Bid-YTW : 7.12 % |
| GWO.PR.N | FixedReset | -2.44 % | YTW SCENARIO Maturity Type : Hard Maturity Maturity Date : 2025-01-31 Maturity Price : 25.00 Evaluated at bid price : 15.17 Bid-YTW : 8.18 % |
| BAM.PF.G | FixedReset | -2.17 % | YTW SCENARIO Maturity Type : Limit Maturity Maturity Date : 2045-08-25 Maturity Price : 21.72 Evaluated at bid price : 22.11 Bid-YTW : 4.23 % |
| ENB.PR.Y | FixedReset | -2.13 % | YTW SCENARIO Maturity Type : Limit Maturity Maturity Date : 2045-08-25 Maturity Price : 14.71 Evaluated at bid price : 14.71 Bid-YTW : 5.51 % |
| ENB.PF.C | FixedReset | -1.90 % | YTW SCENARIO Maturity Type : Limit Maturity Maturity Date : 2045-08-25 Maturity Price : 16.00 Evaluated at bid price : 16.00 Bid-YTW : 5.58 % |
| MFC.PR.G | FixedReset | -1.80 % | YTW SCENARIO Maturity Type : Hard Maturity Maturity Date : 2025-01-31 Maturity Price : 25.00 Evaluated at bid price : 21.30 Bid-YTW : 5.68 % |
| W.PR.J | Perpetual-Discount | -1.79 % | YTW SCENARIO Maturity Type : Limit Maturity Maturity Date : 2045-08-25 Maturity Price : 23.27 Evaluated at bid price : 23.57 Bid-YTW : 6.02 % |
| ENB.PR.A | Perpetual-Discount | -1.76 % | YTW SCENARIO Maturity Type : Limit Maturity Maturity Date : 2045-08-25 Maturity Price : 23.82 Evaluated at bid price : 24.07 Bid-YTW : 5.73 % |
| BMO.PR.T | FixedReset | -1.73 % | YTW SCENARIO Maturity Type : Limit Maturity Maturity Date : 2045-08-25 Maturity Price : 21.05 Evaluated at bid price : 21.05 Bid-YTW : 3.65 % |
| MFC.PR.N | FixedReset | -1.59 % | YTW SCENARIO Maturity Type : Hard Maturity Maturity Date : 2025-01-31 Maturity Price : 25.00 Evaluated at bid price : 19.86 Bid-YTW : 6.30 % |
| BAM.PF.F | FixedReset | -1.57 % | YTW SCENARIO Maturity Type : Limit Maturity Maturity Date : 2045-08-25 Maturity Price : 21.68 Evaluated at bid price : 22.00 Bid-YTW : 4.23 % |
| MFC.PR.L | FixedReset | -1.50 % | YTW SCENARIO Maturity Type : Hard Maturity Maturity Date : 2025-01-31 Maturity Price : 25.00 Evaluated at bid price : 19.70 Bid-YTW : 6.29 % |
| ENB.PF.G | FixedReset | -1.49 % | YTW SCENARIO Maturity Type : Limit Maturity Maturity Date : 2045-08-25 Maturity Price : 16.50 Evaluated at bid price : 16.50 Bid-YTW : 5.50 % |
| MFC.PR.M | FixedReset | -1.44 % | YTW SCENARIO Maturity Type : Hard Maturity Maturity Date : 2025-01-31 Maturity Price : 25.00 Evaluated at bid price : 19.85 Bid-YTW : 6.38 % |
| NA.PR.S | FixedReset | -1.42 % | YTW SCENARIO Maturity Type : Limit Maturity Maturity Date : 2045-08-25 Maturity Price : 20.85 Evaluated at bid price : 20.85 Bid-YTW : 3.87 % |
| RY.PR.M | FixedReset | -1.32 % | YTW SCENARIO Maturity Type : Limit Maturity Maturity Date : 2045-08-25 Maturity Price : 21.42 Evaluated at bid price : 21.71 Bid-YTW : 3.82 % |
| ENB.PR.F | FixedReset | -1.28 % | YTW SCENARIO Maturity Type : Limit Maturity Maturity Date : 2045-08-25 Maturity Price : 14.63 Evaluated at bid price : 14.63 Bid-YTW : 5.61 % |
| MFC.PR.K | FixedReset | -1.26 % | YTW SCENARIO Maturity Type : Hard Maturity Maturity Date : 2025-01-31 Maturity Price : 25.00 Evaluated at bid price : 19.62 Bid-YTW : 6.23 % |
| PWF.PR.L | Perpetual-Discount | -1.18 % | YTW SCENARIO Maturity Type : Limit Maturity Maturity Date : 2045-08-25 Maturity Price : 23.27 Evaluated at bid price : 23.53 Bid-YTW : 5.46 % |
| RY.PR.H | FixedReset | -1.13 % | YTW SCENARIO Maturity Type : Limit Maturity Maturity Date : 2045-08-25 Maturity Price : 21.02 Evaluated at bid price : 21.02 Bid-YTW : 3.67 % |
| TD.PF.C | FixedReset | -1.11 % | YTW SCENARIO Maturity Type : Limit Maturity Maturity Date : 2045-08-25 Maturity Price : 20.51 Evaluated at bid price : 20.51 Bid-YTW : 3.75 % |
| RY.PR.O | Perpetual-Discount | 1.09 % | YTW SCENARIO Maturity Type : Limit Maturity Maturity Date : 2045-08-25 Maturity Price : 23.68 Evaluated at bid price : 24.01 Bid-YTW : 5.15 % |
| FTS.PR.G | FixedReset | 1.12 % | YTW SCENARIO Maturity Type : Limit Maturity Maturity Date : 2045-08-25 Maturity Price : 18.00 Evaluated at bid price : 18.00 Bid-YTW : 4.07 % |
| PWF.PR.R | Perpetual-Premium | 1.15 % | YTW SCENARIO Maturity Type : Limit Maturity Maturity Date : 2045-08-25 Maturity Price : 24.19 Evaluated at bid price : 24.68 Bid-YTW : 5.61 % |
| FTS.PR.J | Perpetual-Discount | 1.15 % | YTW SCENARIO Maturity Type : Limit Maturity Maturity Date : 2045-08-25 Maturity Price : 21.69 Evaluated at bid price : 22.00 Bid-YTW : 5.41 % |
| RY.PR.N | Perpetual-Discount | 1.20 % | YTW SCENARIO Maturity Type : Limit Maturity Maturity Date : 2045-08-25 Maturity Price : 24.09 Evaluated at bid price : 24.45 Bid-YTW : 5.09 % |
| BAM.PF.E | FixedReset | 1.23 % | YTW SCENARIO Maturity Type : Limit Maturity Maturity Date : 2045-08-25 Maturity Price : 20.55 Evaluated at bid price : 20.55 Bid-YTW : 4.29 % |
| ENB.PR.B | FixedReset | 1.25 % | YTW SCENARIO Maturity Type : Limit Maturity Maturity Date : 2045-08-25 Maturity Price : 13.81 Evaluated at bid price : 13.81 Bid-YTW : 5.66 % |
| SLF.PR.E | Deemed-Retractible | 1.28 % | YTW SCENARIO Maturity Type : Hard Maturity Maturity Date : 2025-01-31 Maturity Price : 25.00 Evaluated at bid price : 20.53 Bid-YTW : 7.11 % |
| POW.PR.D | Perpetual-Discount | 1.30 % | YTW SCENARIO Maturity Type : Limit Maturity Maturity Date : 2045-08-25 Maturity Price : 22.32 Evaluated at bid price : 22.59 Bid-YTW : 5.60 % |
| CU.PR.C | FixedReset | 1.34 % | YTW SCENARIO Maturity Type : Limit Maturity Maturity Date : 2045-08-25 Maturity Price : 21.10 Evaluated at bid price : 21.10 Bid-YTW : 3.68 % |
| PVS.PR.C | SplitShare | 1.35 % | YTW SCENARIO Maturity Type : Hard Maturity Maturity Date : 2017-12-10 Maturity Price : 25.00 Evaluated at bid price : 24.75 Bid-YTW : 5.27 % |
| RY.PR.I | FixedReset | 1.39 % | YTW SCENARIO Maturity Type : Hard Maturity Maturity Date : 2022-01-31 Maturity Price : 25.00 Evaluated at bid price : 24.80 Bid-YTW : 3.24 % |
| PWF.PR.F | Perpetual-Discount | 1.39 % | YTW SCENARIO Maturity Type : Limit Maturity Maturity Date : 2045-08-25 Maturity Price : 23.69 Evaluated at bid price : 24.00 Bid-YTW : 5.51 % |
| BAM.PR.K | Floater | 1.45 % | YTW SCENARIO Maturity Type : Limit Maturity Maturity Date : 2045-08-25 Maturity Price : 10.50 Evaluated at bid price : 10.50 Bid-YTW : 4.56 % |
| HSE.PR.A | FixedReset | 1.45 % | YTW SCENARIO Maturity Type : Limit Maturity Maturity Date : 2045-08-25 Maturity Price : 13.26 Evaluated at bid price : 13.26 Bid-YTW : 4.67 % |
| ELF.PR.F | Perpetual-Discount | 1.49 % | YTW SCENARIO Maturity Type : Limit Maturity Maturity Date : 2045-08-25 Maturity Price : 22.24 Evaluated at bid price : 22.51 Bid-YTW : 5.96 % |
| RY.PR.W | Perpetual-Discount | 1.51 % | YTW SCENARIO Maturity Type : Limit Maturity Maturity Date : 2045-08-25 Maturity Price : 23.97 Evaluated at bid price : 24.22 Bid-YTW : 5.07 % |
| BAM.PR.N | Perpetual-Discount | 1.65 % | YTW SCENARIO Maturity Type : Limit Maturity Maturity Date : 2045-08-25 Maturity Price : 20.30 Evaluated at bid price : 20.30 Bid-YTW : 5.96 % |
| POW.PR.B | Perpetual-Discount | 1.67 % | YTW SCENARIO Maturity Type : Limit Maturity Maturity Date : 2045-08-25 Maturity Price : 23.48 Evaluated at bid price : 23.75 Bid-YTW : 5.70 % |
| BMO.PR.S | FixedReset | 1.90 % | YTW SCENARIO Maturity Type : Limit Maturity Maturity Date : 2045-08-25 Maturity Price : 21.45 Evaluated at bid price : 21.45 Bid-YTW : 3.67 % |
| POW.PR.G | Perpetual-Premium | 2.25 % | YTW SCENARIO Maturity Type : Limit Maturity Maturity Date : 2045-08-25 Maturity Price : 24.45 Evaluated at bid price : 24.95 Bid-YTW : 5.67 % |
| HSE.PR.C | FixedReset | 2.45 % | YTW SCENARIO Maturity Type : Limit Maturity Maturity Date : 2045-08-25 Maturity Price : 20.90 Evaluated at bid price : 20.90 Bid-YTW : 4.78 % |
| BAM.PR.C | Floater | 2.63 % | YTW SCENARIO Maturity Type : Limit Maturity Maturity Date : 2045-08-25 Maturity Price : 10.55 Evaluated at bid price : 10.55 Bid-YTW : 4.53 % |
| MFC.PR.J | FixedReset | 2.65 % | YTW SCENARIO Maturity Type : Hard Maturity Maturity Date : 2025-01-31 Maturity Price : 25.00 Evaluated at bid price : 20.95 Bid-YTW : 5.69 % |
| ENB.PR.T | FixedReset | 2.65 % | YTW SCENARIO Maturity Type : Limit Maturity Maturity Date : 2045-08-25 Maturity Price : 15.10 Evaluated at bid price : 15.10 Bid-YTW : 5.50 % |
| BAM.PR.B | Floater | 2.79 % | YTW SCENARIO Maturity Type : Limit Maturity Maturity Date : 2045-08-25 Maturity Price : 10.70 Evaluated at bid price : 10.70 Bid-YTW : 4.47 % |
| BAM.PR.R | FixedReset | 3.07 % | YTW SCENARIO Maturity Type : Limit Maturity Maturity Date : 2045-08-25 Maturity Price : 16.10 Evaluated at bid price : 16.10 Bid-YTW : 4.78 % |
| BAM.PF.B | FixedReset | 4.49 % | YTW SCENARIO Maturity Type : Limit Maturity Maturity Date : 2045-08-25 Maturity Price : 20.01 Evaluated at bid price : 20.01 Bid-YTW : 4.36 % |
| TRP.PR.B | FixedReset | 4.58 % | YTW SCENARIO Maturity Type : Limit Maturity Maturity Date : 2045-08-25 Maturity Price : 12.55 Evaluated at bid price : 12.55 Bid-YTW : 3.95 % |
| HSE.PR.E | FixedReset | 4.61 % | YTW SCENARIO Maturity Type : Limit Maturity Maturity Date : 2045-08-25 Maturity Price : 21.66 Evaluated at bid price : 22.00 Bid-YTW : 4.90 % |
| TRP.PR.C | FixedReset | 5.02 % | YTW SCENARIO Maturity Type : Limit Maturity Maturity Date : 2045-08-25 Maturity Price : 12.77 Evaluated at bid price : 12.77 Bid-YTW : 4.32 % |
| TRP.PR.G | FixedReset | 12.17 % | Simply a correction of yesterday‘s nonsensical quote. YTW SCENARIO Maturity Type : Limit Maturity Maturity Date : 2045-08-25 Maturity Price : 21.10 Evaluated at bid price : 21.10 Bid-YTW : 4.32 % |
| ELF.PR.G | Perpetual-Discount | 17.97 % | Simply a correction of yesterday‘s nonsensical quote. YTW SCENARIO Maturity Type : Limit Maturity Maturity Date : 2045-08-25 Maturity Price : 21.40 Evaluated at bid price : 21.40 Bid-YTW : 5.63 % |
| Volume Highlights | |||
| Issue | Index | Shares Traded |
Notes |
| HSB.PR.D | Deemed-Retractible | 115,500 | RBC crossed 112,400 at 24.99. YTW SCENARIO Maturity Type : Hard Maturity Maturity Date : 2022-01-31 Maturity Price : 25.00 Evaluated at bid price : 24.85 Bid-YTW : 5.28 % |
| BNS.PR.Q | FixedReset | 71,649 | Nesbitt crossed 25,000 at 25.00; TD sold 13,000 to anonymous at the same price. YTW SCENARIO Maturity Type : Hard Maturity Maturity Date : 2022-01-31 Maturity Price : 25.00 Evaluated at bid price : 24.90 Bid-YTW : 3.10 % |
| BMO.PR.T | FixedReset | 55,912 | Scotia crossed 24,500 at 21.20. YTW SCENARIO Maturity Type : Limit Maturity Maturity Date : 2045-08-25 Maturity Price : 21.05 Evaluated at bid price : 21.05 Bid-YTW : 3.65 % |
| RY.PR.F | Deemed-Retractible | 52,083 | Nesbitt crossed 50,000 at 24.98. YTW SCENARIO Maturity Type : Hard Maturity Maturity Date : 2022-01-31 Maturity Price : 25.00 Evaluated at bid price : 24.96 Bid-YTW : 4.50 % |
| TD.PF.C | FixedReset | 46,503 | TD crossed 25,000 at 20.78. YTW SCENARIO Maturity Type : Limit Maturity Maturity Date : 2045-08-25 Maturity Price : 20.51 Evaluated at bid price : 20.51 Bid-YTW : 3.75 % |
| ENB.PR.T | FixedReset | 40,812 | YTW SCENARIO Maturity Type : Limit Maturity Maturity Date : 2045-08-25 Maturity Price : 15.10 Evaluated at bid price : 15.10 Bid-YTW : 5.50 % |
| There were 33 other index-included issues trading in excess of 10,000 shares. | |||
| Wide Spread Highlights | ||
| Issue | Index | Quote Data and Yield Notes |
| TD.PF.C | FixedReset | Quote: 20.51 – 22.00 Spot Rate : 1.4900 Average : 0.8454 YTW SCENARIO |
| HSE.PR.G | FixedReset | Quote: 22.05 – 23.69 Spot Rate : 1.6400 Average : 1.0798 YTW SCENARIO |
| TRP.PR.A | FixedReset | Quote: 15.15 – 16.20 Spot Rate : 1.0500 Average : 0.6557 YTW SCENARIO |
| BAM.PF.F | FixedReset | Quote: 22.00 – 22.90 Spot Rate : 0.9000 Average : 0.5698 YTW SCENARIO |
| ENB.PR.A | Perpetual-Discount | Quote: 24.07 – 24.80 Spot Rate : 0.7300 Average : 0.4483 YTW SCENARIO |
| CM.PR.Q | FixedReset | Quote: 22.02 – 22.95 Spot Rate : 0.9300 Average : 0.6495 YTW SCENARIO |