Category: Interesting External Papers

Interesting External Papers

Excess Reserves at Fed

The Federal Reserve Bank of New York has released a paper by Todd Keister and James J. McAndrews titled Why Are Banks Holding So Many Excess Reserves?:

The buildup of reserves in the U.S. banking system during the financial crisis has fueled concerns that the Federal Reserve’s policies may have failed to stimulate the flow of credit in the economy: banks, it appears, are amassing funds rather than lending them out. However, a careful examination of the balance sheet effects of central bank actions shows that the high level of reserves is simply a by-product of the Fed’s new lending facilities and asset purchase programs. The total quantity of reserves in the banking system reflects the scale of the Fed’s policy initiatives, but conveys no information about the initiatives’ effects on bank lending or on the economy more broadly.

They quote a lot of commentary decrying the build-up of reserves, but state:

In this edition of Current Issues, we argue that the concerns about high levels of reserves are largely unwarranted. Using a series of simple examples, we show how central bank liquidity facilities and other credit programs create—essentially as a by-product—a large quantity of reserves. While the level of required reserves may change modestly with changes in bank lending behavior, the vast majority of the newly created reserves will end up being held as excess reserves regardless of how banks react to the new programs. In other words, the substantial buildup of reserves depicted in the chart reflects the large scale of the Federal Reserve’s policy initiatives, but says little or nothing about the programs’ effects on bank lending or on the economy more broadly.

One casual comment of interest is:

Note the important economic role of interbank lending in this example: it allows funds to flow to their most productive uses, regardless of which bank received the initial deposits.

This, presumably, is a justification for encouraging interbank lending in the BIS Capital Ratios (which allow one bank’s holdings of another bank’s paper to be risk-weighted according to the credit rating of the borrowing bank’s sovereign authority. I would dearly love to see this issue thoroughly discussed; to me, it seems to have had the effect of increasing contagion.

Anyway: in normal times, Bank A has lent to Bank B:

But in stressed times, the inter-bank market fails and the Fed lends to Bank B (via a credit to their reserve account), which repays Bank A by transfer of reserves:

The authors explain:

This simple example illustrates how a central bank’s extension of credit to banks during a financial crisis creates, as a by-product, a large quantity of excess reserves. Merely looking at the aggregate data on bank reserves might lead one to conclude that the central bank’s policy did nothing to promote bank lending, since all of the $40 lent by the central bank ended up being held as excess reserves. The example shows that this conclusion would be unwarranted. In fact, the central bank’s action was highly effective: it prevented Bank B from having to reduce its lending to firms and households by $40.

There are, as always, knock-on effects:

Actions by a central bank that change the quantity of reserves in the banking system also tend to change the level of interest rates. Traditionally, bank reserves did not earn any interest. If Bank A earns no interest on the reserves it is holding in Exhibit 2, it will have an incentive to lend out its excess reserves or to use them to buy other short-term assets. These activities will, in turn, decrease short-term market interest rates and hence may lead to an increase in inflationary pressures.

The Central Bank may therefore choose to sterilize its market action by selling interest-bearing bonds from its holdings to Bank A – or it can achieve a similar policy objective by paying interest on excess reserves.

The authors conclude:

We began this article by asking, Why are banks holding so many excess reserves? We then used a series of simple examples to answer this question in two steps. First, we showed that the liquidity facilities and other credit programs introduced by the Federal Reserve in response to the crisis have created, as a by-product, a large quantity of reserves in the banking system. Second, we showed that while the lending decisions and other activities of banks may result in small changes in the level of required reserves, the vast majority of the newly created reserves will end up being held as excess reserves. The dramatic buildup of excess reserves reflects the large scale of the Federal Reserve’s policy initiatives; it conveys no information about the effects of these initiatives on bank lending or on the level of economic activity.

We also discussed the importance of paying interest on reserves when the level of excess reserves is unusually high, as the Federal Reserve began to do in October 2008. Paying interest on reserves allows a central bank to maintain its influence over market interest rates irrespective of the quantity of reserves in the banking system. The central bank can then scale its policy initiatives according to conditions in the financial sector, while setting its target for the short-term interest rate in response to macroeconomic conditions. This ability to separate short-term interest rates from the quantity of reserves is particularly important during the recovery from a financial crisis. If inflationary pressures begin to appear while the crisis-related programs are still in place, the central bank can use its interest-on-reserves policy to raise interest rates without necessarily removing all of the newly created reserves.

Interesting External Papers

BoC Discusses Bank Leverage Ratio Management

The Bank of Canada has released a discussion paper by Etienne Bordeleau, Allan Crawford, and Christopher Graham titled Regulatory Constraints on Bank Leverage: Issues and Lessons from the Canadian Experience:

The Basel capital framework plays an important role in risk management by linking a bank’s minimum capital requirements to the riskiness of its assets. Nevertheless, the risk estimates underlying these calculations may be imperfect, and it appears that a cyclical bias in measures of risk-adjusted capital contributed to procyclical increases in global leverage prior to the recent financial crisis. As such, international policy discussions are considering an unweighted leverage ratio as a supplement to existing risk-weighted capital requirements. Canadian banks offer a useful case study in this respect, having been subject to a regulatory ceiling on an unweighted leverage ratio since the early 1980s. The authors review lessons from the Canadian experience with leverage constraints, and provide some empirical analysis on how such constraints affect banks’ leverage management. In contrast to a number of countries without regulatory constraints, leverage at major Canadian banks was relatively stable leading up to the crisis, reducing pressure for deleveraging during the economic downturn. Empirical results suggest that major Canadian banks follow different strategies for managing their leverage. Some banks tend to raise their precautionary buffer quickly, through sharp reductions in asset growth and faster capital growth, when a shock pushes leverage too close to its authorized limit. For other banks, shocks have more persistent effects on leverage, possibly because these banks tend to have higher buffers on average. Overall, the authors’ results suggest that a leverage ceiling would be a useful tool to complement risk-weighted measures and mitigate procyclical tendencies in the financial system.

The authors conclude:

Empirical analysis provides evidence that banks follow different strategies for managing their leverage buffers. Some banks tend to raise their buffers very quickly when a shock pushes leverage too close to its authorized limit (as might occur during a cyclical upturn). These adjustments are achieved through sharp reductions in asset growth and faster growth in capital. At other banks, shocks have more persistent effects on leverage, which could be explained by the fact that these banks tend to have higher buffers on average.

There’s not a lot of meat in the paper, but it’s a start. Lord knows, we’re nevery going to see any honest analysis out of OSFI!

Interesting External Papers

Effective Fed Funds and Interest on Excess Reserves

The Federal Reserve Bank of New York has released a staff report by Morten L. Bech and Elizabeth Klee titled The Mechanics of a Graceful Exit: Interest on Reserves and Segmentation in the Federal Funds Market:

To combat the financial crisis that intensified in the fall of 2008, the Federal Reserve injected a substantial amount of liquidity into the banking system. The resulting increase in reserve balances exerted downward price pressure in the federal funds market, and the effective federal funds rate began to deviate from the target rate set by the Federal Open Market Committee. In response, the Federal Reserve revised its operational framework for implementing monetary policy and began to pay interest on reserve balances in an attempt to provide a floor for the federal funds rate. Nevertheless, following the policy change, the effective federal funds rate remained below not only the target but also the rate paid on reserve balances. We develop a model to explain this phenomenon and use data from the federal funds market to evaluate it empirically. In turn, we show how successful the Federal Reserve may be in raising the federal funds rate even in an environment with substantial reserve balances.

This issue has been discussed on PrefBlog before, two posts being Effective Fed Funds Rate Continues to Confuse and Effective Fed Funds Rate: A Technical Explanation?.

The authors state the problem succinctly:

Between the October and December 2008 FOMC meetings the average effective federal funds rate was 32 basis points, while the target was 1 percent; the interest rate paid on reserves was 65 basis points or higher for the entire period. This deviation from the theoretical prediction was surprising for even the most astute observers of the federal funds market (Hamilton, 2008, for example). Why did interest on reserves provide an imperfect floor for the federal funds rate, even after the policy was changed so that the interest rate paid on reserves was set equal to the target rate?2 Why would any financial institution lend out funds below the rate paid by the central bank? And even if that were the case, arbitrageurs would surely relish the opportunity of making a pure profit by borrowing cheaply in the market and placing the proceeds with the central bank, and by doing so, move the market rate toward the floor.

… and propose:

The explanation for the puzzling outcome is at least threefold. First, not all participants in the federal funds market are eligible to receive interest on their reserve balances. Government-sponsored enterprises (GSEs) in particular, which are significant sellers of funds on a daily basis, are not legally eligible to receive interest on balances held with Reserve Banks. This heterogeneity across participants created a segmented market with different rate dynamics. Second, banks’ apparent general unwillingness or inability to engage in arbitrage has produced a market structure in which those banks that are willing and able to buy funds from the GSEs have been able to exercise bargaining power and pay the GSEs rates below the interest rate paid on reserves. The lack of arbitrage possibly has been driven in part by banks seeking to control the size of their balance sheet more closely in part to avoid stressing regulatory capital and leverage ratios, as mentioned in Bernanke (2009a). Third, a combination of financial consolidation, credit losses, and changes to risk management practices has led at least some GSEs to limit their number of counterparties in the money market and to tighten credit lines. This trimming of potential trading partners has likely decreased bargaining power with the remaining counterparties. In addition, the GSEs have become a larger share of the federal funds market in recent history and hence have pulled down the weighted average federal funds rate.

The paper is organized as:

First, we briefly discuss the institutional details of the federal funds market. Second, we turn to the history and implementation of the interest-on-reserves regime. Third, we present our model of a bifurcated federal funds market with banks and GSEs. We also sketch out how the model can be extended to describe a trifurcated market in which some banks are slow to adopt the new policy regime. Fourth, we calibrate our model to federal funds market data and back out the relative bargaining power of the different market participants. Fifth, we explore the factors that affect our computed bargaining parameters. We show that the level and distribution of reserve balances, rates in other overnight funding markets, and the riskiness of the buyers all have significant predictive power in explaining the bargaining power of the different types of sellers. With this information, in our sixth section, we forecast the effective federal funds rate under a variety of exit scenarios from the current accommodative stance of monetary policy. The seventh section concludes and offers directions for further research.

Interesting External Papers

Securitization: BIS Examines New Century Capital

The Bank for International Settlements has released a working paper by Allen B Frankel titled The risk of relying on reputational capital: a case study of the 2007 failure of New Century Financial:

The quality of newly originated subprime mortgages had been visibly deteriorating for some time before the window for such loans was shut in 2007. Nevertheless, a bankruptcy court’s directed ex post examination of New Century Financial, one of the largest originators of subprime mortgages, discovered no change, over time, in how that firm went about its business. This paper employs the court examiner’s findings in a critical review of the procedures used by various agents involved in the origination and securitisation of subprime mortgages. A contribution of this paper is its elaboration of the choices and incentives faced by the various types of institutions involved in those linked processes of origination and securitisation. It highlights the limited roles played by the originators of subprime loans in screening borrowers and in bearing losses on defective loans that had been sold to securitisers of pooled loan packages (ie, mortgage-backed securities). It also illustrates the willingness of the management of those institutions that became key players in that market to put their reputations with fixed-income investor clients in jeopardy. What is perplexing is that such risk exposures were accepted by investing firms that had the wherewithal and knowledge to appreciate the overall paucity of due diligence in the loan origination processes. This observation, in turn, points to the conclusion that the subprime episode is a case in which reputational capital, a presumptively effective motivator of market discipline, was not an effective incentive device.

The end of the road for New Century came when:

Purchasers of New Century’s loan production normally conducted a due diligence examination after a sales agreement had been reached. The investor, or a due diligence firm hired by the investor, would review loan files to determine whether the loan was underwritten according to the pool’s guidelines. Loans not meeting guidelines could be excluded from the loan bundle (kicked out) and returned to the originator.

Once kicked out, the mortgages were known as a “scratch and dent” (S&D) loans, which were purchased by specialised investors at a large discount to their principal balance. Consequently, one measure of the deterioration of the quality of New Century’s loan production is the percentage of S&D loan sales. In 2004 and 2005, such sales amounted to less than 0.5% of New Century’s secondary market transactions. By contrast, in the first three quarters of 2006, S&D loan sales accounted for 2.1% of such transactions (Missal (2008, p. 68)).

The upsurge in loan repurchase requests to New Century coincided with a change in the methodology employed to estimate its allowance for loan repurchase losses. New Century’s board learned of the change after a considerable delay. This discovery was followed, after a few days, by a public announcement on 7 February 2007 that New Century’s results for the three quarters of 2006 needed to be restated. It also noted an expectation that losses would continue due to heightened early payment default (EPD) rates.

New Century’s announcement prompted margin calls by many of its warehouse lenders and requests for accelerated loan repurchases. Soon, all of New Century’s warehouse lenders ceased providing new funding. Because simultaneous margin calls by its warehouse lenders could not be met, New Century filed for bankruptcy on April 2, 2007. It ceased to originate mortgages and entered into an agreement to sell off its loan servicing businesses.

Amusingly, in the light of the current bonus hysteria:

The examiner’s access to internal New Century documents provided valuable insights into how the appearance of the warning flags influenced, or did not influence, management. For example, the examiner could find no reference to loan quality in the internal documents that described New Century’s bonus compensation system for regional managers for 2005 and 2006 (Missal (2008, p. 147)). The examiner says that the compensation of New Century’s loan production executives was directly and solely related to the amount of mortgage loans originated, loans that, in turn, were subsequently sold or securitised.32 Likewise, the examiner found no mention of penalties (reduced commission payments to loan production staff) that would be assessed against defective loans that required price discounts for secondary market sale.

Heightened investor concerns about the performance of subprime loans were reflected in changes in their due diligence processes (Missal (2008, p. 165)). Historically, investors would ask due diligence firms to examine, on their behalf, only a small sample of loans in a particular pool. The character of the process first changed in 2006 when most investors began to look at the appraisal documents in all loan files in a loan pool. Investors then increased the share of loan files examined. This intensification of due diligence efforts was responsible for a sharp increase in New Century’s kickout rate from 6.9% in January 2006 to 14.95% in December 2006 (Missal (2008, p. 161)).

The author concludes:

The examiner’s report suggests that some of the actions undertaken to improve loan quality in late 2006 and early 2007 were designed to anticipate new credit risk concerns among New Century’s counterparties. Nonetheless, when New Century announced a need to recast its financial reports, there had not yet been a defection by any of its largest counterparties. Not surprisingly, defections ensued immediately after the announcement. In those circumstances, the bunching of defections probably signalled an absence of attention on the part of counterparties to the mounting risks of ongoing transactions with New Century. In turn, the evidence of ineffective counterparty risk management has led to concerns about the effectiveness of existing governance structures (corporate and regulatory) and, in particular, reputational capital as an incentive device. Can those structures now be relied on to discipline the risk-taking incentives of those involved in underwriting securities backed by subprime (and other risky) assets?

Interesting External Papers

BoE Releases December 2009 Financial Stability Report

The Bank of Engand has released the December 2009 Financial Stability Report, with the usual tip-top analysis.

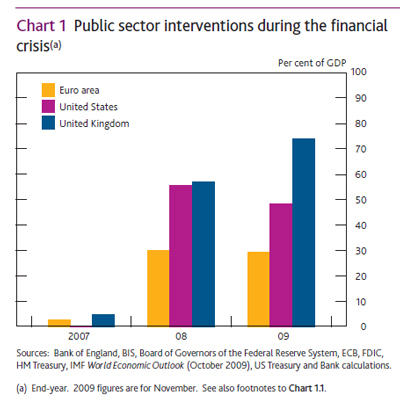
The first chart puts things into perspective: the UK is a smaller economy than the US or the Continent:

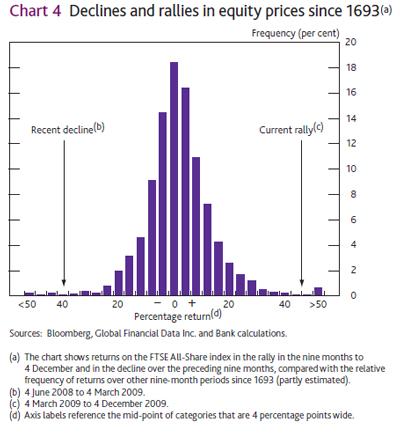
Who but the Old Lady of Threadneedle Street would dare produce an equity returns graph dating back to 1693?

UK banks are strongly encouraged to sell equity:

Despite inevitable short-term costs, there is a strong case for banks acting now to improve balance sheet positions while conditions are favourable. Retaining a higher share of current buoyant earnings could significantly increase banks’ resilience and ability to lend. If discretionary distributions had been 20% lower per year between 2000 and 2008, banks would have generated around £75 billion of additional capital — more than provided by the public sector during the crisis. It is also an opportune time for banks to raise capital externally, extend the maturity of their funding, and develop and implement plans for refinancing substantial sums as official sector support is withdrawn.

The bank is also throwing its weight behind Contingent Capital and leverage caps:

Capital buffers will need to rise, possibly substantially, over the coming years. The quality of banks’ capital also needs to improve. To absorb losses, capital should comprise equity or instruments that convert to equity automatically under pre-defined conditions. To avoid excessive reliance on refined regulatory risk weights, risk-based capital requirements should be accompanied by a mandatory maximum leverage ratio (Box 6).

They’ve done some work to see how much capital should be required going forward:

On average, a pre-crisis Tier 1 capital ratio of around 8.5% would have been needed by banks in the sample to avoid going below a Tier 1 capital ratio of 4% during the crisis (Chart A). Minimum capital requirements are likely to be higher in the future.

A feature of this analysis is the wide variation in results across banks, shown by the distributions in Chart A. Banks with similar pre-crisis Tier 1 capital ratios faced different outcomes in some cases. Even if all banks in the sample had a pre-crisis capital ratio of 8.5%, 40% of the banks would still have breached the 4% Tier 1 capital ratio in-crisis. The highest pre-crisis Tier 1 capital ratio that would have been needed across the sample of banks to maintain a 4% Tier 1 capital ratio in-crisis is around 18%. This variation across banks suggests the need for flexibility in their future capital structure and potentially a higher average buffer. In principle, this could be achieved through greater use of contingent capital (see Section 3).

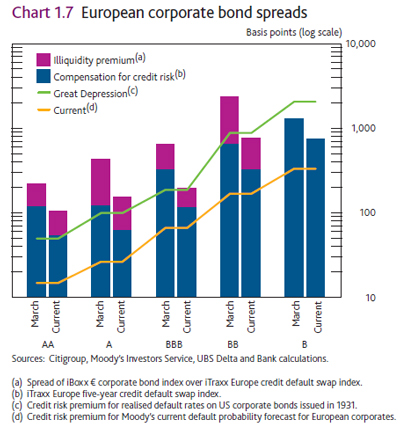
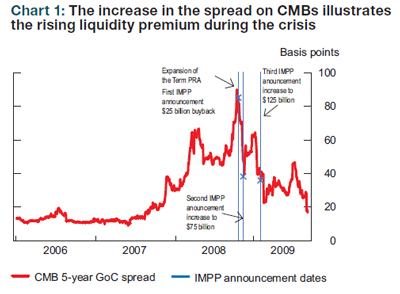
Oddly, they have a chart decomposing credit spreads according to the BoC methodology, which I dislike, as opposed to the Webber & Churm methodology used in the past:

There is no explanation in the report regarding the change.

There are big problems with loan-to-value ratios on commercial property … or there would be if they were recognized!

The sharp declines in capital values have triggered breaches of loan to value (LTV) covenants, with some loans in negative equity. Estimates from the Property Industry Alliance (PIA) suggest that average LTVs could reach 114% by end-2010.

As well as causing covenant breaches, declines in values (and rises in LTVs) will also have reduced firms’ access to credit by reducing the value of the commercial property that they might use as collateral for secured borrowing. Market contacts suggest that banks have been willing, to date, to show forbearance in respect of breaches of LTV covenants. In addition, research by De Montfort University suggests that, while loans are still performing, some lenders have not sought to revalue underlying properties. As a result, the sharp declines in capital values alone had a fairly limited impact on banks.

Footnote: The PIA is an alliance of five property bodies — the British Council for Offices, British Council of Shopping Centres, British Property Federation, Investment Property Forum and Royal Institution of Chartered Surveyors.

Many will find the commentary on the composition of Tier 1 Capital interesting, particularly given the Canadian limits following OSFI’s debasement of bank capital:

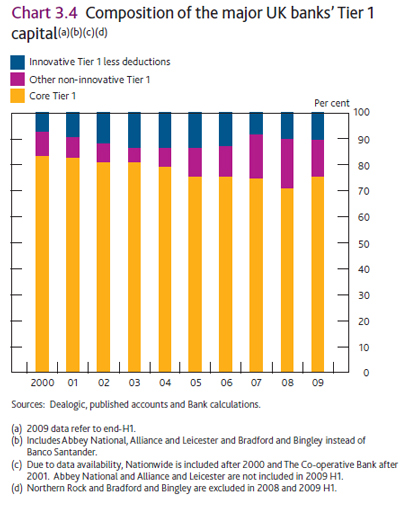
Ahead of the crisis, the composition of banks’ capital shifted away from common equity and reserves (core Tier 1 capital) towards lower-quality instruments (Chart 3.4). Experience during the crisis in the United Kingdom and elsewhere has revealed that these instruments were not always able to absorb losses for going-concern banks.

There is now broad agreement internationally that equity and reserves should form a much larger part of banks’ capital in the future. The Bank believes that no instrument should be classified as going-concern capital if it does not have the same loss-absorbing characteristics as common equity. In practice, this means either that the principal of the instrument can be written down at the same time and to the same extent as common equity, or that the instrument is convertible into equity — so-called ‘contingent capital’.

And now we’re getting into the meaty bit! Contingent Capital is a vital concept for preferred shareholders: I am convinced that the preferred share as we know it is dead; it will all be contingent at some point in the future. Bet a nickel.

On what terms private non-bank investors would be willing to provide such insurance remains unclear. For example, investor appetite may initially be restricted if these instruments are excluded from benchmark indices or are not permitted under certain investment mandates. If, over time, an investor base for such instruments did not develop, this would provide a useful signal that debt investors were unwilling to accept losses on their investments in banks. For contingent capital instruments to be loss-absorbing, their design needs careful consideration. In this respect, the definition of the conversion trigger is crucial. Contingent capital would need to convert automatically, or at the discretion of the regulator, rather than on the initiative of the issuer. Setting the trigger involves balancing the risk of conversion too soon (before capital is needed) and too late (when funding problems may already have emerged). The acceptable level of contingent capital within banks’ capital structure also needs to be considered carefully. Too much convertible debt could increase the risk of a bank equity price ‘death spiral’ — whereby investors may short-sell the stock in anticipation of dilution as the trigger for conversion comes closer.

This constant harping on regulatory discretion really gets on my wick. In a crisis, the pronouncement by a regulator that Bank X is sufficiently endangered that it needs to trigger conversion will be a death sentence. Conversion needs to be automatic, predictable and hedgeable: as I have argued countless times, these conditions are met by setting a trigger-and-conversion price at the time of issue of the non-equity capital (maybe 50% of issue-time common price for Tier 1; 25% for Tier 2). If the common price falls below the trigger price (on a well-defined exchange in a well defined way for a well defined period) then the contingent capital converts at that particular trigger price. Holders who wish to hedge will be able to buy options with their income payments … alternatively, options players may wish to buy the CoCo from the existent holders in order to get the embedded option; this will depend on the market price of the CoCo.

Death Spirals are not an issue if the conversion price is fixed; and become less important as a minimum coversion price increases (e.g., in Canadian Operating Retractible issues, the minimum conversion price is $2, which prevented the IQW.PR.C conversion from becoming a death spiral … although it ultimately made no difference).

The BoE states flatly:

The Bank would support the introduction of a leverage ratio
and this being hard-wired into regulatory rules through Pillar 1, provided that it can be well defined. It will be difficult to set a single standard applicable across different business models and accounting regimes, but it is important to achieve consistent implementation across jurisdictions.

… which, I think, can be taken at face value. Given the tenor of the rest of their discussion, I don’t think they intend to invent problems regarding implementation specifics to mask a distaste for the idea.

I’m not so enthralled with the following:

In a recent Discussion Paper (DP), the Bank contributed to emerging ideas on how such a macroprudential regime could be made operational.(2)
The DP examined the possibility of applying time-varying capital surcharges on banks to dampen cyclical exuberance (the orange bars in the stylised example in Chart 3.13). Raising capital requirements in a credit boom would offer greater self-insurance for the financial system against a subsequent bust. It could also provide incentives for banks to restrain exuberant lending by raising its marginal cost. In addition, the DP suggested that capital surcharges could be imposed on firms to better reflect their individual contribution to systemic risk (the magenta bars in Chart 3.13). These would be based on factors such as firms’ size, complexity, interconnectedness and propensity to cause losses to others through asset fire sales. The key objective would be to lower the probability of default of banks whose failure would impose a large spillover cost on the financial system. Systemic surcharges could also provide incentives for banks to alter their balance sheets or business models, supporting structural initiatives in this area (see Section 3.2).

I don’t support the nod-and-wink model of regulation by any means, and the proposals to give regulators discretion in such matters will only enhance the attractiveness of regulatory capture. Counter-cyclical requirements, yes: have a surcharge on asset growth over the past 5-10 years. Systemic surcharges, yes: have a surcharge on a progressive schedule based on risk-weighte assets. Regulatory discretion? No. Not only can’t the regulators be trusted with that degree of power (NOBODY can be trusted with that degree of power), but it raises the spectre of single-point failure even higher and will make the regulators the mutual plaything of the banks and politicians.

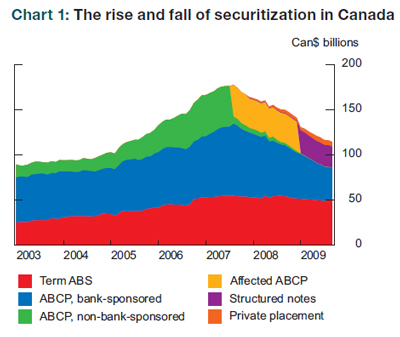
The next part is good. In Canada, we denigrate the shadow-banking sector:

With these objectives in mind, HM Treasury has announced that it intends to publish a discussion paper on developing non-bank lending channels in the United Kingdom, drawing on advice from the FSA and the Bank.(1) Key issues to be considered include identifying necessary improvements to market infrastructure that will help corporate borrowers to access non-bank investors.

One thing I haven’t seen before is the proposal to treat all retail deposits as covered bonds:

One way of ensuring continuity of payment services could be to require banks to invest retail deposits solely in risk-free assets such as government bonds — an approach commonly referred to as ‘narrow banking’. A number of commentators have put forward proposals along these lines in response to the crisis.(1) This could be seen as an extension of arrangements already in place for private banknotes issued by some Scottish and Northern Irish banks. These banks are required to hold cash or credit balances with the Bank of England fully backing their note issuance. These assets cannot be used for any other purpose and would be excluded — or ‘ring-fenced’ — from any insolvency proceeding and reserved for satisfying the claims of note holders.

An arrangement where retail deposits are backed by risk-free assets need not require the creation of dedicated narrow banks, although this could conceivably occur naturally over time. Existing banks could instead be required to segregate their retail deposit books and the assets backing them within their internal structures. The segregated part of a bank would effectively be subject to a 100% liquidity requirement, and would need to be easily extractable from the wider group using available resolution tools. In this way, the integrity of the payment system would be assured, while still allowing banks to exploit economies of scope between payment services and other types of banking activity.

Interesting External Papers

TIPS Market Microstructure

The Federal Reserve Bank of New York has published a staff report by Michael J. Fleming and Neel Krishnan title The Microstructure of the TIPS Market. The authors examined the electronic records of inter-dealer broker trading, which provided quotes and trade sizes, everything time-stamped to the second. Nothing particularly useful here, perhaps, but there are some items of interest.

Trading activity for on-the-run TIPS is substantially higher than it is for off-the-run TIPS (Table 3). Daily trading in the on-the-run 10-year note thus averages $137 million, more than six times higher than average trading volume ($22 million) of individual off-the-run 10-year notes. The comparable ratio for the 5-year note is just over three ($87 million versus $27 million) and it is somewhat less than five for the 20-year bond ($30 million versus $6 million). Such on-the-run/off-the-run differentials are just as striking in the nominal market (Fleming (2002), Fabozzi and Fleming (2005), Goldreich, Hanke, and Nath (2005), and Barclay, Hendershott, and Kotz (2006)), reflecting a concentration of liquidity in just a few securities, and in those securities that tend to have the largest floating supplies.

While there is a similar on-the-run/off-the-run divergence in daily trading frequency, such a pattern is not evident in trade size. In fact, average trade sizes are actually slightly higher for off-the-run TIPS.

While bid-ask spreads and quoted depth are similar for on-the-run and off-the-run securities, “quote incidence” is markedly higher for on-the-run securities. Quote incidence gauges the percent of time there are two-sided quotes in a security (that is, both a posted bid price and a posted offer price). This proportion averages close to 60% for the on-the-run 10-year note (during New York trading hours, defined as 7:30 a.m. to 5 p.m.), but only about 15% for any given off-the-run 10-year note. That is, for off-the-run 10-year notes, there is a one-sided quote, or no quote, about 85% of the time.

There are pronounced day-of-week effects in trading activity in the TIPS market, as there are in the nominal market. In particular, trading volume is lowest on Monday, averaging $424 million, highest on Wednesday and Thursday, averaging $615 and $658 million, respectively, with Tuesday and Friday in between, at $552 and $546 million, respectively. These patterns remain when controlling for the announcements examined in this paper.

Interesting External Papers

Market Timing by Issuers

The Bank of Canada has released Discussion Paper 2009-14 by Jonathan Witmer, Market Timing of Long-Term Debt Issuance:

The literature on market timing of long-term debt issuance yields mixed evidence that managers can successfully time their debt-maturity issuance. The early results that are indicative of debt-maturity timing are not robust to accounting for structural breaks or to other measures of debt maturity from firm-level data that account for call and put provisions in debt contracts. The author applies the analysis from some recent U.S. studies to aggregate Canadian data to determine whether the market-timing results are robust. Although the relation between debt maturity and future excess returns is in the same direction as in the United States, it is not statistically significant. This mixed evidence, combined with the difficulties in interpreting predictive regressions of this nature, provides little support for the notion that firms can effectively reduce their cost of capital by varying the maturity of their debt issuance to take advantage of market conditions. Managers do, however, try to time their debt-maturity issuance, given that long-term corporate debt issuance in both Canada and the United States is negatively related to the term spread.

One possible mechanism of interest is:

An argument against [firms that are successfully timing an inefficient market as an explanation for the relation between future excess long-term bond returns and the long-term share [return]] is that, as a whole, corporate managers should not have inside information on the evolution of future market interest rates, so the evidence that their issuance decisions predict interest rates raises the question as to how firms in the aggregate have some sort of advantage over other sophisticated market participants, such as banks and institutional investors, in recognizing market mispricings. To explain this, Greenwood, Hanson, and Stein (2009) propose a “gap-filling” theory, whereby corporate issuers act as macro liquidity providers (e.g., by issuing long-term debt) in a segmented bond market where certain groups of investors have fixed maturity preferences for long-term assets.19 Consistent with this theory, they show that corporations issue more long-term debt when the government issues relatively less long-term debt.20 Moreover, they use firm-level data to show that larger firms and firms in better financial position are more likely to engage in “gap filling.” If long-term Treasuries provide a lower expected return when their supply decreases relative to short-term Treasuries,21 this provides an explanation of the apparent ability of corporations’ aggregate issuing characteristics to predict future bond returns.

This would be the flip-side of “crowding out”.

However, the author concludes:

In Canada, the relation between debt maturity and future excess returns is in the same direction as in the United States, but it is not statistically significant. This mixed evidence, combined with the difficulties in interpreting predictive regressions of this nature, provides little support for the notion that firms can effectively reduce their cost of capital by varying the maturity of their debt issuance to take advantage of market conditions. Managers do, however, try to time their debt-maturity issuance, given that longer-term corporate debt issuance in both Canada and the United States is negatively related to the term spread. In the United States, corporations also may be providing liquidity at a macro level, since corporate debt issuance is negatively related to the proportion of government long-term debt outstanding. In Canada, there is less evidence for a relation between these two variables. Hence, while managers are not successful at forecasting future returns, they at least attempt to do so, and changing their maturity structure in such a way could increase the risk of liquidation if managers issue more short-term debt in an attempt to time interest rates. But the increased liquidation risk at the end of the sample period caused by debt-maturity timing is probably minimal, given that Canadian corporations had a long-term share of corporate debt outstanding comparable to historic norms.

One possible mechanism that I was sorry to see not tested or discussed is the idea that managers out-perform the market because they have inside information about their own firms and projects. Under this hypothesis, managers would issue 30-year paper to fund a long-term project simply because the numbers work for them – e.g., future operational profits will exceed the cost of funding (hopefully substantially). Their ability to fund long term profitable projects should, in aggregate, affect macroeconomic spreads and bond returns, since project will be funded when the required yield works, and not funded when it doesn’t.

Interesting External Papers

BOC Releases Dec 2009 Financial System Review

The Bank of Canada has released the December 2009 Financial System Review with special reports on:

  • Liquidity Standards in a Macroprudential Context
  • Improving the Resilience of Core Funding Markets
  • Reform of Securitization
  • Towards a Stress-Testing Model Consistent with the Macroprudential Approach

The article on Liquidity Standards takes note of the resilience of Canadian banks:

Several factors help to explain this relative resilience of Canadian banks. First, they did not hold the same quantity of “toxic” assets as their international peers and had strong capital ratios and high-quality capital that enabled them to absorb the losses that did occur. For example, Canadian banks were not involved in the U.S. subprime-mortgage market to the same extent as many of their major foreign counterparts, and thus were (generally) seen as less-risky counterparties in funding markets. Second, and perhaps even more important, were their liquidity and funding profiles. While Canadian banks have, over time, reduced their holdings of liquid assets as a share of total assets, the relative decline was more modest than in some other countries (Chart 1). Third, while Canadian banks have increasingly relied on funding from capital markets, this has been balanced to some extent by continued reliance on retail deposits for a significant share of their funding (Chart 2). Moreover, their reliance on securitization markets has been markedly less than was the case internationally. As noted by the International Monetary Fund (IMF), with relatively larger holdings of liquid assets and more stable sources of funding, Canadian banks were better positioned to handle liquidity shocks than many foreign banks.

The IMF paper has been discussed on PrefBlog; I was beginning to wonder if I’d just imagined it, given OSFI’s lack of intellectual integrity in refusing to acknowledge the matter.

The second article makes an interesting point on CMB spreads:

The behaviour of spreads on Canada Mortgage Bonds (CMBs) during the recent period of market turmoil suggests that this contagion channel was at work. CMBs are explicitly guaranteed by the Government of Canada (GoC) and, thus, changes in the spreads of CMBs (above the yields on bonds issued directly by the GoC) refl ect a lack of market liquidity, not changes in the risk of default. Following the collapse of Lehman Brothers in September 2008, CMB spreads rose markedly from relatively low and stable levels (Chart 1). As is well known, spreads across fixed-income markets also widened sharply over this period. The rise in corporate bond spreads, or other non-government securities, also reflected expectations of a deteriorating economic environment and the associated increase in defaults. The same cannot be said of the rise in CMB spreads. It is therefore likely that a rising system-wide liquidity premium explains the common increase in all fixed-income spreads relative to more-liquid GoC securities.

The impact of the Bank’s Term Purchase and Resale Agreement (PRA) Facility1 and the federal government’s Insured Mortgage Purchase Program (IMPP),
introduced in October 2008, also suggests that illiquidity was a key factor in rising spreads.2 For example, by December 2008 just prior to the second IMPP announcement, CMB spreads had dropped by around 33 basis points, while all other spreads had increased as the crisis intensified (including spreads on high-quality provincial bonds). By January 2009, CMB spreads had fallen further, while all other spreads were either fl at or higher. With the generalized improvement in market conditions that took hold in March 2009, all spreads tightened considerably.

The article on securitization has a great chart:

The article was a little spoiled by the assertion that only Credit Rating Agencies are smart enough to understand securitization:

CRAs may have little incentive to make their methodologies, assumptions, and information used in the rating process transparent. Yet, investors and regulators need this information to manage and control risk.

Bull. Investors and regulators need a model of some kind, certainly. And they need to understand the model – naturally. And they may wish to delegate the building of that model to the CRA’s – it’s cheaper! But the implicit assertion that CRAs must disclose their analytical methodology because they’re the only smart guys in town would be insulting if it wasn’t so ridiculous.

Their statement also appears to contradict the most sensible thing ever written by a Bank of Canada analyst (Mark Zelmer in the Dec ’07 FSR):

In the end though, investors need to accept responsibility for managing credit risk in their portfolios. While complex instruments such as structured products enhance the benefits to be gained from relying on credit ratings, investors should not lose sight of the fact that one can delegate tasks but not accountability.

However, the authors, Jack Selody and Elizabeth Woodman, redeem themselves somewhat by pointing out the flaws in regulation:

The potential for regulatory arbitrage arises when prudential regulation does not properly recognize implicit contingent claims. Ignoring these claims leads to the assumption that risk to the fi nancial system is eliminated when securitized products are moved off the balance sheet of the original lender. As a result, capital is not required, even though the originator or sponsor, in effect, retains a partial liability associated with the instrument. Thus, when markets for these products froze and values declined, there was instability in the financial system as retained but uncapitalized and uncommunicated liabilities came to light, causing investors to question the valuations they placed on the equity of financial institutions.

They would have redeemed themselves completely if they had pointed out that Money Market Funds are a form of securitization!

They state:

The alignment of incentives could be improved by requiring issuers to retain a portion of an issue of a new debt instrument, thereby sharing in the risk.

… which is also an element in the UK FSA Plan. Come on, now! Are these securitization or covered bonds? Make up your minds! Tranche retention is simply a method whereby the big banks can protect their moat and reduce competition. Besides, if tranche retention is made mandatory, then incompetent portfolio managers won’t be able to blame the vendors for their poor performance, increasing the risk that they’ll be driven out of business and consequently unable to hire ex-regulators for their compliance departments. And if ex-regulators can’t get jobs in the business, then what’s the point of regulation, anyway?

The authors then have a good cry about just how compwicated investing is:

If products are too complex, investors have difficulty understanding and managing the risks inherent in the asset-backed debt instruments they hold.

I have difficulty understanding why such investors would buy the stuff – and why I should care if they do.

Interesting External Papers

BIS Publishes 4Q09 Quarterly Review

The Bank for International Settlements has released its December 2009 Quarterly Review with:

  • A review of current conditions
  • Macro stress tests and crises: what can we learn?
  • Monetary policy and the risk-taking channel
  • Government size and macroeconomic stability
  • Issues and developments in loan loss provisioning: the case of Asia
  • Dollar appreciation in 2008: safe haven, carry trades, dollar shortage and overhedging

The review contained the following snippet of interest:

the market-implied price of credit risk also continued its downward trend, but to its pre-crisis level (Graph 11, left-hand panel).

The return to more normal credit market conditions was also reflected in corporate bond issuance (Graph 11, right-hand panel, and Highlights section).


Click for big

The methodology used to prepare the chart of market implied cost of risk has been summarized on PrefBlog.

The paper by Leonardo Gambacorta, Monetary policy and the risk-taking channel, has been highlighted by Bloomberg and makes the claim that ‘reaching for yield’ is not merely a retail problem:

This paper investigates the link between low interest rates and bank risk-taking. Monetary policy may influence banks’ perceptions of, and attitude towards, risk in at least two ways: (i) through a search for yield process, especially in the case of nominal return targets; and (ii) by means of the impact of interest rates on valuations, incomes and cash flows, which in turn can modify how banks measure risk. Using a comprehensive dataset of listed banks, this paper finds that low interest rates over an extended period cause an increase in banks’ risk-taking.

For instance:

The inertia in nominal targets at a time of lower interest rates may reflect a number of factors. Some are psychological, such as money illusion: investors may ignore the fact that nominal interest rates may decline to compensate for lower inflation. Others may reflect institutional or regulatory constraints.

More generally, financial institutions regularly enter into long-term contracts committing them to produce relatively high nominal rates of return. The same mechanism could be in place whenever private investors use short-term returns as a way of judging manager competence and withdraw funds after poor performance

In the short term, low interest rates reduce the probability of default of outstanding variable rate loans, by reducing interest burdens of existing borrowers. In the medium term, however, due to the higher collateral values and the search for yield, banks tend to grant more risky loans and, in general, to soften their lending standards: they lend more to borrowers with bad credit histories and with more uncertain prospects. Overall, these results suggest that low interest rates reduce credit risk in banks’ portfolios in the short term – since the volume of outstanding loans is larger than the volume of new loans – but raise it in the medium term.

The empirical exercise points to a number of other interesting findings. First, developments in housing prices prior to the crisis appear to have contributed to bank risk-taking. An inflation-adjusted house price growth rate that is 1 percentage point above its long-run average for six consecutive years leading up to the crisis increases the probability of default of the average bank by 1.5%. This result is in line with the view that the housing market had a substantial role in the crisis and that banking distress was typically more severe in countries that experienced a more pronounced boom-bust cycle in house prices.

Second, banks that experienced a higher growth rate of lending with respect to the industry average prior to the crisis proved to be riskier ex post. For example, lending of about 10% above average over the six years preceding the crisis caused an increase in bank probability of default by 3.9%.

Interesting External Papers

Risk aversion and risk premia in the CDS market

Jeffery D Amato wrote a paper with the captioned title in the BIS Quarterly Review, 4Q05:

Credit default swap (CDS) spreads compensate investors for expected loss, but they also contain risk premia because of investors’ aversion to default risk. We estimate CDS risk premia and default risk aversion to have been highly volatile during 2002–2005. Both measures appear to be related to fundamental macroeconomic factors, such as the stance of monetary policy, and technical market factors, such as issuance of collateralised debt obligations.

To proxy for default probabilities, we use one-year EDFs™ as in the study by Berndt et al (2005). EDFs™ are constructed using balance sheet and equity price data under the principles of a Merton-type model for gauging the likelihood of default. Our data on EDFs™ are available at a monthly frequency for all but two firms in the CDX.NA.IG.4 index. Aggregate and sector EDFs™ are constructed as simple arithmetic averages of existing data on the constituents.

In order to see how we obtain measures of risk premia and risk aversion, note that CDS spreads can be roughly decomposed as follows:

CDS spread = expected loss + risk premium
= expected loss x risk adjustment

where

risk adjustment = 1 + price of default risk

The first equation above says that the CDS spread is approximately equal to expected loss plus a risk premium, where the latter is compensation paid to investors for enduring exposure to default risk. In the second equation, the spread is re-expressed in terms of risk-adjusted expected loss, where the risk adjustment varies proportionally with the price of default risk. The price of default risk has the interpretation as the compensation per unit of expected loss. It is an indicator of investors’ aversion to default risk: a positive price of risk means that investors demand that they be paid more than actuarial losses. Hereafter, we will use the terms “price of default risk” and “indicator of default risk aversion” interchangeably.

While the formulations of spreads above isolate a “risk premium” and a “price of risk”, in principle there are two distinct types of default risk that may command a premium. One is cyclical variation in expected loss, which usually rises during economic downturns, when overall income growth is low. The other is the actual default of an entity and its impact on investors’ wealth due to an inability to perfectly diversify credit portfolios. In the literature, these are generally referred to as systematic and jump-at-default risk, respectively.


Click for big

The use of Moody’s KMV methodology to determine intrinsic default probability is similar to the Bank of England approach, but different from the recently published Bank of Canada liquidity research which, essentially, assigns a value of zero to the variable “price of default risk”.